. 2019 Nov 5;116(45):22754-22763.
doi: 10.1073/pnas.1908762116. Epub 2019 Oct 18.

Mutations in thyroid hormone receptor α1 cause premature neurogenesis and progenitor cell depletion in human cortical development

Affiliations

Mutations in thyroid hormone receptor α1 cause premature neurogenesis and progenitor cell depletion in human cortical development

Teresa G Krieger et al. Proc Natl Acad Sci U S A. .

Erratum in

Abstract

Mutations in the thyroid hormone receptor α 1 gene (THRA) have recently been identified as a cause of intellectual deficit in humans. Patients present with structural abnormalities including microencephaly, reduced cerebellar volume and decreased axonal density. Here, we show that directed differentiation of THRA mutant patient-derived induced pluripotent stem cells to forebrain neural progenitors is markedly reduced, but mutant progenitor cells can generate deep and upper cortical layer neurons and form functional neuronal networks. Quantitative lineage tracing shows that THRA mutation-containing progenitor cells exit the cell cycle prematurely, resulting in reduced clonal output. Using a micropatterned chip assay, we find that spatial self-organization of mutation-containing progenitor cells in vitro is impaired, consistent with down-regulated expression of cell-cell adhesion genes. These results reveal that thyroid hormone receptor α1 is required for normal neural progenitor cell proliferation in human cerebral cortical development. They also exemplify quantitative approaches for studying neurodevelopmental disorders using patient-derived cells in vitro.

Keywords: brain development; iPSCs; thyroid hormone.


Conflict of interest statement

The authors declare no competing interest.

Figures

Fig. 1.
Fig. 1.
THRA mutations are associated with structural abnormalities in the brain. (A) Structural modeling of the ligand-binding domain of TRα1 showing the position of mutations (red). The mutations in patients P4 (A382PfsX7), P2 and P3 (F397fs406X), and P1 (E403X) disrupt or truncate the carboxyterminal alpha helix (H12; black) of the receptor, exposing a hydrophobic cleft that facilitates corepressor (CoR; blue) binding by unliganded receptor (Left) and removing or changing amino acids required for T3 (cyan) binding and coactivator (green) recruitment (Right). (B) MRI scans of patients P1 and P2 and a control subject (female, age 10 y 8 mo) with T2-weighted axial images (Top) and T1-weighted coronal images (Bottom), showing increased CSF space (arrows) around the cerebellum and between folia, denoting reduced cerebellar size. (C) Sagittal images from MRI brain scans of adult cases P3 and P4 and a control subject (female, age 52 y) showing microencephaly. (D) Tract-based spatial statistics analysis of DTI data in patients P1 and P2. Tracts highlighted in blue signify greater mean diffusivity (MD) of water than in controls (n = 20 age- and sex-matched subjects), and tracts highlighted in green denote not significantly different MD compared with controls.
Fig. 2.
Fig. 2.
Inefficient cortical induction of THRA mutation-containing iPSCs. (A) Schematic of the in vitro cortical differentiation protocol. (B) TRα1 is expressed in cycling Ki67+ progenitors as well as postmitotic Tuj1+ neurons derived from control iPSCs. (Scale bars: 50 μm.) (C) Representative pictures showing reduced progenitor rosette formation and Pax6 expression in THRA mutation-containing cells compared with control cultures at day 15. At least 3 independent differentiations were performed for 1 clone from each patient. (Scale bars: 50 μm.) (D) Quantification of Pax6 expression within and outside of neural progenitor cell rosettes in THRA mutant and control cell cultures at day 15 of neural induction. Rosettes were manually delineated based on morphology in 8 or 9 images from 2 or 3 independent inductions for each cell line, and Pax6 expression was measured relative to DAPI (Methods). Error bars indicate SEM. *P < 0.001, 2-sided Student’s t test comparing a total of nine control and 24 THRA mutant images.
Fig. 3.
Fig. 3.
RNA-seq at day 12 of in vitro cortical induction reveals down-regulation of transcription, neurogenesis, and cell–cell adhesion in THRA mutation-containing cells. (A) 2D hierarchical clustering of log2(RPKM) values for 3 inductions each from control iPSCs and the 3 patient lines. Colors correspond to relative expression in each row, from lowest (blue) to highest (red). Inductions cluster by cell line of origin (vertical axis), while genes separate into 4 differentially expressed groups (horizontal axis). (B) FDR q values of GO terms enriched among group C genes. (C) GO analysis reveals that genes implicated in nervous system development that are down-regulated in THRA mutation-containing cells partially overlap with cell–cell adhesion genes (8/42; 19%) and DNA-templated transcription (10/42; 24%).
Fig. 4.
Fig. 4.
FACS-enriched THRA mutation-containing cortical progenitor cells generate functional neuronal networks. (A) Representative FACS results for WT and THRA mutation-containing cells at day 18. Immunocytochemistry confirmed the cortical identity of FACS- selected progenitor cells. (Scale bars: 50 μm.) (B) Neurons produced by FACS-purified progenitor cells expressed the cortical layer-specific transcription factors TBR1 (layer VI) and CTIP2 (layer V), as well as the vesicular glutamate transporter vGlut1, at day 40. (Scale bars: 50 μm.) (C) Representative traces showing action potential firing in response to stepwise current injection in THRA mutation-containing and control neurons. Numbers indicate the proportion of cells that fired action potentials. (D) Calcium indicator Oregon Green BAPTA was used as a proxy for action potential firing to measure spontaneous neuronal activity. Fluorescence images show control and THRA mutant cultures after loading. Heat maps highlight different levels of activity across the cultures. Total calcium activity across the field of view, ACa, was quantified based on 3 to 6 videos from each cell line (403X and FS382, n = 6 samples from 2 independent inductions; all others, n = 3 samples from 1 induction; *P < 0.05, Student’s t test). Error bars indicate SEM.
Fig. 5.
Fig. 5.
Clonal lineage analysis reveals marked differences between THRA mutation-containing and control progenitor cell dynamics. (A) Schematic of the experimental protocol. GFP-labeled cortical progenitor cells were enriched for by FACS and mixed with WT cultures at day 30 or 40. Cultures were fixed for analysis after 2, 6, or 10 d of incubation. (B) Representative images of THRA mutant and control clones derived from a single progenitor cell after 2, 6, and 10 d, immunostained for Ki67 (progenitors) and βIII-tubulin (neurons). (Scale bars: 50 μm.) (C) Average clone size and average number of Ki67+ cells per clone over time; each data point represents the average of n = 50 to 72 clones. Error bars indicate SEM.
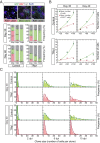
Fig. 6.
Fig. 6.
Clonal dynamics are consistent with a simple model of reduced progenitor output in THRA mutants. (A) The frequency of clones consisting of only Ki67+ cells (rose), only Ki67 cells (gray), or both (green) at the different time points (days postmixing, [dpm]). (Scale bar: 50 μm.) (B) Average clone sizes of persisting clones, with model fit (green line), and average number of Ki67+ cells with the model prediction using the best-fitting parameters (red line). (C) Total clone size distributions and model predictions (lines); each histogram represents n = 152 to 176 clones. In A and B, data points represent the average of 3 control and 3 THRA mutant lines; error bars indicate SEM.
Fig. 7.
Fig. 7.
Cortical rosette self-organized assembly is impaired in THRA mutant cultures. (A) Schematic of the experimental protocol. Dissociated NPCs were plated onto micropatterned chips containing fields of diameter of 140 μm and cultured for several days. (B) Phase-contrast images of individual micropatterned fields at 24 h and 48 h after plating (control-H9 cells). (Scale bar: 100 μm.) (C) Immunostaining of rosettes fixed at 48 h after plating (control cells). Since RGs in vitro are connected by adherens junctions (AJs) at their apical ends (22), expression of the AJ component N-cadherin (Top Left) was used to visualize rosette centers. Rosettes contained Ki67+ cycling cells, and MAP2+ neurons were frequently observed at the periphery (Top Right). The centrosome protein γ-tubulin and the apically expressed atypical protein kinase C were localized to rosette centers (Bottom), demonstrating the apical-basal polarity of Pax6+ and Nestin+ progenitor cells. (Scale bars: 50 μm.) (D) Representative images of THRA mutant and control progenitors plated onto micropatterned chips. N-cadherin (red) was used to visualize rosette centers. (Scale bars: 50 μm.) (E) Bar chart summarizing the proportion of fields of diameter of 140 μm that were occupied by a single rosette (n = 405 for TD, 267 for CK, 187 for KB, 72 for NDC, 279 for NAS6, and 165 for H9, from 2 independent inductions per cell line; *P < 0.001, Student’s t test comparing the 6 THRA mutant vs. 6 control inductions). (F) Representative images of THRA mutant and control progenitors plated onto micropatterned chips. N-cadherin expression (green) is localized to rosette centers in control but not in THRA mutant cultures. (Scale bars: 50 μm.)

References

    1. Bath S. C., Steer C. D., Golding J., Emmett P., Rayman M. P., Effect of inadequate iodine status in UK pregnant women on cognitive outcomes in their children: Results from the Avon Longitudinal Study of Parents and Children (ALSPAC). Lancet 382, 331–337 (2013). - PubMed
    1. Mohan V., et al. , Maternal thyroid hormone deficiency affects the fetal neocorticogenesis by reducing the proliferating pool, rate of neurogenesis and indirect neurogenesis. Exp. Neurol. 237, 477–488 (2012). - PubMed
    1. Pathak A., Sinha R. A., Mohan V., Mitra K., Godbole M. M., Maternal thyroid hormone before the onset of fetal thyroid function regulates reelin and downstream signaling cascade affecting neocortical neuronal migration. Cereb. Cortex 21, 11–21 (2011). - PubMed
    1. Lavado-Autric R., et al. , Early maternal hypothyroxinemia alters histogenesis and cerebral cortex cytoarchitecture of the progeny. J. Clin. Invest. 111, 1073–1082 (2003). - PMC - PubMed
    1. Ausó E., et al. , A moderate and transient deficiency of maternal thyroid function at the beginning of fetal neocorticogenesis alters neuronal migration. Endocrinology 145, 4037–4047 (2004). - PubMed

Publication types

Substances

LinkOut - more resources