. 2019 Oct 18;10(1):4756.
doi: 10.1038/s41467-019-12611-w.

Superresolution architecture of cornerstone focal adhesions in human pluripotent stem cells

Affiliations

Superresolution architecture of cornerstone focal adhesions in human pluripotent stem cells

Aki Stubb et al. Nat Commun. .

Abstract

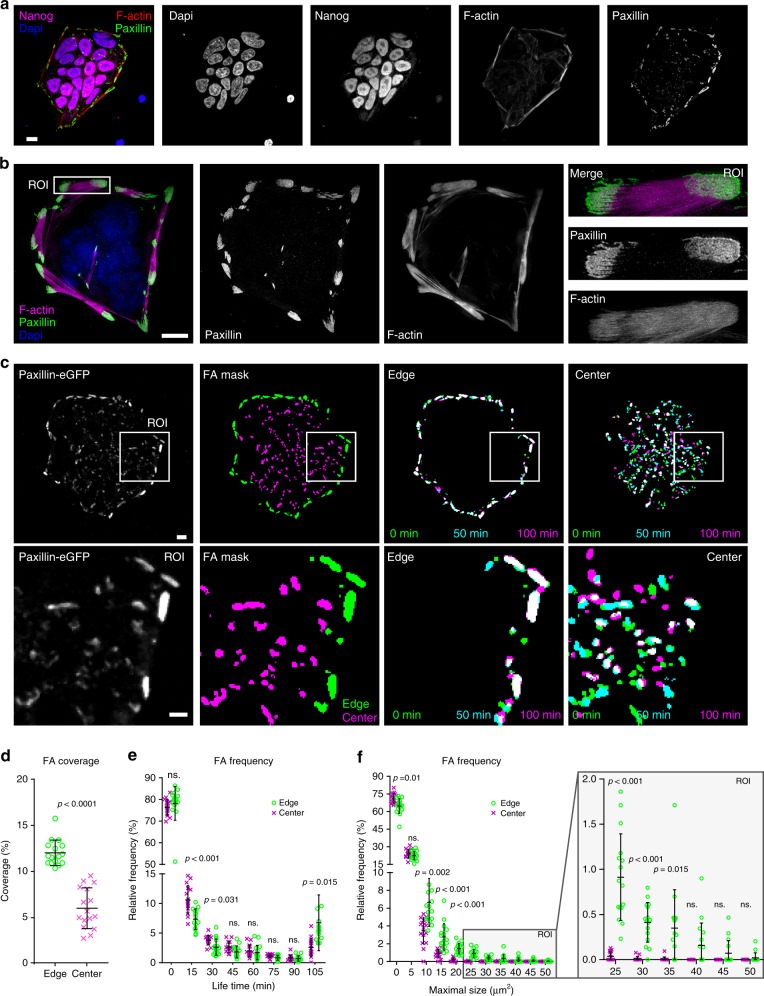
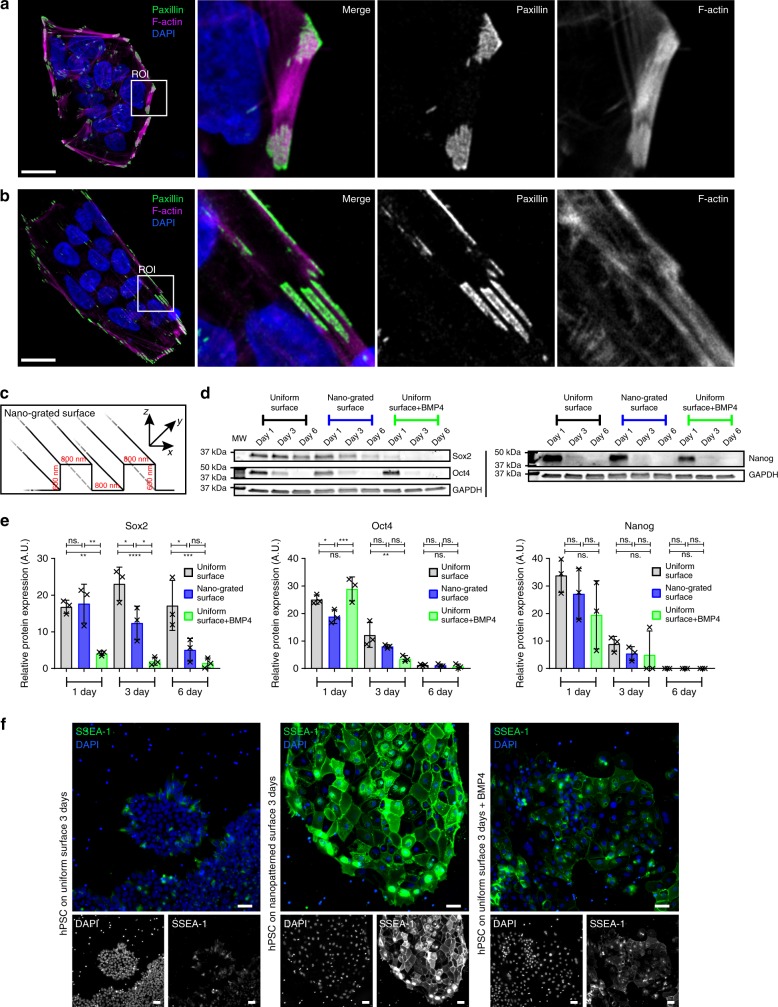
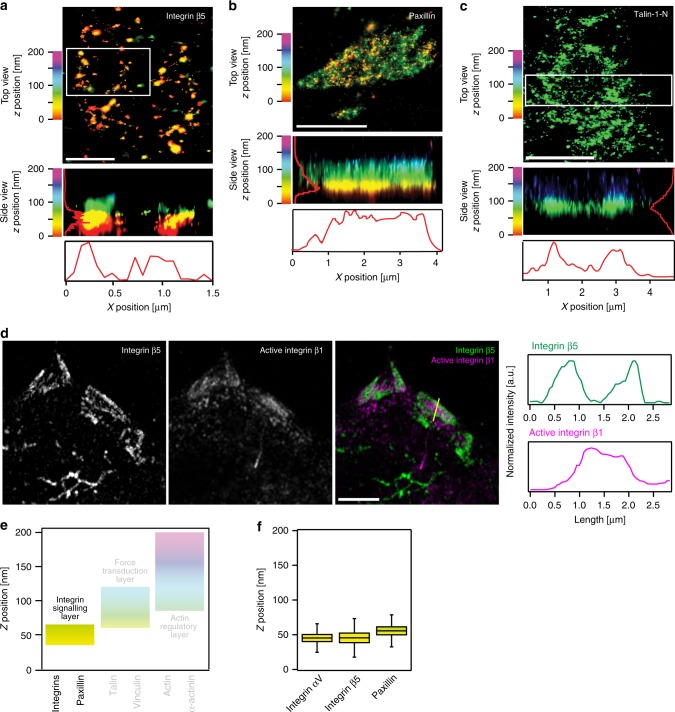
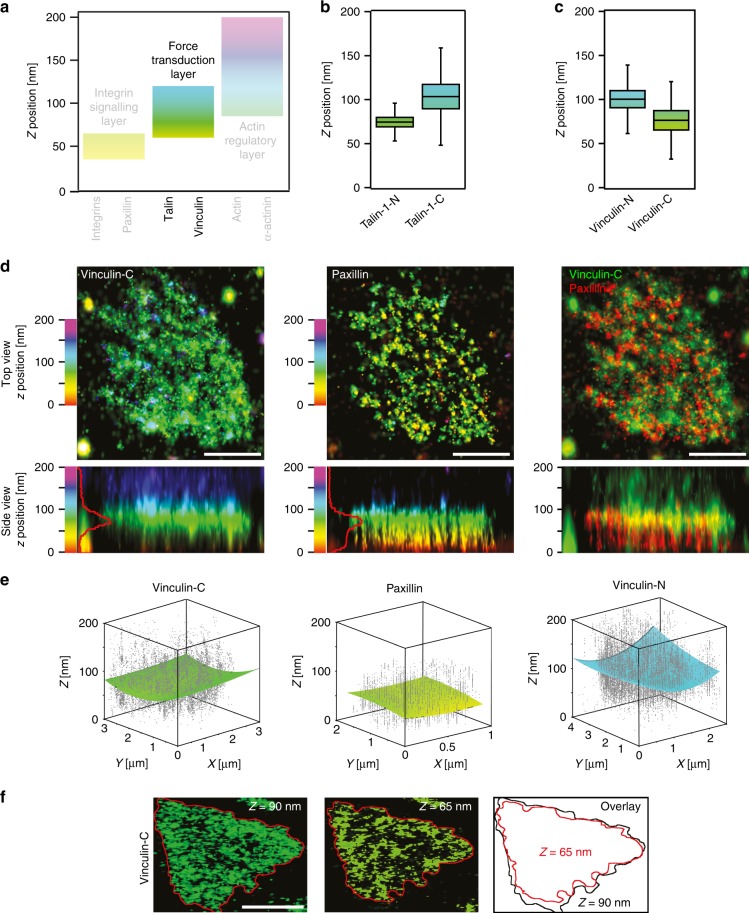
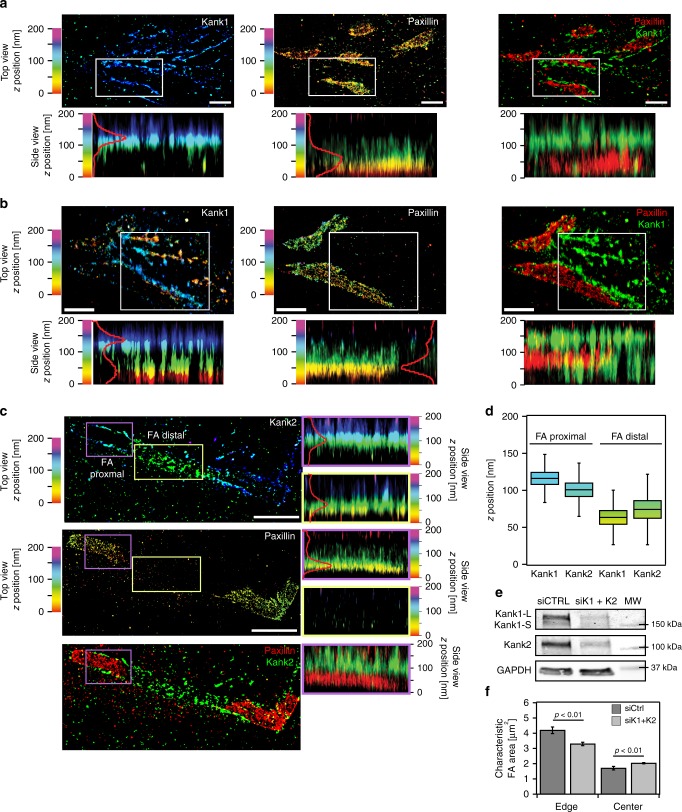
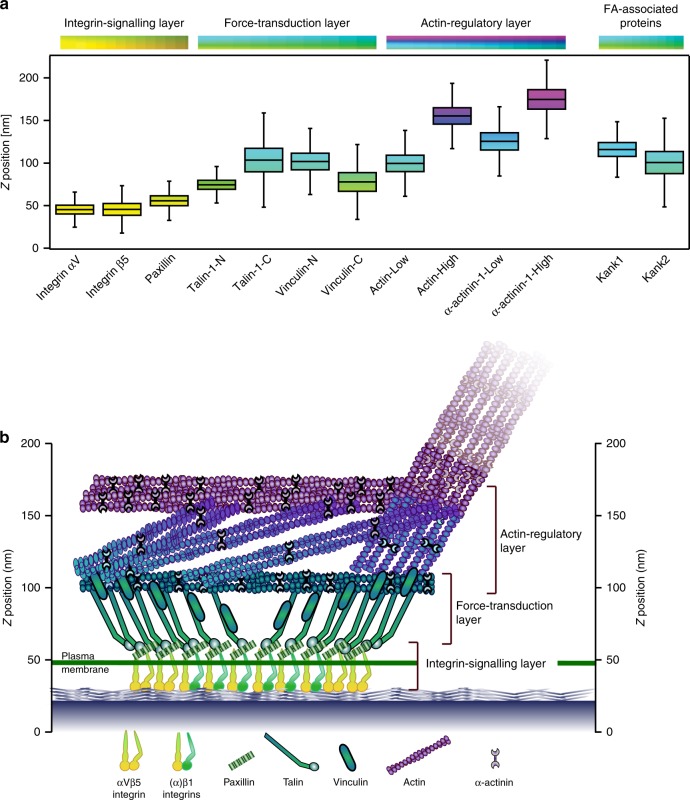
While it is clear that key transcriptional programmes are important for maintaining pluripotency, the requirement for cell adhesion to the extracellular matrix remains poorly defined. Human pluripotent stem cells (hPSCs) form colonies encircled by an actin ring and large stable cornerstone focal adhesions (FA). Using superresolution two-colour interferometric photo-activated localisation microscopy, we examine the three-dimensional architecture of cornerstone adhesions and report vertical lamination of FA proteins with three main structural features distinct from previously studied focal adhesions: 1) integrin β5 and talin are present at high density, at the edges of cornerstone FA, adjacent to a vertical kank-rich protein wall, 2) vinculin localises higher than previously reported, displaying a head-above-tail orientation, and 3) surprisingly, actin and α-actinin are present in two discrete z-layers. Finally, we report that depletion of kanks diminishes FA patterning, and actin organisation within the colony, indicating a role for kanks in hPSC colony architecture.


Conflict of interest statement

The authors declare no competing interests.

Figures

Fig. 1
Fig. 1
Characterisation of cornerstone adhesions. a Spinning disk images of hPSC plated on vitronectin (VTN) and stained for F-actin, paxillin, DAPI, and the pluripotency marker Nanog. Scale bar 10 μm. b Structured illumination microscopy images of hPSC plated on VTN and stained for filamentous actin (F-actin) and paxillin. Scale bar 10 μm. The white square highlights a region of interest (ROI), which is magnified. c–f Live-cell imaging of endogenously tagged paxillin in hPSC. Images were acquired every minute using a spinning disk microscope. Colonies were recorded for at least 105 min (n = 16 independent colonies from three biologically independent experiments). A representative video is available as supplementary information (Supplementary Movie 1). c A representative image is displayed (ROI highlighted by white square and magnified; size, 30 µm) in addition to a mask image highlighting paxillin-positive adhesions (colony edge FA, green; colony centre FA, magenta) and merged images depicting paxillin-positive adhesion lifetime (selected time points 0 min, green; 50 min, cyan and 100 min, magenta) within one hPSC colony (white represents very stable adhesions). d The percentage area covered by paxillin-positive adhesions at the edge or at the centre of hPSC colonies was measured over the duration of the movies. Statistical significance was determined by Student’s t-test (two-tailed, unpaired). e, f The frequency distributions of paxillin-positive adhesion lifetime (e) and maximal size (f) (colony edge FA, green circle; colony centre FA, magenta cross) within hPSC colonies are displayed. Each data point represents the frequency distributions in one hPSC colony. Statistics: multiple t-tests with correction using Holm–Sidak method. Error bars depict standard deviation. Source data are provided as a Source Data file
Fig. 2
Fig. 2
Constraining cornerstone adhesions accelerates spontaneous differentiation. a, b hPSC plated for 24 h on a VTN-coated uniform surface (a) or on a VTN-coated nano-grated surface (nano-grids) (b) in normal (E8 medium) culture conditions, were stained for F-actin, paxillin, and DAPI. Images were acquired using an airyscan confocal microscope. Scale bars 20 μm. A region of interest (ROI) is magnified in each image. c Cartoon highlighting the topography of the nano-grated surface. d, e Representative western blot (d) and quantification (e) of Sox2, Oct4, and Nanog levels in hPSC plated for 1, 3, or 6 days either on VTN-coated uniform surfaces (black/grey), in the presence or absence of BMP4 (green), or on VTN-coated nano-grids (blue) in basal E6 medium (n = 3 biologically independent experiments; two times using hiPSC line HEL 24.3 and 1 time using hiPSC line HEL 11.4). Statistics: one-way ANOVA with multiple comparisons complemented with Bonferonni’s post-hoc test. f hPSC plated for 3 days either on VTN-coated uniform surfaces, in the presence of basal E6 medium and/or BMP4, or on VTN-coated nano-grids, in the presence of basal E6 medium, were stained for SSEA-1 and DAPI. Images were acquired on a spinning disk confocal microscope using a ×20 objective (n = 3 biologically independent experiments). Scale bars 50 μm. Source data are provided as a Source Data file. Error bars depict standard deviation
Fig. 3
Fig. 3
Lateral and vertical segregation of proteins within cornerstone FA. ac Interferometric photo-activated localisation microscopy (iPALM) images of Eos-tagged integrin β5 (a), paxillin (b), and talin-1-N (N-terminally tagged talin-1) (c) in cornerstone FA. Individual cornerstone FA are displayed. Both top-view (xy) and side-view (xz) images are displayed. White boxes indicate the area used to generate the side-view images (in the absence of a white box, the entire image was used). For all images, individual localisations are colour-coded as a function of their z-positioning (distance from the coverslip). In addition, normalised line intensity profiles of the region of interest, in both z- and x-axis, are shown in red lines. d hPSC plated for 24 h on VTN were stained for endogenous integrin β5 and active integrin β1 (mAb 12G10) and imaged using an Airyscan confocal microscope. The yellow line highlights the area used to measure the intensity profiles displayed on the side. Scale bars (a) 1 μm, (b, c) 2 μm, (d) 5 μm. e Schematic representation of the different FA layers previously identified using iPALM in U2OS cells, colour bars highlight the z range for each of the three layers and the integrin signalling layer is emphasised over other layers. f iPALM analysis of the z position (distance from the coverslip, Zcentre) of some of the integrin signalling layer components, Eos-tagged integrins αV (n = 17 biologically independent ROI. Given that cornerstone FAs are clusters of FAs, one ROI may contain multiple FAs. For details on the number of localisations, and HPSC colonies see supplementary Table 1) and β5 (n = 22 biologically ROI), and Eos-tagged paxillin (n = 23 biologically independent ROI), in hPSC cornerstone adhesions. Boxes display the median, plus the 1st and 3rd quartiles (IQR: 25th– 75th percentile). Whiskers correspond to the median ± 1.5 × IQR. Source data are provided as a Source Data file
Fig. 4
Fig. 4
Vinculin distribution and orientation within cornerstone adhesions. a Schematic representation of the different FA layers previously identified using iPALM in U2OS cells, colour bars highlight the z range for each of the three layers and the force transduction layer containing vinculin and talin is emphasised over other layers. b iPALM analysis of the Zcentre for N-terminally (Talin-1-N, n = 54 biologically independent ROI) and C-terminally (Talin-1-C, n = 8 biologically independent ROI) tagged (Eos) talin-1 in hPSC cornerstone adhesions. c iPALM analysis of the Zcentre of N-terminally (Vinculin-N, n = 55 biologically independent ROI) and C-terminally (Vinculin-C, n = 27 biologically independent ROI) tagged (Eos) vinculin in hPSC cornerstone adhesions. d Two-colour iPALM images of Eos-tagged vinculin (Vinculin-C) and endogenous paxillin in a cornerstone FA. Individual cornerstone FA are displayed. Where localisation of vinculin and paxillin are displayed separately, top-view and side-view images are colour-coded as a function of the z-position of the indicated protein. Where fluorescence channels are merged (paxillin, red; vinculin, green), the z position is only displayed in the side view and the colours represent the fluorescence signal for each protein. Scale bar 1 μm. e 3D scatter plots displaying the individual iPALM localisations (grey dots) of endogenous paxillin and Eos-tagged Vinculin-N and Vinculin-C within a single cornerstone adhesion. Surface plots present the fit of those localisations using a two-dimensional polynomial equation. Note that the paxillin localisations are homogeneously flat while localisations of both vinculin constructs form a solid paraboloid. f iPALM xy images of Eos-vinculin-C at selected z-layers in an individual cornerstone FA. Scale bar 1 μm. Source data are provided as a Source Data file. Boxes display the median, plus the 1st and 3rd quartiles (IQR: 25th–75th percentile). Whiskers correspond to the median ± 1.5 × IQR
Fig. 5
Fig. 5
Actin and α-actinin-1 lateral distribution. a Schematic representation of the different FA layers previously identified using iPALM in U2OS cells, colour bars highlight the z range for each of the three layers and the actin-regulatory layer containing actin and α-actinin-1 is emphasised over other layers. b Two-colour iPALM images of Eos-tagged actin and endogenous paxillin in a cornerstone FA. One individual cornerstone FA is displayed. Where localisation of actin is displayed separately, top-view and side-view images are colour-coded as a function of the z-position of the actin molecules. Where fluorescence channels are merged (paxillin, red; actin, green), the z position is only displayed in the side view and the colours represent the fluorescence signal for each protein. Scale bar 1 μm. c Z density profile of paxillin (red) and actin (green) displaying the number of localisations as a function of the z position in an individual cornerstone adhesion. Dotted lines correspond to the experimental data, while solid lines correspond to the fitted data obtained using either a single Gaussian distribution (paxillin) or a sum of two Gaussian distributions (actin). Dashed black lines highlight these two Gaussian distributions. d iPALM image of Eos-tagged α-actinin-1 in an individual hPSC cornerstone FA. Top-view and side-view images are colour-coded as a function of the z-position of the α-actinin-1 molecules. Scale bar 1 μm. e Z-density profile of α-actinin-1 (purple) showing the number of localisations as a function of the z position. Dotted line corresponds to the experimental data while the solid line corresponds to the fitted data obtained using a sum of two Gaussian distributions (dashed black lines). f iPALM analysis of the Zcentre of actin (actin low n = 28 biologically independent ROIs, actin high n = 47 biologically independent ROIs) and α-actinin-1 (α-actinin high n = 31 biologically independent ROIs, α-actinin low n = 27 biologically independent ROIs) in hPSC cornerstone adhesions. “Low” and “High” denote separate peaks in the distribution of the same protein. Source data are provided as a Source Data file. Boxes display the median, plus the 1st and 3rd quartiles (IQR: 25th–75th percentile). Whiskers correspond to the median ± 1.5 × IQR
Fig. 6
Fig. 6
Nanoscale 3D localisation of kank1 and kank2 in hPSC. a–c Two-colour iPALM images of endogenous paxillin together with Eos-tagged kank1 (a, b) or kank2 (c) in the vicinity of hPSC cornerstone adhesions. Multiple cornerstone FA are displayed. Kank1 forms a wall surrounding cornerstone adhesions (a) and is also found outside of adhesions (b). Kank2 also localises both in proximity (c, purple box), and distal (c, yellow box), to cornerstone adhesions. Where localisation of kank1 and kank2 are displayed separately, top-view and side-view images are colour-coded as a function of the z-position of the indicated molecules. Where fluorescence channels are merged (paxillin, red; kank1/kank2, green), the z position is only displayed in the side view and the colours represent the fluorescence signal for each protein. Side views are for selected regions (white, yellow, and purple insets). Scale bars 1 μm. d iPALM analysis of the Zcentre of kank1 (Kank1 adjacent, n = 29 biologically independent ROIs; Kank1 distal, n = 17 biologically independent ROIs) and kank2 (Kank2 adjacent, n = 17 biologically independent ROIs; Kank2 distal, n = 15 biologically independent ROIs) when in close proximity (adjacent) to cornerstone adhesions or when distant to cornerstone adhesions. e Western blot analysis of kank1 and kank2 proteins levels in hPSC pretreated with either control siRNA (siCTRL) or a combination of siRNA targeting kank1 and kank2 (siK1 + siK2) (n = 3). f Quantification of the characteristic FA area at the edges or in the middle (centre) of hPSC colonies pretreated with siCTRL or siK1 + siK2 (n = 3 biologically independent experiments). Bars represent the characteristic FA size obtained by fitting a weighted sum of two exponential densities to a histogram of FA area distribution. Statistics: Student's t-test. Error bars depict one standard deviation error in the fit. Source data are provided as a Source Data file. Boxes display the median, plus the 1st and 3rd quartiles (IQR: 25th–75th percentile). Whiskers correspond to the median ± 1.5 × IQR
Fig. 7
Fig. 7
Overall vertical stratification of cornerstone FA. a Z positioning (Zcentre) of αV and β5 integrins, paxillin, vinculin, talin-1, actin, α-actinin-1, kank1 and kank2 in cornerstone adhesions. Letters –N and –C denote the location of the tag while “low” and “high” denote separate peaks in the distribution of the same protein. Boxes display the median, plus the 1st and 3rd quartiles (IQR: 25th– 75th percentile). Whiskers correspond to the median ± 1.5 × IQR. b Schematic model of the 3D architecture of hPSC cornerstone adhesions. The lateral and vertical positioning of each protein are based on the data presented here. This model does not depict protein stoichiometry. Source data are provided as a Source Data file

References

    1. Takahashi K, et al. Induction of pluripotent stem cells from adult human fibroblasts by defined factors. Cell. 2007;131:861–872. doi: 10.1016/j.cell.2007.11.019. - DOI - PubMed
    1. Yu J, et al. Induced pluripotent stem cell lines derived from human somatic cells. Science. 2007;318:1917–1920. doi: 10.1126/science.1151526. - DOI - PubMed
    1. Boyer LA, et al. Core transcriptional regulatory circuitry in human embryonic stem cells. Cell. 2005;122:947–956. doi: 10.1016/j.cell.2005.08.020. - DOI - PMC - PubMed
    1. Braam SR, et al. Recombinant vitronectin is a functionally defined substrate that supports human embryonic stem cell self-renewal via alphavbeta5 integrin. Stem Cells. 2008;26:2257–2265. doi: 10.1634/stemcells.2008-0291. - DOI - PubMed
    1. Rodin S, et al. Clonal culturing of human embryonic stem cells on laminin-521/E-cadherin matrix in defined and xeno-free environment. Nat. Commun. 2014;5:3195. doi: 10.1038/ncomms4195. - DOI - PubMed

Publication types