. 2019 Oct 18;10(1):4768.
doi: 10.1038/s41467-019-12824-z.

B-1a cells acquire their unique characteristics by bypassing the pre-BCR selection stage

Affiliations

B-1a cells acquire their unique characteristics by bypassing the pre-BCR selection stage

Jason B Wong et al. Nat Commun. .

Abstract

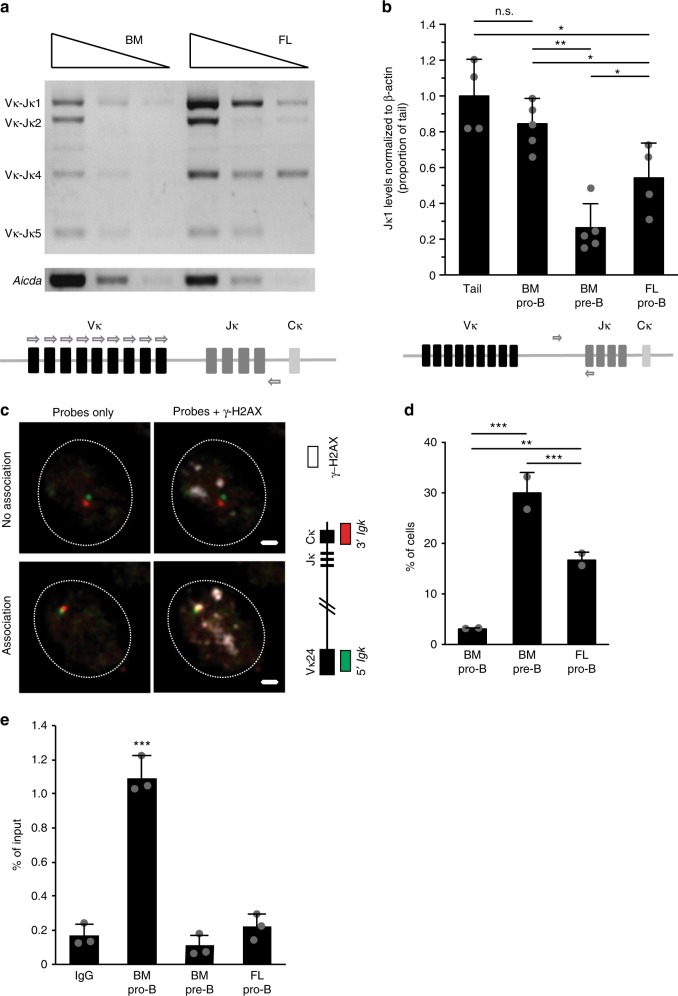
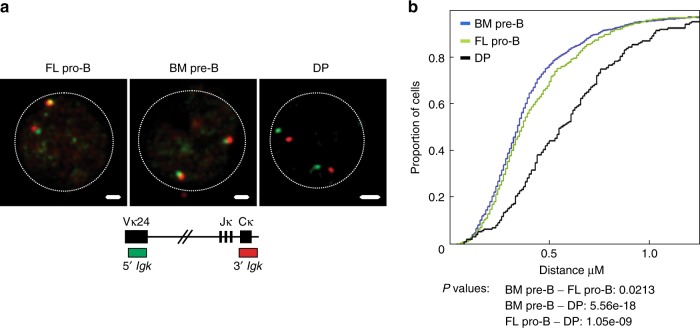
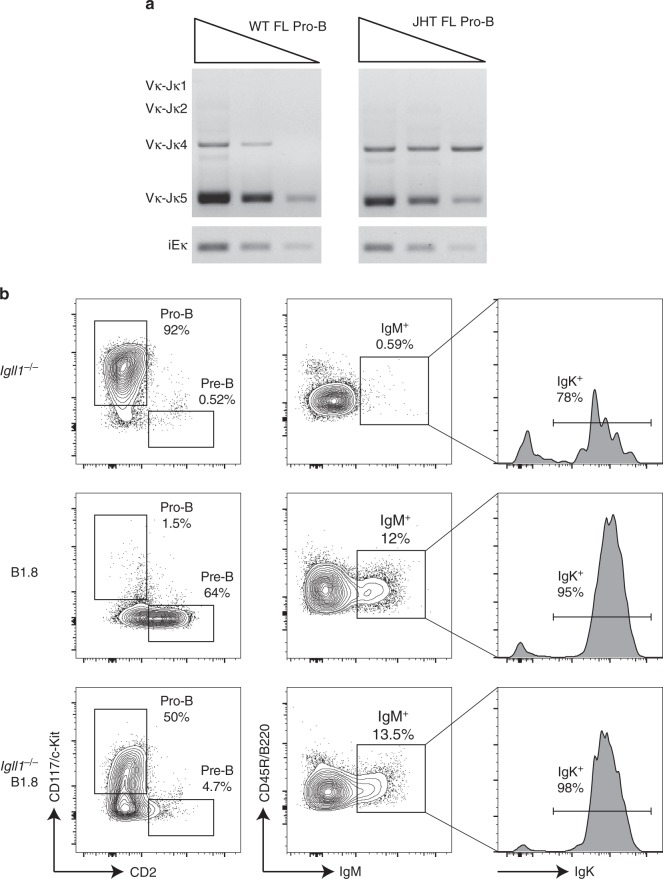
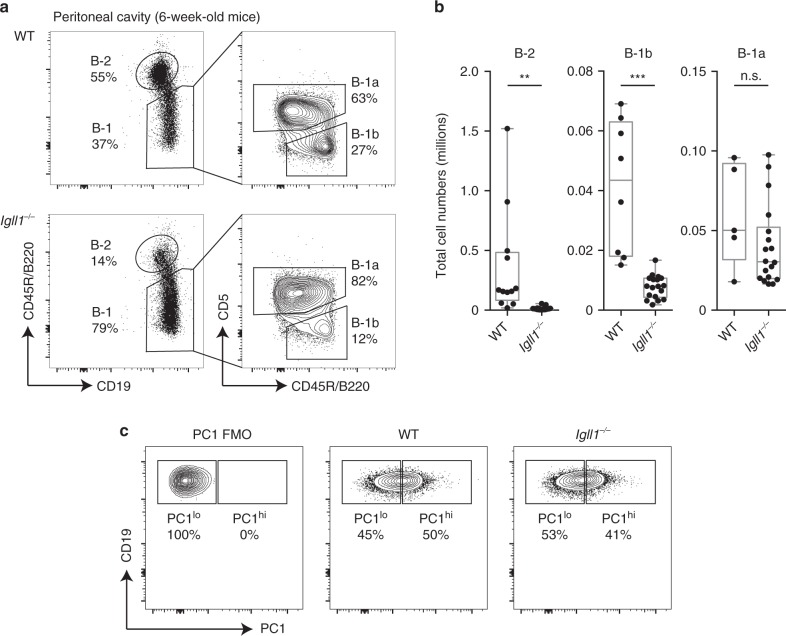
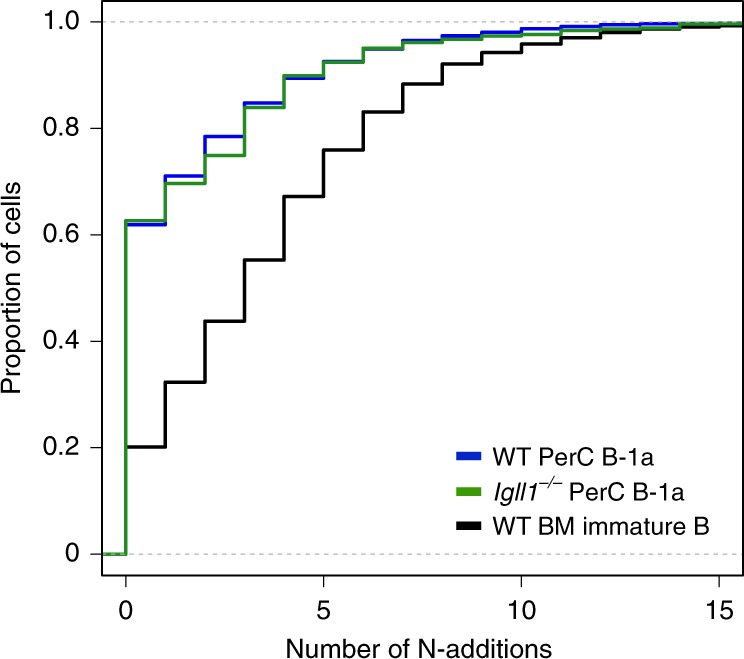
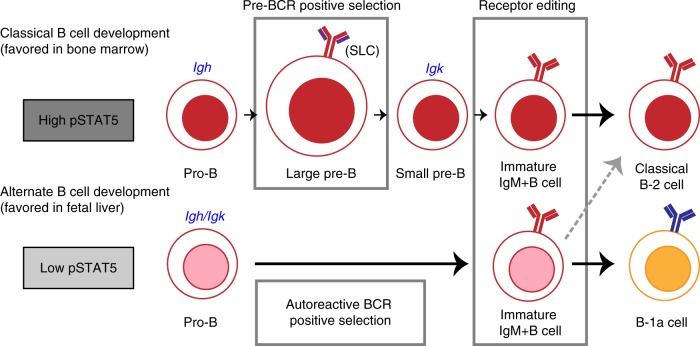
B-1a cells are long-lived, self-renewing innate-like B cells that predominantly inhabit the peritoneal and pleural cavities. In contrast to conventional B-2 cells, B-1a cells have a receptor repertoire that is biased towards bacterial and self-antigens, promoting a rapid response to infection and clearing of apoptotic cells. Although B-1a cells are known to primarily originate from fetal tissues, the mechanisms by which they arise has been a topic of debate for many years. Here we show that in the fetal liver versus bone marrow environment, reduced IL-7R/STAT5 levels promote immunoglobulin kappa gene recombination at the early pro-B cell stage. As a result, differentiating B cells can directly generate a mature B cell receptor (BCR) and bypass the requirement for a pre-BCR and pairing with surrogate light chain. This 'alternate pathway' of development enables the production of B cells with self-reactive, skewed specificity receptors that are peculiar to the B-1a compartment. Together our findings connect seemingly opposing lineage and selection models of B-1a cell development and explain how these cells acquire their unique properties.


Conflict of interest statement

The authors declare no competing interests.

Figures

Fig. 1
Fig. 1
Early Igk recombination is increased in the fetal liver versus bone marrow pro-B cells. a Semiquantitative PCR performed on ex vivo-derived BM pro-B (CD19+B220+IgMCD25CD117+) from 6-week-old mice and FL pro-B (LinCD19+B220+IgMCD2CD117+) from E17.5 mice to assess rearrangement of Vκ to each functional Jκ. Each lane represents threefold serial dilutions of input DNA. DNA levels were normalized to Aicda levels, which is located on the same chromosome as Igk. b Recombination with Jκ1 was quantified by qPCR using primers specific for the unrearranged germline sequence. DNA is quantified as a ratio between the single copy β-actin gene and the Igk germline PCR product and shown as a proportion of tail DNA. Schematics outline primer-binding sites on the Igk locus (bottom of a, b). Error bars represent the standard deviation (n = 4 biologically independent samples for tail and FL pro-B cells n = 5 biologically independent samples for BM pre-B (CD19+B220+IgMCD117+CD25+) and BM pro-B). P-values were calculated using two-tailed T tests. c 3-D immuno-DNA FISH was performed on ex vivo sorted B cells using BAC probes specific to the distal Vκ24 (RP23–101G13) gene region and the Cκ region (RP24–387E13), shown in red and green, respectively, in conjunction with an antibody to the phosphorylated form of γ-H2AX in white. Representative images of a B cell with no γ-H2AX associated with Igk alleles (top) and with γ-H2AX associated with one Igk allele (bottom). Scale bar = 1 μm. d Percentage of B cells (BM pro-B, BM pre-B, and FL pro-B) with at least one Igk allele associated with a γ-H2AX focus. Error bars represent standard deviation (n = 2 biologically independent samples). P-values were calculated using two-tailed Fisher’s exact tests. e STAT5-ChIP-qPCR of iEκ on ex vivo sorted cells. The data are represented as a proportion of input DNA, and error bars represent the standard deviation (n = 3 biologically independent samples). For all P-values, *significant (0.05–0.01), **very significant (0.01–0.001), ***highly significant (<0.001). For b, d, and e, source data are provided as Source Data File
Fig. 2
Fig. 2
The Igk locus is similarly contracted in FL pro-B cells and BM pre-B cells. a Representative confocal microscopy images showing the distance separation between the probes on Igk in fetal liver pro-B cells (LinCD19+B220+IgMCD2CD117+), bone marrow pre-B cells (CD19+B220+IgMCD117+CD25+), and double-positive T cells (CD90.2+TCRBCD4+CD8+). b Distances separating the two ends of the locus are displayed as a cumulative frequency curve. A left shift on the curve is indicative of closer association. Bone marrow pre-B cells (blue), fetal liver pro-B cells (green), and negative control double-positive T cells (black). P-values were generated using two-sample Kolmogorov–Smirnov tests (n = 2 independent experiments)
Fig. 3
Fig. 3
Early Igk rearrangement enables B cells to bypass the pre-BCR checkpoint. a Igk recombination can occur independent of Igh recombination as shown by semiquantitative PCR performed on ex vivo-derived fetal liver pro-B cells E17.5 (LinCD19+B220+IgMCD2CD117+) from wild-type and JHT mice. Each lane represents threefold serial dilutions of input DNA. DNA levels were normalized to iEκ b Representative flow-cytometry plots of fetal liver E17.5 cells from Igll1−/−, B1.8, and Igll1−/−;B1.8 littermates (from top to the bottom). Pro-B and pre-B cell gates are displayed as a percentage of CD19+IgM cells (left), IgM+ are displayed as a percentage of CD19+ cells (middle), and IgK+ histograms are displayed as a percentage of CD19+IgM+ cells (right)
Fig. 4
Fig. 4
B-1a cells are efficiently generated in surrogate light chain-deficient mice. a Representative flow-cytometry plots of peritoneal cavity cells from wild-type and Igll1−/− mice. B-2 and B-1 cell gates are displayed as a percentage of CD19+ cells (left). B-1a and B-1b cell gates are displayed as a percentage of B-1 cells (right). b The total cell numbers of B-2, B-1b, and B-1a cells were calculated from the peritoneal cavity of these mice. The middle line in the boxplots represents the median. The box shows first and third quartiles, and the whiskers represent the max and min values. Each dot represents cells from a different individual mouse. P-values were calculated using a two-tailed T test. Source data are provided as Source Data File. c Igll1−/− mice maintain both functionally distinct PC1lo and PC1hi subsets of B-1a cells. Representative flow-cytometry plots of peritoneal cavity cells from wild-type and Igll1−/− mice. B-2 and B-1 cell gates are displayed as a percentage of CD19+ cells (left). PC1lo and PC1hi B-1a cells are displayed as a percentage of B-1a cells (right). A PC1 FMO (fluorescence minus one) was used to define the gate
Fig. 5
Fig. 5
Transitional B-1a cells are readily detected in neonatal spleens from Igll1−/− mice. a Representative flow-cytometry plots showing transitional B-1a (CD19+CD93lo/intIgM+B220/loCD5+) and transitional B-2 (CD19+CD93lo/intIgM+CD5−/loB220+) from wild-type and Igll1−/−. The left plot is gated on CD19+ cells from D10–11 neonatal spleen. b Graphs represent the proportion of cells that are either transitional B-1a or transitional B-2. c Graphs show the total cell numbers of transitional B-2 or transitional B-1a in millions. For both b and c, the middle line in the boxplots represents the median. The box shows first and third quartiles, and the whiskers represent the max and min values. Each dot represents cells from a different individual mouse. Source data are provided as Source Data File
Fig. 6
Fig. 6
Constitutive phospho-STAT5 signaling selectively inhibits B-1a cell development. a Representative flow-cytometry plots of peritoneal cavity cells from wild-type and Stat5b-CA mice. B-2 (CD19+B220hi) and B-1 (CD19+B220lo) cell gates are displayed as a percentage of CD19+ cells (left). B-1a (CD19+B220loCD5+) and B-1b (CD19+B220loCD5) cell gates are displayed as a percentage of the B-1 cells (right). b Graphs display the total cell numbers of B-2, B-1b, and B-1a cells from the peritoneal cavity of wild-type and Stat5b-CA mice. Each dot represents an individual mouse, and lines connect pairs of littermates from three different litters of mice. c, d SLC-independent B-1a cells express receptors with phosphatidylcholine (PtC)-specific VH12 gene rearrangements. Peritoneal cavity B-1a cells from wild-type and Igll1−/− mice highlight the proportion of B-1a cells that are either c VH12+, PtC+ or d PtC+. The left side shows representative flow-cytometry plots. The right side is a graphical summary of the mice from all the experiments. Each dot represents an individual mouse and lines connect pairs of littermates. P-values were calculated using a two-tailed T -test. Source data are provided as Source Data File
Fig. 7
Fig. 7
Igll1−/− B-1a cells have a similar VH gene segment VH usage to wild-type controls. Representative synthesis graphs generated from IMGT/StatClonotype that compare differences in V gene segment usage between wild-type (blue) and Igll1−/− (red)-derived B-1a cells (CD19+B220loCD5+). The red box highlights VH12 (VH12-3) gene segment (n = 2 independent experiments). The graph combines a bar graph for the normalized proportions of each gene segment and the differences in proportions with significance and confidence intervals (CI)
Fig. 8
Fig. 8
Wild-type and Igll1−/− Igll1−/− B-1a cells have a similar VK gene segment usage to wild-type controls and maintain VK4-91 enrichment. Representative synthesis graphs generated from IMGT/StatClonotype that compare differences in Igk V gene segment usage between Igll1−/− (red) versus wild-type (blue) peritoneal cavity B-1a cells CD19+B220loCD5+ (left side) or Igll1−/− (red) peritoneal cavity B-1a cells vs wild-type (blue) peritoneal cavity B-2 cells CD19+B220+ (right side). The red box highlights VK4 (VK4-91) gene segment (n = 2 independent experiments). This graph combines a bar graph for the normalized proportions of each gene segment and the differences in proportions with significance and confidence intervals (CI)
Fig. 9
Fig. 9
Wild-type and Igll1−/− peritoneal cavity B-1a cells have similar low levels of N-additions as compared with wild-type counterparts. Cumulative frequency graph demonstrates the proportion of cells that have a certain number of N-additions between VH and VD gene segments for wild-type peritoneal cavity B-1a cells CD19+B220loCD5+ (blue), Igll1−/− peritoneal cavity B-1a CD19+B220loCD5+ cells (green), and wild-type bone marrow immature B cells CD19 + B220 + IgMint (black) (n = 2 independent experiments)
Fig. 10
Fig. 10
The model of classical versus alternate B-cell development. The classical B-cell developmental pathway is favored in the bone marrow where high levels of STAT5 signaling inhibit Igk recombination at the pro-B cell stage. At the large pre-B cell stage, a productive heavy-chain pairs with SLC and pre-BCR signaling at this stage leads to proliferative expansion and positive selection. Autoreactive heavy-chains pair poorly with SLC, and will not experience positive selection in this manner. Following Igk recombination (blue) at the small pre-B cell stage, self-reactive B cells can undergo receptor editing to further select against self-reactive BCRs. The alternate B-cell developmental pathway is favored in fetal liver where low levels of STAT5 signaling in pro-B cells promotes Igk recombination at the same stage as Igh recombination (blue). This enables the generation of B cells expressing a mature BCR instead of a pre-BCR. Here, self-reactive B cells are initially positively selected by self-antigens. Although these B cells can potentially undergo receptor editing to modify their BCRs, the initial positive selection of autoreactive B cells skews the B-1a BCR repertoire toward autoreactivity

References

    1. Morton LM, et al. Lymphoma incidence patterns by WHO subtype in the United States, 1992-2001. Blood. 2006;107:265–276. doi: 10.1182/blood-2005-06-2508. - DOI - PMC - PubMed
    1. Royston I, Majda JA, Baird SM, Meserve BL, Griffiths JC. Human T cell antigens defined by monoclonal antibodies: the 65,000-dalton antigen of T cells (T65) is also found on chronic lymphocytic leukemia cells bearing surface immunoglobulin. J. Immunol. 1980;125:725–731. - PubMed
    1. Wang C-Y, Good RA, Ammirati P, Dymbort G, Evans RL. Identification of a p69,71 complex expressed on human T cells sharing determinants with B-type chronic lymphatic leukemic cells. J. Exp. Med. 1980;151:1539–1544. doi: 10.1084/jem.151.6.1539. - DOI - PMC - PubMed
    1. Kantor A B, Herzenberg L A. Origin of Murine B Cell Lineages. Annual Review of Immunology. 1993;11(1):501–538. doi: 10.1146/annurev.iy.11.040193.002441. - DOI - PubMed
    1. Hayakawa K, Carmack CE, Shinton SA, Hardy RR. Selection of autoantibody specificities in the Ly-1 B subset. Ann. N. Y. Acad. Sci. 1992;651:346–353. doi: 10.1111/j.1749-6632.1992.tb24634.x. - DOI - PubMed

Publication types

MeSH terms

Substances