. 2019 Dec;101(6):1405-1415.
doi: 10.4269/ajtmh.19-0386.

The Economic Burden of Malaria: Revisiting the Evidence

Affiliations

The Economic Burden of Malaria: Revisiting the Evidence

Nayantara Sarma et al. Am J Trop Med Hyg. 2019 Dec.

Abstract

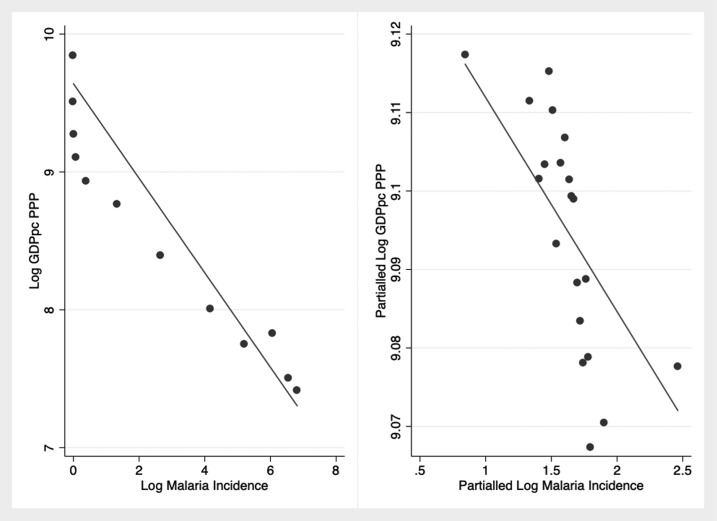
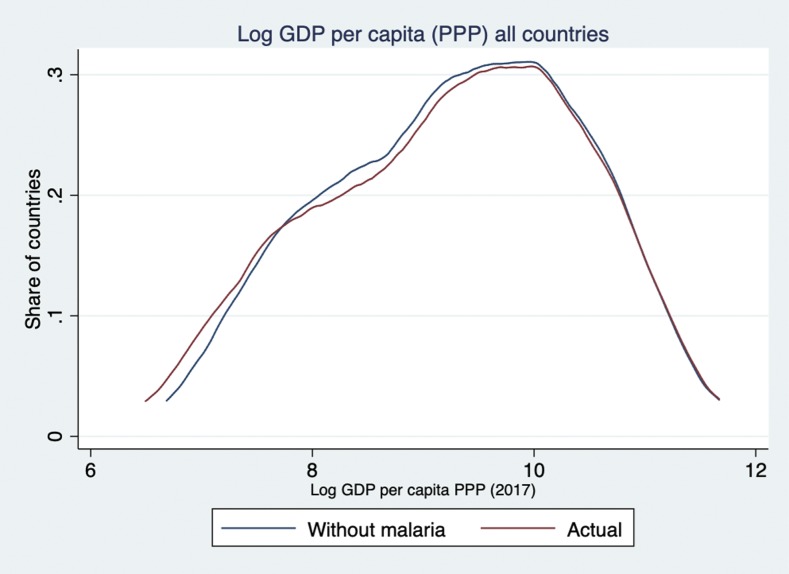
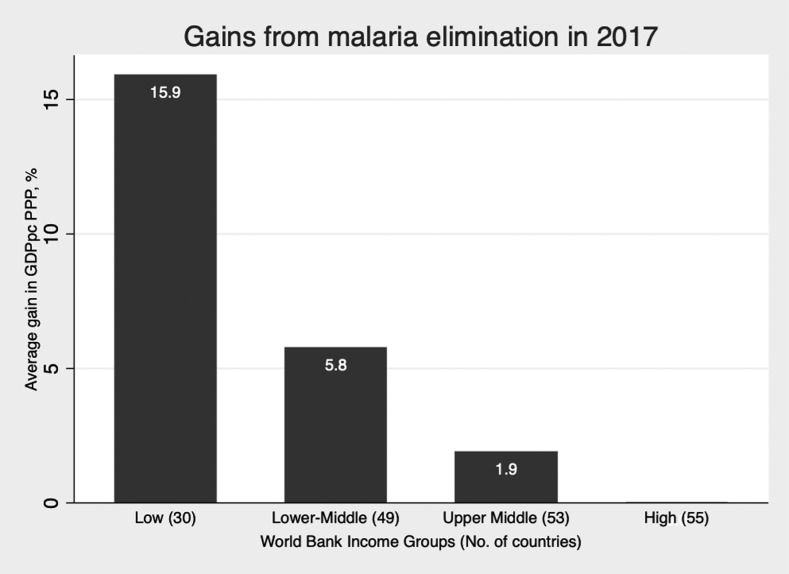
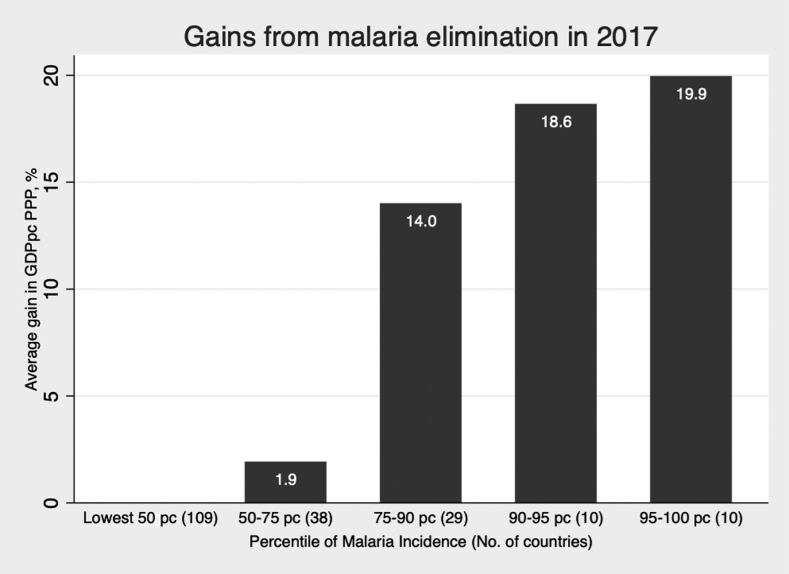
A portion of the economics literature has long debated about the relative importance of historical, institutional, geographical, and health determinants of economic growth. In 2001, Gallup and Sachs quantified the association between malaria and the level and growth of per capita income over the period 1965-1995 in a cross-country regression framework. We took a contemporary look at Gallup and Sachs' seminal work in the context of significant progress in malaria control achieved globally since 2000. Focusing on the period 2000-2017, we used the latest data available on malaria case incidence and other determinants of economic growth, as well as macro-econometric methods that are now the professional norm. In our preferred specification using a fixed-effects model, a 10% decrease in malaria incidence was associated with an increase in income per capita of nearly 0.3% on average and a 0.11 percentage point faster per capita growth per annum. Greater average income gains were expected among higher burden countries and those with lower income. Growth of industries with the same level of labor intensity was found to be significantly slower in countries with higher malaria incidence. To analyze the causal impact of malaria on economic outcomes, we used malaria treatment failure and pyrethroid-only insecticide resistance as exogeneous instruments in two-stage least squares estimations. Despite several methodological challenges, as expected in these types of analyses, our findings confirm the intrinsic link between malaria and economic growth and underscore the importance of malaria control in the agenda for sustainable development.


Figures

Figure 1.
Figure 1.
Association between malaria incidence and gross domestic product per capita (GDPpc) purchasing power parity (PPP) over the period 2000–2017. The figure on the left (N = 2,948) shows the simple binned correlation between GDPpc PPP and malaria case incidence. This relationship remains after both variables are purged of the effect of institutions, trade–GDP ratio, country, and time effects (right, N = 2,948). For visual clarity, the figures group observations into equally sized “bins” based on log malaria incidence and plot the mean log malaria incidence with the respective mean log GDPpc PPP.
Figure 2.
Figure 2.
The world distribution of log gross domestic product per capita (GDPpc) purchasing power parity (PPP): actual (gray) and as predicted with a 100% reduction in malaria incidence (black). Simulation based on column 4 of Table 4. The vertical y-axis displays the proportion of countries. The horizontal x-axis displays log GDPpc PPP in 2017. The gray and black curves are continuous functions used to display the distribution of log GDPpc PPP across countries in 2017. Reading from the left to right: the gray curve shows that at 2017 malaria transmission levels, countries in the lowest 10th percentile of income had a log GDPpc PPP of 7.53 or less, equivalent to GDPpc PPP of 1,863; the black curve shows that without malaria, countries in the lowest 10th percentile of income would have a log GDPpc of 7.66 or less, equivalent to GDPpc PPP of 2,122. This indicates a rightward shift in log GDPpc PPP on the x-axis. Similarly, at 2017 transmission levels, 16.3% of countries had a log GDPpc PPP of 8 or below, equivalent to GDPpc PPP of 2,981 (gray curve). Assuming no malaria transmission in 2017, only 15.3% of countries would have a log GDPpc PPP of 8 or less. The crossing of the black and gray curves on the left side of the graph indicates a shift in the country mass, as low GDPpc PPP countries move to the right because of the economic gains associated with no malaria transmission. Finally, as expected, there is no change in the right side of the distribution as high GDPpc PPP countries have low or no malaria transmission, and thus, a change in transmission will not be associated with any economic gains from malaria elimination, according to our empirical model.
Figure 3.
Figure 3.
Average gross domestic product per capita (GDPpc) purchasing power parity (PPP) gain (%), by the World Bank income group in 2017.
Figure 4.
Figure 4.
Average gross domestic product per capita (GDPpc) purchasing power parity (PPP) gain (%), by percentile of malaria incidence in 2017. Note: At the 50th percentile, that is, the median country has zero malaria incidence. Country at the 75th percentile has 6.5 cases per 1,000 population; at the 90th percentile, 194 cases per 1,000 population; and at the 95th percentile, 338 cases. Malaria incidence data are for the year 2017.

References

    1. Acemoglu D, Johnson S, 2007. Disease and development: the effect of life expectancy on economic growth. J Political Econ 115: 925–985.
    1. Bhargava A, Jamison DT, Lau LJ, Murray CJ, 2001. Modeling the effects of health on economic growth. J Health Econ 20: 423–440. - PubMed
    1. Bloom DE, Canning D, Sevilla J, 2004. The effect of health on economic growth: a production function approach. World Dev 32: 1–13.
    1. Hamoudi AA, Sachs JD, 1999. Economic Consequences of Health Status: A Review of the Evidence. Cambridge, MA: Center for International Development, Harvard University.
    1. Pritchett L, Summers LH, 1996. Wealthier is healthier. The Journal of Human Resources 31: 841–868.

Publication types