. 2019 Dec:170:113668.
doi: 10.1016/j.bcp.2019.113668. Epub 2019 Oct 16.

A luciferase lysis assay reveals in vivo malignant cell sensitization by phosphoantigen prodrugs

Affiliations

A luciferase lysis assay reveals in vivo malignant cell sensitization by phosphoantigen prodrugs

Jin Li et al. Biochem Pharmacol. 2019 Dec.

Abstract

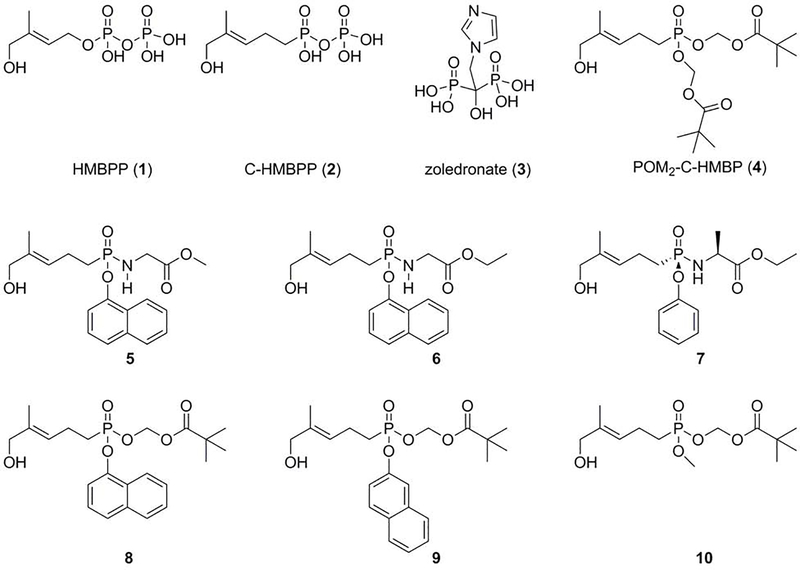
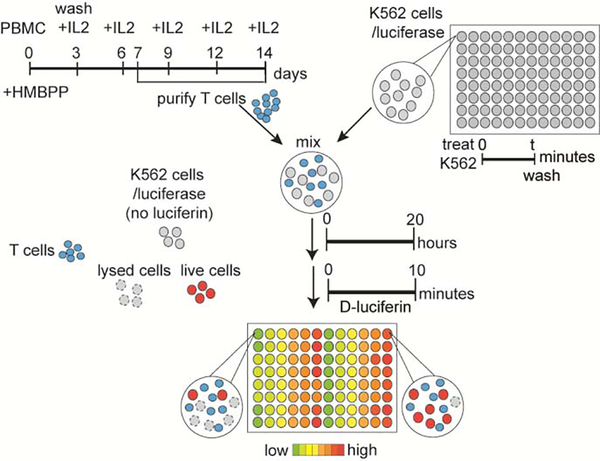
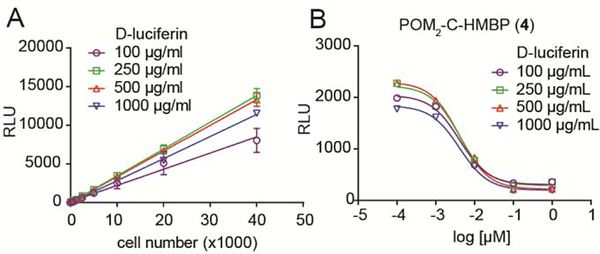
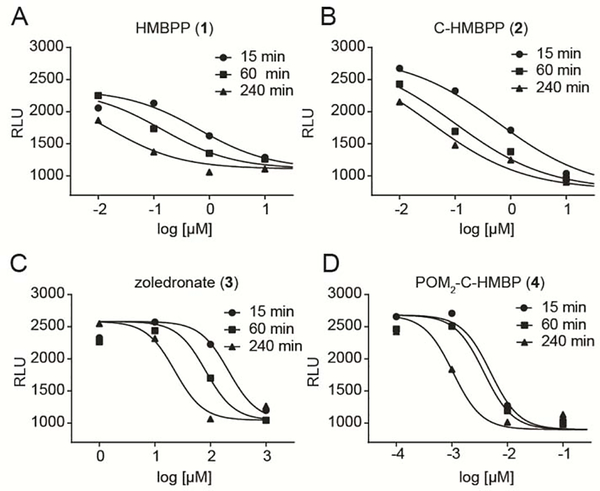
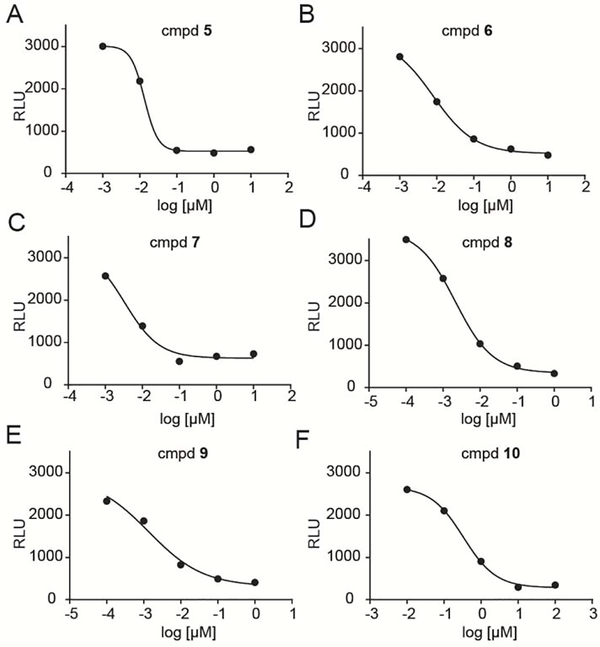
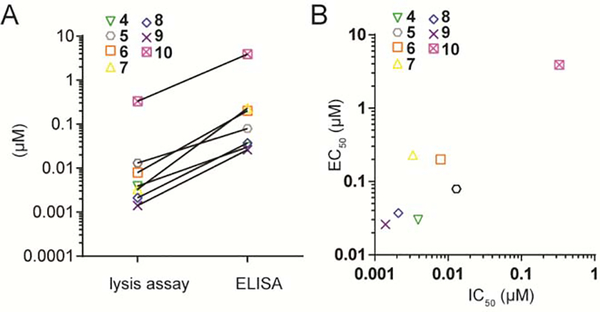
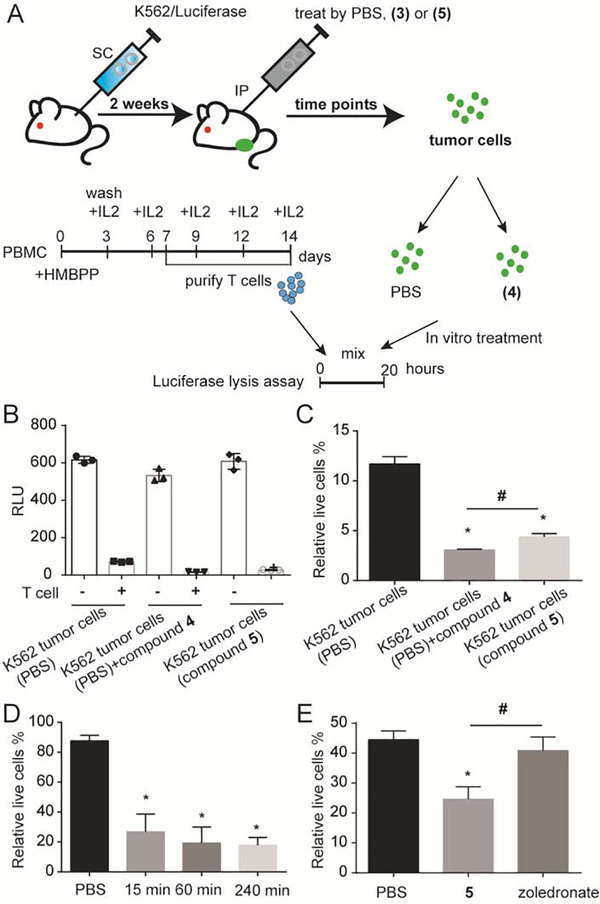
Human Vγ9Vδ2 T cells respond to small phosphorus-containing compounds, often called phosphoantigens, which are now known to be intracellular ligands of the immune receptor butyrophilin 3A1 (BTN3A1). In order to compare the efficiency of butyrophilin ligands, we developed a luciferase-based lysis assay that measures the direct cytolysis by Vγ9Vδ2 T cells of luciferase-expressing K562 leukemia cells sensitized by phosphoantigen prodrugs. Our results show that the luciferase-based lysis assay allows in vitro and in vivo assessment of phosphoantigen activity in a way that does not require the extensive processing of flow cytometry or ELISA based approaches. In cellular assays, the structure activity relationships of phosphoantigen prodrugs correlate with ELISA-based activation assays, though phosphoantigen induced target cell lysis occurs at lower concentrations relative to T cell interferon γ production measured by ELISA. In mice dosed with phosphoantigens, a racemic aryl phosphonamidate prodrug, methyl 2-[[[(E)-5-hydroxy-4-methyl-pent-3-enyl]-(1-naphthyloxy)phosphoryl]amino]acetate (1-Nap/GlyOMe C-HMBP, 5), sensitized subcutaneous K562 tumors within minutes, and this effect was maintained at least four hours after treatment. In vivo activity of compound 5 was stronger than that of an equivalent dose of zoledronate. This luciferase lysis assay can be used for evaluation of phosphoantigens due to its time efficiency, high sensitivity, and in vivo compatibility and demonstrates rapid in vitro and in vivo sensitization of tumor cells by phosphoantigen prodrugs.


Figures

Figure 1.
Figure 1.
Chemical structures of the compounds evaluated in this study.
Figure 2.
Figure 2.
Flow chart of the luciferase-based lysis assay. K562/luciferase cells were pre-loaded with test compounds, washed and mixed with purified effector Vγ9Vδ2 T cells for defined times to allow for cellular interactions and lysis. The cell-mediated lysis was measured by adding the cell-permeable D-luciferin and detection of luminescence using a plate reader.
Figure 3.
Figure 3.
Luciferase lysis assay optimization. A) Different numbers of K562/luciferase cells were mixed with different concentrations of cell-permeable D-luciferin. The live cell number is linearly proportionate to the luciferase signal. Data points represent the mean values and standard deviations of three independent experiments (n=3). B) 104 K562 cells were treated with indicated doses of compound 4 for 1 hour, washed, and then mixed with Vγ9Vδ2 T cells at an E:T = 3:1 for 20 hours. Different doses of cell-permeable D-luciferin were added to the cell mixtures after the incubation. Data points represent the mean values of three independent experiments (n=3). The RLU values for the 100, 250, 500, and 1000 μg/mL conditions for K562 cells alone were 3500, 3300, 3100, and 3100 and for the K562/T cell co-cultures were 1600, 1900, 2200, and 1800. Experiments were performed using cells from at least two different donors.
Figure 4.
Figure 4.
Dose- and time-dependent activation of Vγ9Vδ2 T cells by indicated compounds. K562 cell lysis by Vγ9Vδ2 T cells after K562 cell exposure to A) HMBPP, B) C-HMBPP, C) zoledronate, or D) POM2-C-HMBP for varied time points. The average RLU for each panel in the absence of test compound was 2100, 2700, 2100, and 2600 in panels A-D, respectively. Data points represent the mean values of three independent experiments (n=3).
Figure 5.
Figure 5.
Dose-dependent activation of Vγ9Vδ2 T cells by K562 cells exposed to A) compound 5, B) 6, C) 7, D) 8, E) 9, or F) 10 for 60 minutes. Data points represent the mean values of three independent experiments (n=3).
Figure 6.
Figure 6.
Comparison of the IC50 values from the luciferase-based lysis assay and EC50 values from the ELISA, both at the 1 hour time point. A) line graph, B) scatter plot.
Figure 7.
Figure 7.
In vivo phosphoantigen dosing and ex vivo K562 tumor lysis by Vγ9Vδ2 T cells. A) Mice bearing subcutaneous K562 tumors in the rear flank were treated with 10 mg/kg of the test compounds using IP injection. Mice were euthanized at different time points after injection to harvest and isolate tumor cells for incubation with Vγ9Vδ2 T cells. B) Lysis of the luciferase-positive tumor-derived K562 cells by Vγ9Vδ2 T cells. K562 tumor bearing mice were dosed with PBS or compound 5 for 1 hour. Tumors were extracted and dissociated into single cell suspensions. Some tumor cells from PBS-treated mice were also treated with compound 4 (1 μM) for 60 minutes in vitro as a positive control. Bars represent mean RLU values and the standard deviation from three mice (n=3). C) The data from the preceding panel is represented as a percentage of live cells under each condition in the presence of T cells. D) K562 tumor bearing mice were dosed with PBS or compound 5. After different time points, tumors were extracted then tumor lysis was analyzed using luciferase assay relative to controls incubated without any Vγ9Vδ2 T cell treatment. Bars represent mean values and the standard deviation from three mice (n=3). E) Subcutaneous K562 tumor bearing mice were treated with PBS, compound 5 or zoledronate. Mice were euthanized after 1 hour to harvest and isolate tumor cells for incubation with Vγ9Vδ2 T cells. Bars represent mean values and the standard deviation from three mice (n=3). Statistics were determined by ANOVA with Tukey’s post-hoc analysis and with p < 0.05. *indicates significant difference compared to the tumor cells from PBS-treated mice. #indicates significant difference compared to each other.

References

    1. Nielsen MM, Witherden DA, Havran WL, γδ T cells in homeostasis and host defence of epithelial barrier tissues, Nat. Rev. Immunol. 17 (12) (2017) 733–745. - PMC - PubMed
    1. Chien YH, Meyer C, Bonneville M, γδ T cells: first line of defense and beyond, Annu. Rev. Immunol. 32 (1) (2014) 121–55. - PubMed
    1. Vermijlen D, Gatti D, Kouzeli A, Rus T, Eberl M, γδ T cell responses: How many ligands will it take till we know?, Semin. Cell Dev. Biol. 84 (2018) 75–86. - PubMed
    1. Sicard H, Ingoure S, Luciani B, Serraz C, Fournie JJ, Bonneville M, et al., In vivo immunomanipulation of Vγ9Vδ2 T cells with a synthetic phosphoantigen in a preclinical nonhuman primate model, J. Immunol. 175 (8) (2005) 5471–80. - PubMed
    1. Tanaka Y, Morita CT, Tanaka Y, Nieves E, Brenner MB, Bloom BR, Natural and synthetic non-peptide antigens recognized by human γδ T cells, Nature 375 (6527) (1995) 155–8. - PubMed

Publication types