. 2020 Jan 10;38(2):258-270.
doi: 10.1016/j.vaccine.2019.10.020. Epub 2019 Oct 16.

Differential functional patterns of memory CD4+ and CD8+ T-cells from volunteers immunized with Ty21a typhoid vaccine observed using a recombinant Escherichia coli system expressing S. Typhi proteins

Affiliations

Differential functional patterns of memory CD4+ and CD8+ T-cells from volunteers immunized with Ty21a typhoid vaccine observed using a recombinant Escherichia coli system expressing S. Typhi proteins

Rosângela Salerno-Gonçalves et al. Vaccine. .

Abstract

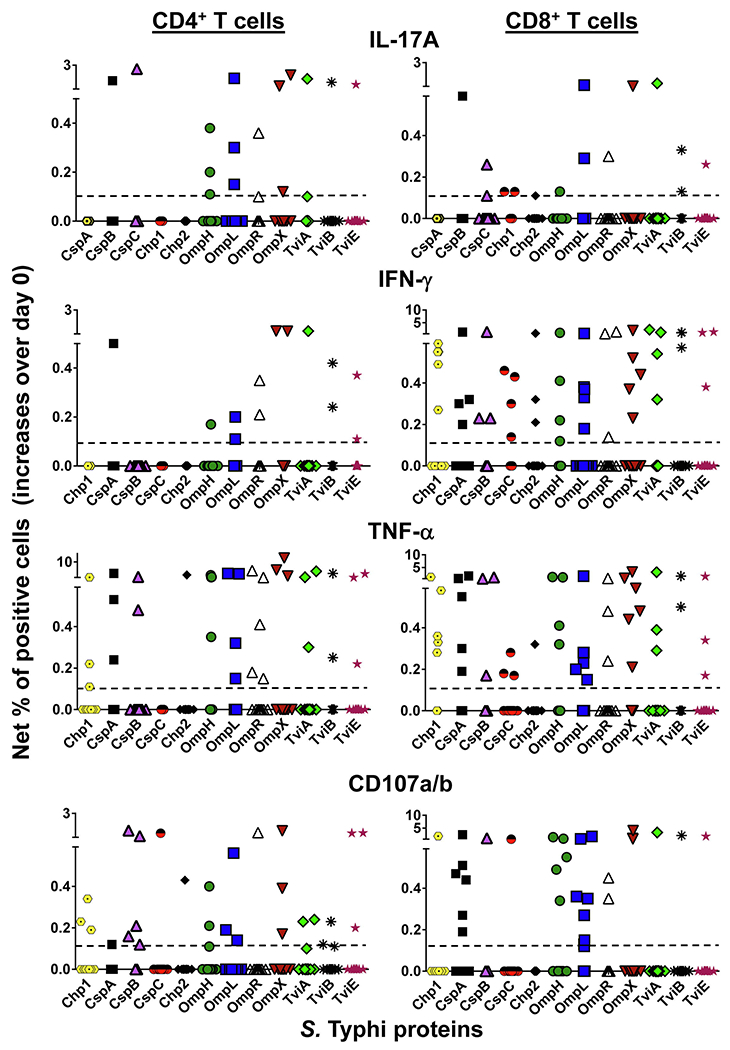
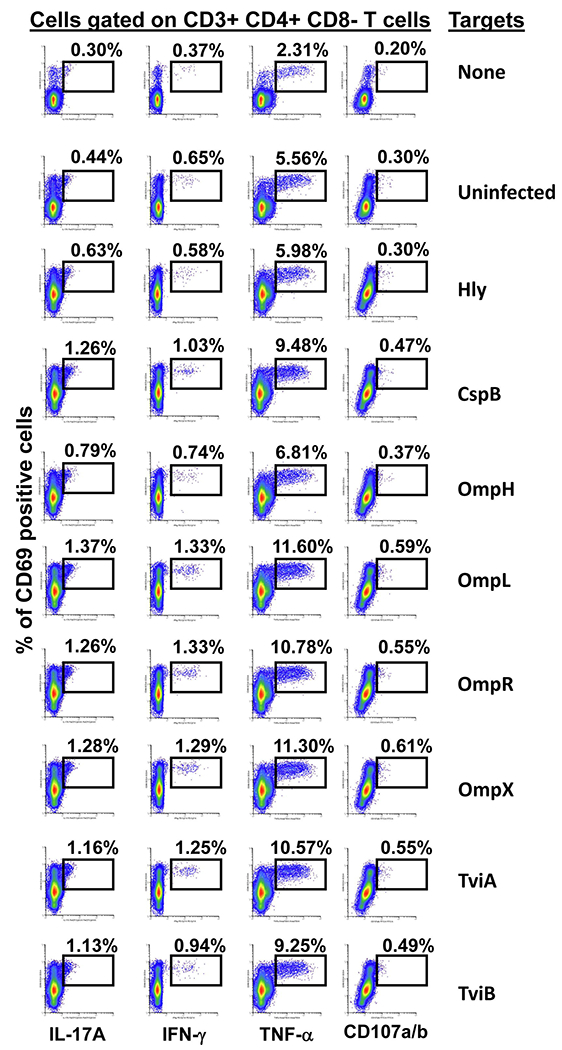
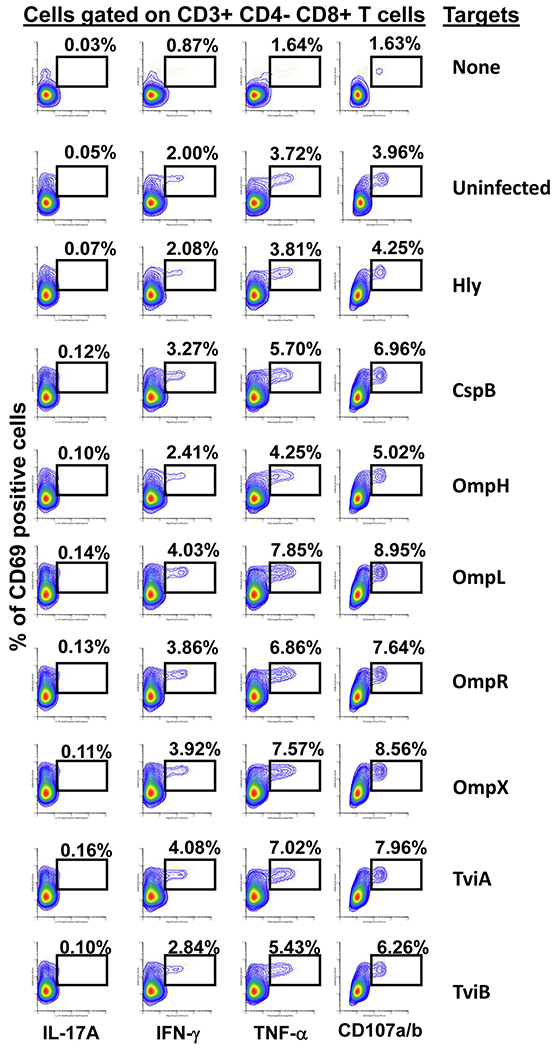
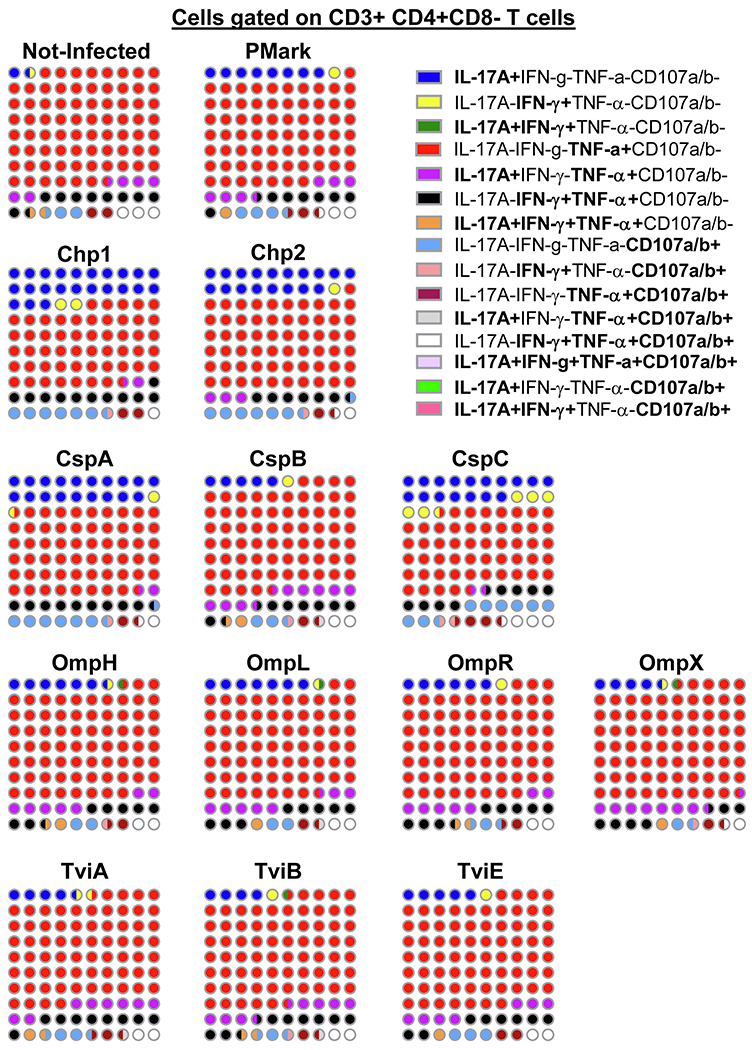
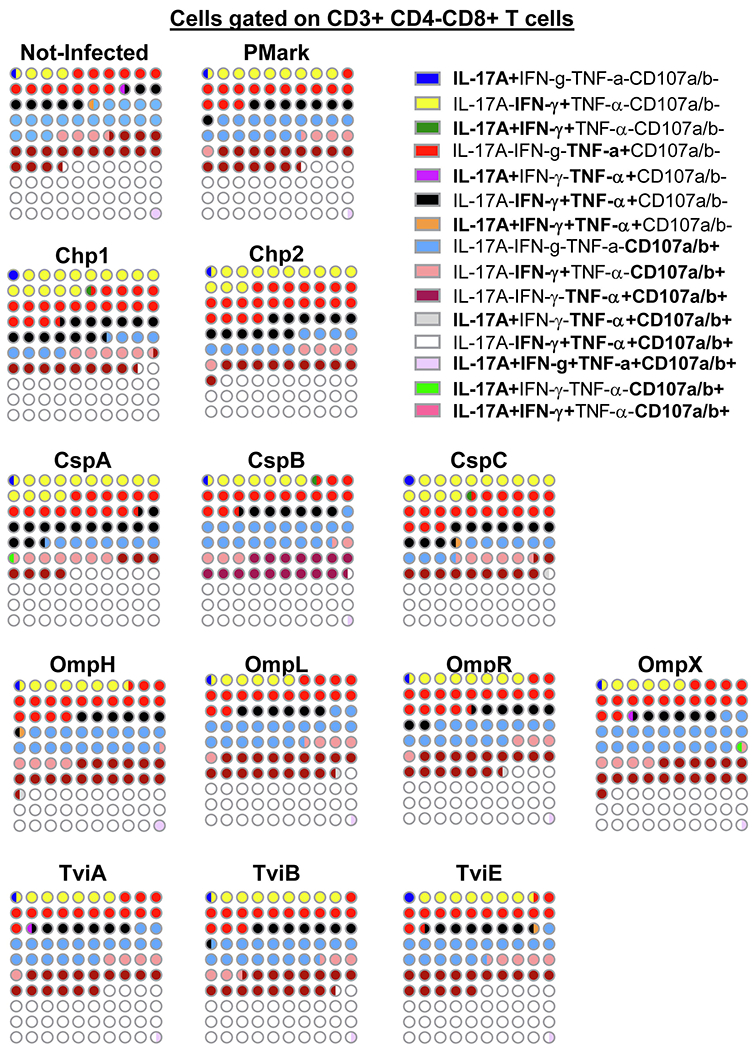
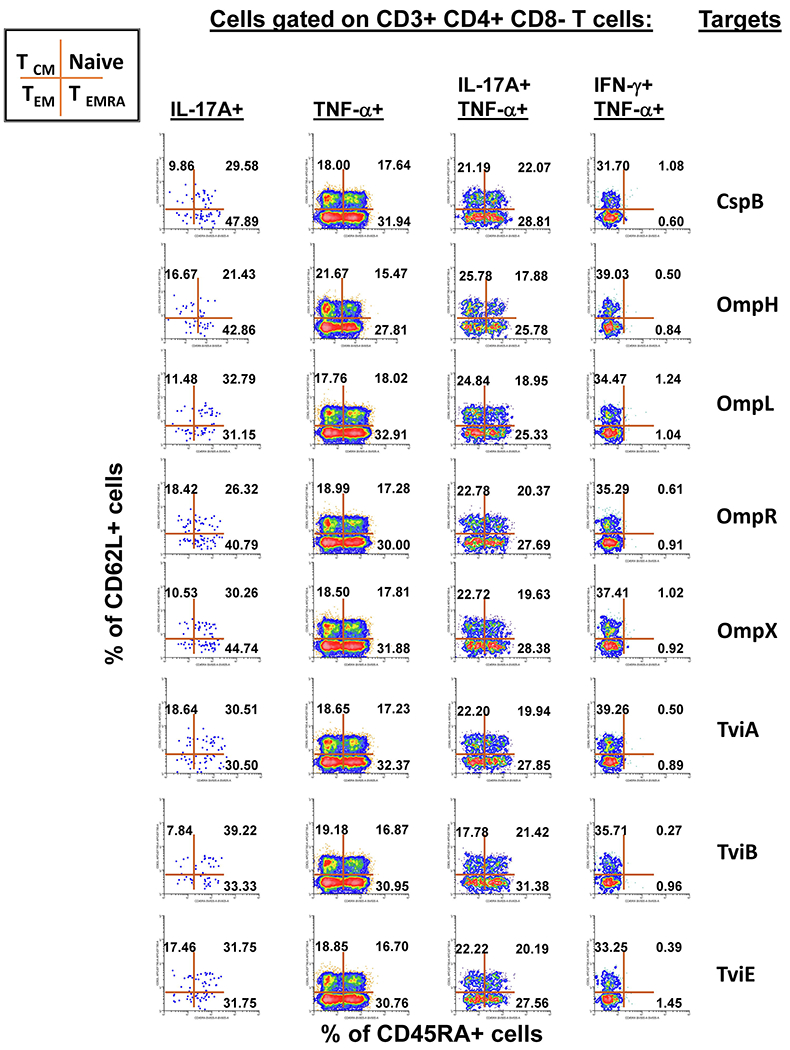
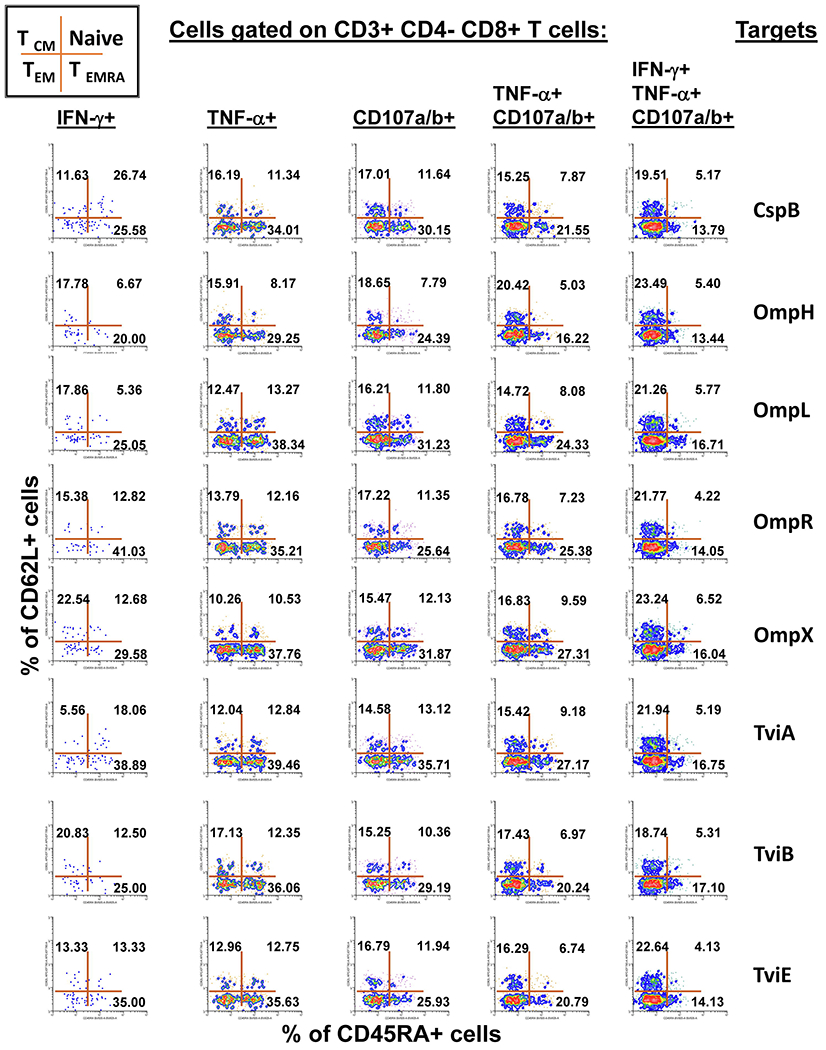
It is widely accepted that CD4+ and CD8+ T-cells play a significant role in protection against Salmonella enterica serovar Typhi (S. Typhi), the causative agent of the typhoid fever. However, the antigen specificity of these T-cells remains largely unknown. Previously, we demonstrated the feasibility of using a recombinant Escherichia coli (E. coli) expression system to uncover the antigen specificity of CD4+ and CD8+ T cells. Here, we expanded these studies to include the evaluation of 12 additional S. Typhi proteins: 4 outer membrane proteins (OmpH, OmpL, OmpR, OmpX), 3 Vi-polysaccharide biosynthesis proteins (TviA, TviB, TviE), 3 cold shock proteins (CspA, CspB, CspC), and 2 conserved hypothetical proteins (Chp 1 and Chp2), all selected based on the bioinformatic analyses of the content of putative T-cell epitopes. CD4+ and CD8+ T cells from 15 adult volunteers, obtained before and 42 days after immunization with oral live attenuated Ty21a vaccine, were assessed for their functionality (i.e., production of cytokines and cytotoxic expression markers in response to stimulation with selected antigens) as measured by flow cytometry. Although volunteers differed on their T-cell antigen specificity, we observed T-cell immune responses against all S. Typhi proteins evaluated. These responses included 9 proteins, OmpH, OmpR, TviA, TviE, CspA, CspB, CspC, Chp 1 and Chp 2, which have not been previously reported to elicit T-cell responses. Interestingly, we also observed that, regardless of the protein, the functional patterns of the memory T-cells were different between CD4+ and CD8+ T cells. In sum, these studies demonstrated the feasibility of using bioinformatic analysis and the E. coli expressing system described here to uncover novel immunogenic T-cell proteins that could serve as potential targets for the production of protein-based vaccines.

Keywords: Human; Recombinant E. coli; Salmonella; T-cells; Vaccine.


Conflict of interest statement

Conflict of interest

The authors declare no conflict of interest.

Declaration of interests

The authors declare that they have no known competing financial interests or personal relationships that could have appeared to influence the work reported in this paper.

Figures

Fig. 1.
Fig. 1.. Antigen Presentation of S. Typhi proteins by targets infected with recombinant E. coli.
Ex vivo PBMC from 15 volunteers collected before and 42 days after immunization were co-cultured for 16–18 hrs with autologous B-LCL targets infected at 1:30 MOI with recombinant E. coli expressing Hly only or co-expressing S. Typhi antigens: CspA, CspB, OmpH, OmpL, OmpR, OmpX, TviA, TviB, TviE, and two conserved hypothetical proteins (Chp 1 and Chp2). After incubation cells were stained, and the ability of PBMC to produce one or more cytokines (IL-17A, IFN-γ and TNF-α) and/or express CD107a/b molecules was analyzed by flow cytometry. Two T-cell subset responses (i.e., CD4+ and CD8+ T cells) were evaluated. Net responses were calculated by subtracting the T-cell responses to B-LCLs infected with recombinant E. coli expressing S. Typhi/Hly antigens from the responses of the controls (B-LCL expressing Hly only). Increases over day 0 were calculated by subtracting the net responses of the PBMC collected before immunization from the net responses of PBMC collected 42 days after immunization. The dashed line represents the threshold for a positive response. The data represent the CD4+ and CD8+ T-cell responses of all 15 volunteers. Each colored symbol represents a distinct S. Typhi protein.
Fig. 2.
Fig. 2.. CD4+ T-cell responses to S. Typhi proteins presented by targets infected with recombinant E. coli.
Ex vivo PBMC from a volunteer collected 42 days after immunization were co-cultured for 16-18 hrs with autologous B-LCL targets infected at a 1:30 MOI with one of the eight recombinant E. coli expressing S. Typhi/Hly (CspB, OmpH, OmpL, OmpR, OmpX, TviA and TviB) or only Hly (control) proteins. After incubation, cells were stained and the ability of the PBMC to produce one or more cytokines (IL-17A, IFN-γ and TNF-α) and/or express CD107a/b molecules was evaluated by flow cytometry. Shown are the CD4+ T-cell responses from a representative volunteer. Numbers represent the percentage of positive cells.
Fig. 3.
Fig. 3.. CD8+ T cell responses to S. Typhi proteins presented by targets infected with recombinant E. coli.
Ex vivo PBMC from a volunteer collected 42 days after immunization were co-cultured for 16–18 hrs with autologous B-LCL targets infected at a 1:30 MOI with one of the eight recombinant E. coli expressing S. Typhi/Hly (CspB, OmpH, OmpL, OmpR, OmpX, TviA and TviB) or only Hly (control) proteins. After incubation, cells were stained, and the ability of the PBMC to produce one or more cytokines (IL-17A, IFN-γ and TNF-α) and/or express CD107a/b molecules was evaluated by flow cytometry. Shown are the CD8+ T-cell responses from a representative volunteer. Numbers represent the percentage of positive cells.
Fig. 4.
Fig. 4.. Frequencies of mono and multifunctional CD4+ T-cells.
FCOM, an analysis tool contained in the WinList software package, was used to automatically reduce multiparameter data to a series of multiple event acquisition gates, one for each of the 15 possible sub-phenotypes of CD4+ T-cell multifunctionality. Lymphocytes were gated-out based on forward scatter height vs. forward scatter area. A “dump” channel was used to eliminate dead cells (Yevid+) as well as macrophages/monocytes (CD14+), B lymphocytes (CD19+) and targets (CD45+) from the analysis. This was followed by additional gating on CD3 and CD4 to identify single and multifunctional CD4+ T-cells. Combinations with frequency values that were zero were ignored. The data represents an average of 4 volunteers with sufficient number of positive events to allow for a detailed analysis of the T-memory subsets of the responding populations. Data presented as 10X10 matrixes in which each circle represents 1% of the population, color-coded as described in the legend. Bi-colored circles represent 0.5%.
Fig. 5.
Fig. 5.. The frequency of mono and multifunctional CD8+ cells.
FCOM, an analysis tool contained in the WinList software package, was used to automatically reduce multiparameter data to a series of multiple event acquisition gates, one for each of the 15 possible sub-phenotypes of CD8+ T-cell multifunctionality. Lymphocytes were gated-out based on forward scatter height vs. forward scatter area. A “dump” channel was used to eliminate dead cells (Yevid+) as well as macrophages/monocytes (CD14+), B lymphocytes (CD19+) and targets (CD45+) from the analysis. This was followed by additional gating on CD3 and CD8 to identify single and multifunctional CD8+ T-cells. Combinations with frequency values that were zero were ignored. The data represents an average of 4 volunteers with sufficient number of positive events to allow for a detailed analysis of the T-memory subsets of the responding populations. Data presented as 10X10 matrixes in which each circle represents 1% of the population, color-coded as described in the legend. Bi-colored circles represent 0.5%.
Fig. 6.
Fig. 6.. Memory status of the mono and multifunctional CD4+ T-cells.
Subsequent gates on the mono and multifunctional CD4+ T-cell subsets described in Fig. 4 were used to identify the memory status among each of the 15 defined sub-phenotypes of CD4+ cells. The data is representative of one experiment/one volunteer showing mono-functional or multi-functional CD4+ T-cell responses to eight recombinant E. coli expressing S. Typhi/Hly (CspB, OmpH, OmpL, OmpR, OmpX, TviA, TviB, and TviE) proteins at a multiplicity of infection (MOI) of 1:30. This figure illustrates a gating strategy in which CD4+ T-cells are further categorized based on the expression of CD45RA and CD62L markers. Cells in each resulting quadrant of the dot plot are then categorized in 4 subpopulations: central memory (CD45RACD62L+, TCM), naive (CD45RA+CD62L+, Naive), effector memory (CD45RACD62L, TEM), effector memory expressing CD45RA (CD45RA+CD62L, TEMRA). The 4 selected populations are those that were dominant in the volunteers who responded to stimulation with S. Typhi proteins, exhibiting sufficient number of positive events to allow downstream analyses. Numbers represent the percentage of positive cells in the respective quadrant.
Fig. 7.
Fig. 7.. Memory status of the mono and multifunctional CD8+ T-cells.
Subsequent gates on the mono and multifunctional CD8+ T-cell subsets described in Fig. 5 were used to identify the memory status among each of the 15 defined sub-phenotypes of CD8+ cells. The data is representative of one experiment/one volunteer showing mono-functional or multi-functional CD8+ T-cell responses to eight recombinant E. coli expressing S. Typhi/Hly (CspB, OmpH, OmpL, OmpR, OmpX, TviA, TviB and TviE) proteins at a multiplicity of infection (MOI) of 1:30. This figure illustrates a gating strategy in which CD8+ T-cells are further categorized based on the expression of CD45RA and CD62L markers. Cells in each resulting quadrant of the dot plot are then categorized in 4 subpopulations: central memory (CD45RACD62L+, TCM), naive (CD45RA+CD62L+, Naive), effector memory (CD45RACD62L, TEM), effector memory expressing CD45RA (CD45RA+CD62L, TEMRA). The 5 selected populations are those that were dominant in the volunteers who responded to stimulation with S. Typhi proteins, exhibiting sufficient number of positive events to allow downstream analyses. Numbers represent the percentage of positive cells in the respective quadrant.

References

    1. Salerno-Goncalves R, Sztein MB. Cell-mediated immunity and the challenges for vaccine development. Trends in microbiology. 2006;14:536–42. - PubMed
    1. Lundin BS, Johansson C, Svennerholm AM. Oral immunization with a Salmonella enterica serovar typhi vaccine induces specific circulating mucosa-homing CD4(+) and CD8(+) T cells in humans. Infect Immun. 2002;70:5622–7. - PMC - PubMed
    1. Sheikh A, Khanam F, Sayeed MA, Rahman T, Pacek M, Hu Y, et al. Interferon-gamma and proliferation responses to Salmonella enterica Serotype Typhi proteins in patients with S. Typhi Bacteremia in Dhaka, Bangladesh. PLoS neglected tropical diseases. 2011;5:e1193. - PMC - PubMed
    1. Sztein MB. Cell-mediated immunity and antibody responses elicited by attenuated Salmonella enterica Serovar Typhi strains used as live oral vaccines in humans. Clin Infect Dis. 2007;45 Suppl 1:S15–9. - PubMed
    1. Salerno-Goncalves R, Fernandez-Vina M, Lewinsohn DM, Sztein MB. Identification of a human HLA-E-restricted CD8+ T cell subset in volunteers immunized with Salmonella enterica serovar Typhi strain Ty21a typhoid vaccine. J Immunol. 2004;173:5852–62. - PubMed

Publication types

MeSH terms

Substances