. 2019 Dec:137:25-33.
doi: 10.1016/j.yjmcc.2019.09.011. Epub 2019 Oct 17.

Cardiomyocytes from CCND2-overexpressing human induced-pluripotent stem cells repopulate the myocardial scar in mice: A 6-month study

Affiliations

Cardiomyocytes from CCND2-overexpressing human induced-pluripotent stem cells repopulate the myocardial scar in mice: A 6-month study

Chengming Fan et al. J Mol Cell Cardiol. 2019 Dec.

Abstract

Background: Cardiomyocytes that have been differentiated from CCND2-overexpressing human induced-pluripotent stem cells (hiPSC-CCND2OE CMs) can proliferate when transplanted into mouse hearts after myocardial infarction (MI). However, it is unknown whether remuscularization can replace the thin LV scar and if the large muscle graft can electrophysiologically synchronize to the recipient myocardium. Our objectives are to evaluate the structural and functional potential of hiPSC-CCND2OE CMs in replacing the LV thin scar.

Methods: NOD/SCID mice were treated with hiPSC-CCND2OE CMs (i.e., the CCND2OE group), hiPSC-CCND2WT CMs (the CCND2WT group), or an equal volume of PBS immediately after experimentally-induced myocardial infarction. The treatments were administered to one site in the infarcted zone (IZ), two sites in the border zone (BZ), and a fourth group of animals underwent Sham surgery.

Results: Six months later, engrafted cells occupied >50% of the scarred region in CCND2OE animals, and exceeded the number of engrafted cells in CCND2WT animals by ~8-fold. Engrafted cells were also more common in the IZ than in the BZ for both cell-treatment groups. Measurements of cardiac function, infarct size, wall thickness, and cardiomyocyte hypertrophy were significantly improved in CCND2OE animals compared to animals from the CCND2WT or PBS-treatment groups. Measurements in the CCND2WT and PBS groups were similar, and markers for cell cycle activation and proliferation were significantly higher in hiPSC-CCND2OE CMs than in hiPSC-CCND2WT CMs. Optical mapping of action potential propagation indicated that the engrafted hiPSC-CCND2OE CMs were electrically coupled to each other and to the cells of the native myocardium. No evidence of tumor formation was observed in any animals.

Conclusions: Six months after the transplantation, CCND2-overexpressing hiPSC-CMs proliferated and replaced >50% of the myocardial scar tissue. The large graft hiPSC-CCND2OE CMs also electrically integrated with the host myocardium, which was accompanied by a significant improvement in LV function.

Keywords: Cell cycle; Heart failure; Induced pluripotent stem cells; Myocardial infarction.


Conflict of interest statement

Disclosures

The authors have declared that no conflict of interest exists.

Figures

Fig. 1.
Fig. 1.. Six months after MI induction, cardiac function significantly improved in CCND2OE animals than in CCND2WT animals.
MI was surgically induced in mice; then, animals in the CCND2OE group were treated with hiPSC-CCND2OE CMs, animals in the CCND2WT group were treated with hiPSC-CCND2WT CMs, and animals in the MI Only group were treated with an equal volume of PBS. Animals in the Sham group underwent all surgical procedures for MI induction except the ligation step and recovered without any experimental treatment. (A) Echocardiographic assessments of (B) left ventricular ejection fraction and (C) fractional shortening (C) were performed before surgery (Pre-S) and six months afterward (Post-S). *P<0.01 versus Sham, P<0.01 versus MI Only, P<0.05 versus CCND2WT.
Fig. 2.
Fig. 2.. Infarct sizes and ventricular wall thicknesses significantly improved in CCND2OE animals than in CCND2WT animals.
Animals in the Sham, MI Only, CCND2WT, and CCND2OE groups were sacrificed six months after MI induction or Sham surgery; then, left ventricles were harvested, sectioned, and stained with fast green to identify functional myocardium and with sirius red to identify scar tissue (n = 12 per experimental group, scale bar = 1 mm). (B) Infarct size, and (C) left-ventricular anterior wall thickness were quantified and expressed as a percentage. *P<0.01 versus Sham, P<0.01 versus MI, P<0.01 versus CCND2WT.
Fig. 3.
Fig. 3.. Engrafted cells were significantly more common in hearts treated with hiPSC-CCND2OE CMs than with hiPSC-CCND2WT CMs.
Six months after MI induction or Sham surgery, animals in the Sham, MI Only, CCND2WT, and CCND2OE groups were injected with luciferin, and (A) BLI images were collected 10 min later. (B) BLI signal intensity was compared to a standard curve determined from known quantities of hiPSC-CMs; then, (C) the number of engrafted cells was calculated and (D) presented as a percentage of the total number of cells administered. (E) Heart sections from mice that had been sacrificed 1 and 6 months after MI induction and treatment with hiPSC-CCND2OE CMs were stained for the presence of hcTnT. *P<0.01 vs Sham, P<0.01 vs MI, P<0.01 vs CCND2WT, §P<0.05 vs month 1, P<0.05 vs month 2, #P<0.05 vs month 3.
Fig. 4.
Fig. 4.. hiPSC-CCND2OE CMs replaced a substantial portion of the myocardial scar.
Tissues from the infarct zone (IZ) and the border zone (BZ) in CCND2WT and CCND2OE animals at month 6 after MI and treatment were (A) stained with wheat germ agglutinin (WGA), hcTnT- and HNA-specific antibodies, and DAPI (bar=20 μm). (B-D) Cells that co-expressed hcTnT and HNA were counted in 8 fields per section, 20 sections per mouse, 12 mice per group; then, (B) the number of engrafted (i.e., human-lineage) cells in both zones was determined and (C) expressed as a percentage of the total number of cells administered. (D) Data for the IZ and BZ were quantified separately. (E) The proportion of HNA-positive cells that also co-expressed hcTnT was determined at month 1 and month 6 after treatment, and expressed as a %. (F) Sections were stained with sirius red (scar) and fast green (functional myocardium), and then with antibodies against hcTnT (arrows) and non–species-specific cardiac troponin I (cTnI) to identify engrafted (hcTnT) and both engrafted and native (cTnI) cardiomyocytes; nuclei were counterstained with human nuclear antigen (HNA) and DAPI. (G) The proportion of the scarred region that was occupied by engrafted cardiomyocytes was calculated and expressed as a percentage. *P<0.01 vs CCND2WT, P<0.01 vs BZ in the same experimental group.
Fig. 5.
Fig. 5.. hiPSC-CCND2OE CMs continued to proliferate after transplantation and promoted the angiogenic response to MI.
(A) Sections from the hearts of CCND2OE and CCND2WT animals were obtained at month 6 after MI and stained for the expression of hcTNT (to identify engrafted hiPSC-CMs), for expression of the proliferation marker Ki67, and for the presence of the M-phase marker phosphorylated histone 3 (PH3); nuclei were identified via DAPI staining or the expression of Nkx2.5. Proliferation was quantified as the percentage of hcTnT-positive cells that also expressed (B) Ki67 and (C) PH3. (D) Sections from the infarct zone with engrafted CCND2OE and CCND2WT cells were stained for the expression of hcTnT and the endothelial marker isolectin B4 (IB4), nuclei were counterstained with human nuclear antigen (HNA) and DAPI, and (E) vessel density was quantified as the number of IB4-positive vascular structures per mm2. (F) Sections from the border zone were stained for the expression of α-sarcomeric actin (αSA) and IB4; nuclei were counterstained with DAPI, and (G) vessel density was quantified as the number of IB4-positive vascular structures per mm2. (H) Measurements in the remote zone (RZ) in the same sections were used as a positive control. *P<0.01 versus CCND2WT, P<0.01 versus MI.
Fig. 6.
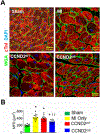
Fig. 6.. Engrafted hiPSC-CCND2OE CMs attenuated cardiomyocyte hypertrophy.
(A) Cardiomyocyte cross-sectional surface areas were measured in sections obtained at month 6 from the border-zone (BZ) of the infarct in MI, CCND2OE, and CCND2WT animals, and from the corresponding regions of hearts in Sham animals; sections were stained with wheat germ agglutinin (WGA) and cardiac troponin I (cTnI) to visualize cardiomyocytes, and nuclei were counterstained with DAPI. (B)The minimal diameters of cardiomyocyte fibers (MFD) were quantified. *P<0.01 versus Sham, P<0.05 versus MI, P<0.05 versus CCND2WT.
Fig. 7.
Fig. 7.. Engrafted hiPSC-CCND2OE CMs were electrically integrated with the native myocardium.
Heart sections were obtained at month 6 from CCND2OE animals and stained for the expression of hcTNT, cTnI, and/or HNA, and for the presence of (A) the adherens-junction protein N-Cadherin (N-Cad) or (B) the gap-junction protein Connexin 43 (Cx43); nuclei were counterstained with DAPI. Boxed regions display native cardiomyocytes (CMs) in the non-infarcted region (top rows), native CMs and hiPSC-CCND2OE CMs near the border zone (middle rows) and engrafted hiPSC-CCND2OE CMs in the infarcted zone (bottom rows). (C) The hearts of the animals were harvested immediately after sacrifice at month 6, Langendorff-perfused, stained with voltage-sensitive dye RH-237, and electrically paced via a bipolar electrode. (D) Optical action potentials were recorded over the boxed region of the left ventricle shown in panel C with a 16×16 photodiode array during pacing at a cycle length of 70 ms. The site of coronary-artery ligation is visible as a dark mark on the surface of the heart and as the shaded region in the AP map. (E) Heat map shows spatial distribution of action potential duration (APD50) over the heart surface. (F) Selected traces of action potentials displayed in blue in panel D (numbered from the upper right to the lower left) are shown. Closed red and green dots indicate the beginning and end-points, respectively, used for APD50 calculation. Open red circles depict upstrokes of short action potentials overlaying long action potentials of the engrafted hiPSC-CCND2OE cells. (G) Action potential propagation (arrows) is illustrated for two consecutive beats that include (beat 1) or do not include (beat 2) the upstrokes of abnormally long action potentials present in engrafted hiPSC-CCND2OE CMs.

References

    1. Oikonomopoulos A, Kitani T, Wu JC, Pluripotent Stem Cell-Derived Cardiomyocytes as a Platform for Cell Therapy Applications: Progress and Hurdles for Clinical Translation, Mol. Ther. 26 (2018) 1624–1634. - PMC - PubMed
    1. Laflamme MA, Murry CE, Heart regeneration, Nature. 473 (2011) 326–335. - PMC - PubMed
    1. Karantalis V, Suncion-Loescher VY, Bagno L, Golpanian S, Wolf A, Sanina C, et al., Synergistic Effects of Combined Cell Therapy for Chronic Ischemic Cardiomyopathy, J. Am. Coll. Cardiol. 66 (2015) 1990–1999. - PMC - PubMed
    1. Kochegarov A, Lemanski LF, New Trends in Heart Regeneration: A Review, J. Stem. Cells. Regen. Med. 12 (2016) 61–68. - PMC - PubMed
    1. van Laake LW, Passier R, Monshouwer-Kloots J, Verkleij AJ, Lips DJ, Freund C, et al., Human embryonic stem cell-derived cardiomyocytes survive and mature in the mouse heart and transiently improve function after myocardial infarction, Stem. Cell. Res. 1 (2007) 9–24. - PubMed

Publication types

MeSH terms