. 2020 Mar;145(3):947-957.
doi: 10.1016/j.jaci.2019.10.005. Epub 2019 Oct 17.

Identifying regulatory pathways of spleen tyrosine kinase expression in human basophils

Affiliations

Identifying regulatory pathways of spleen tyrosine kinase expression in human basophils

Xia Peng et al. J Allergy Clin Immunol. 2020 Mar.

Abstract

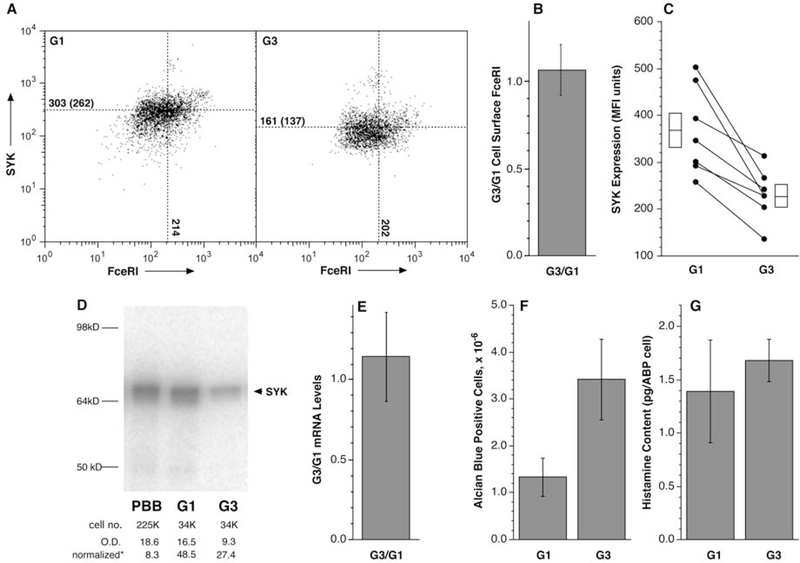
Background: Expression levels of spleen tyrosine kinase (SYK), a critical signaling tyrosine kinase in basophils, are uniquely low relative to all other circulating leukocytes, and levels are highly variable in the population.

Objective: We sought to determine whether transcriptional regulation of SYK through unique silencing of the SYK gene determines its basophil-specific expression patterns.

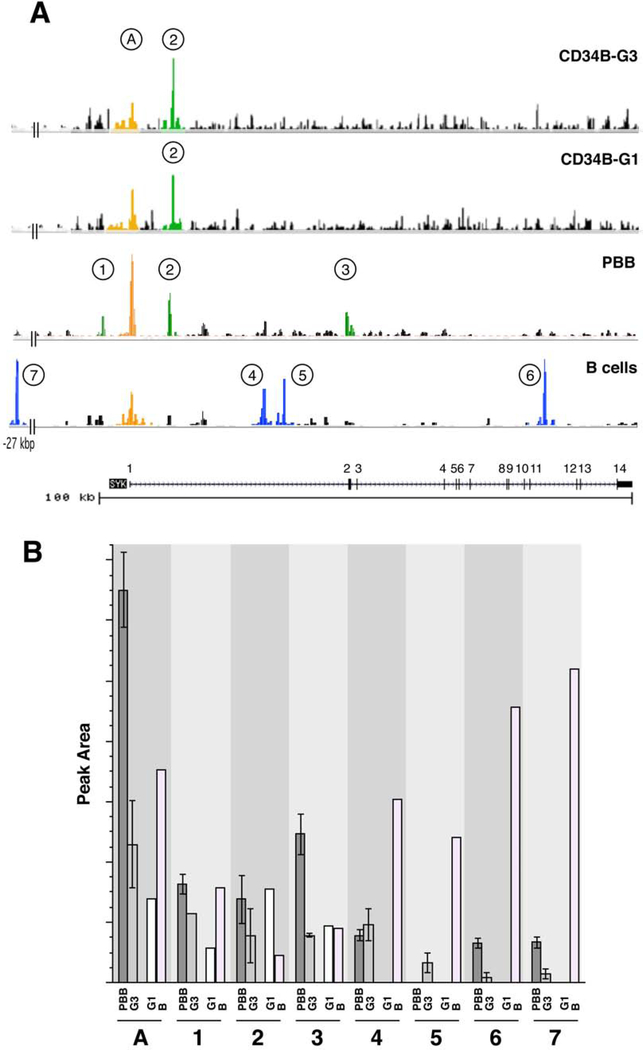
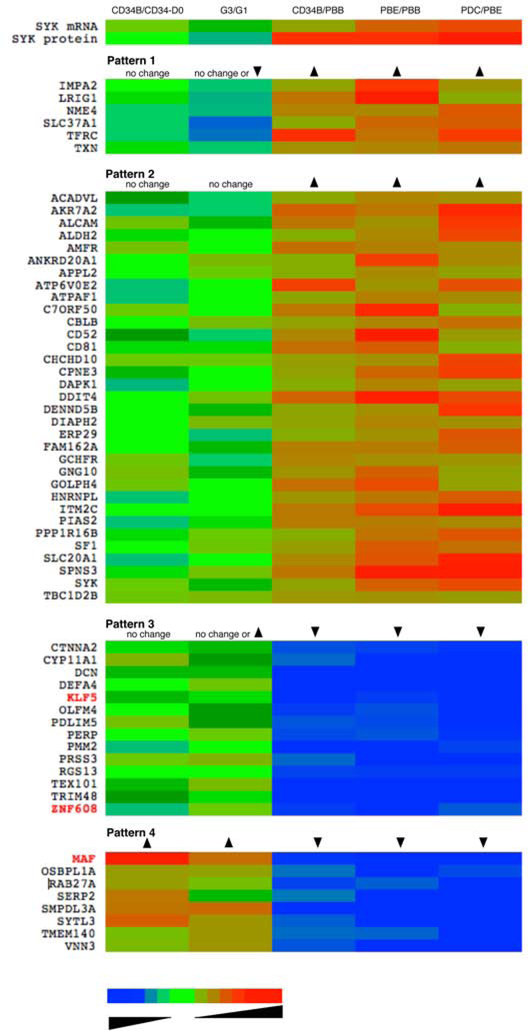
Methods: Culture-derived basophils (CD34B cells) were derived from cultures of CD34+ progenitor cells by using 2 methods (G1 or G3). Peripheral blood basophils (PBBs; relative SYK protein level = 1), B cells (SYK = 8), CD34B-G1 cells (SYK = 11), and CD34B-G3 cells (SYK = 5) were examined by using assay for transposase-accessible chromatin sequencing (ATAC-seq) methods. In addition, the transcriptomes of 6 cell types, PBBs, peripheral blood eosinophils (SYK = 11), plasmacytoid dendritic cells (SYK = 30), CD34+ progenitors (SYK = 11), CD34B-G1 cells, and CD34B-G3 cells, were analyzed for patterns that matched patterns of SYK expression in these cells, with a focus on transcription factors.

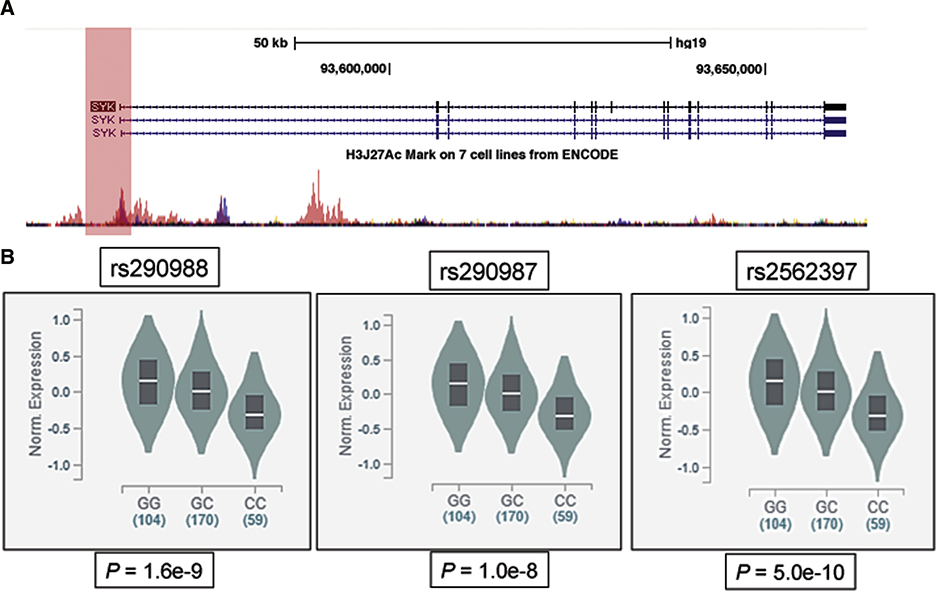
Results: ATAC-seq showed that PBBs have multiple open regions in the SYK gene, suggesting a nonsilenced state with 1 region unique to PBBs (low SYK expression), 1 region unique to both PBBs (low SYK expression) and both G1 and G3 CD34B cells (high and moderate SYK expression, respectively), and 5 regions unique to B cells (high SYK expression). SYK expression across the 6 cell types explored showed a unique pattern that was matched to expression patterns of 3 transcription factors: Kruppel-like factor 5 (KLF5), zinc-finger protein 608 (ZNF608), and musculoaponeurotic fibrosarcoma protein (c-MAF).

Conclusions: Two new potential regulatory pathways for SYK expression were identified. One appears independent of transcriptional regulation, and one appears to be dependent on transcriptional control in the SYK gene.

Keywords: Human; allergy; basophil; development; signal transduction.


Conflict of interest statement

COI: All authors have no conflicts of interest relevant to this manuscript to report.

Figures

Figure 1:
Figure 1:
Primary characteristics of G1 and G3 cultures. Using the methodologies described in the text and similar to Figure E4, G1 and G3 CD34B were generated and analyzed for various metrics of the basophil phenotype. Panel A: an example of SYK and FceRI expression for the G1 and G3 cultures as determined by flow cytometry (the gating for these plots was the exclusion of “debris” or dead cells using forward and side scatter followed by gating for CD123+ cells which represented ≈80% of the live cells). Panel B: relative FceRI expression for the G1 & G3 comparison. Panel C: compilation of SYK expression studies as assessed by flow cytometry. Panel D: example Western blots comparing CD34B G1 and G3 cell preparations compared to a PBB standard. The number of cells represented in the lysate run in the gel is noted as cell number (cell no.). Below this line is the optical density (O.D.) for the bands and the normalized OD per 100,000 cells. As found previously, SYK expression in the CD34B was significantly greater than PBB (≈6-fold in this instance). Panel E: rato of SYK mRNA expression for G1/G3 cells (see online repository Table E4 for details). Panel F: the total number of alcian-blue positive (ABP) cells. Panel G: histamine content per ABP cell counted.
Figure 2:
Figure 2:
ATACseq information for the SYK gene. Panel A: Four cell types, B cells, peripheral blood basophils (PBB), CD34B culture derived basophils using the G1 and G3 protocols, were analyzed by ATACseq and the data for the SYK gene (shown at the bottom of the figure, both exons (black regions) and introns (line with arrows indicating the direction of transcription), with numbered exons) collated using the UCSC browser. Eight peaks (identified by MACS2/HOMER annotation of the peak calls) are labeled: ‘A’ is the peak associated with the generally identified TSS for SYK and ‘1’ through ‘7’ peaks 5’ and throughout the gene. The bottom-most trace is the hypersensitivity profile identified in Genebank. Panel B: Summary of the ATAC results for the 8 identified peaks in the SYK gene. The ATACseq results were averaged for preparations that were of high quality; PBB (n=3), CB34B-G3 (n=2), CD34B-G1 (n=1), and B-cells (n=1). See online repository for methodological details.
Figure 3:
Figure 3:
ENCODE regulation tracks on the SYK gene region (chromosome 9: 90,795,787–90,898,549) and eQTL analysis for SYK promoter single nucleotide variants. Panel A illustrates the SYK gene structure, position of 3 variants (rs290988 (−1.1kb), rs290987 (−771bp) and rs2562397 (−76bp), in complete linkage disequilibrium (LD), (positions relative to transcription start site, TSS) within 1.1kb upstream of SYK (depicted by the User Track), and regulatory regions with ENCODE regulation tracks, including UCSC Gene (SYK), layered H3K27Ac and DNase Clusters. Panel B demonstrates significant SNP-gene eQTL association in tissues for these SYK promoter variants (with the CC homozygote showing lower SYK expression).
Figure 4:
Figure 4:
Pattern matching SYK expression with transcript behavior across different cell types, displayed as a heat-map (see the online repository for a tabulated presentation of the same data, Table E3. Using microarray results for 5 types of cells [peripheral blood basophils (PBB), peripheral blood eosinophils (PBE), peripheral blood plasmacytoid dendritic cells (PDC), CD34-derived basophils (CD34B) developed with the G1 or G3 protocols] transcripts were analyzed for following 4 patterns of expression. The short gene name is shown to the left of the heat-map and columns in the heat-map are colored for the ratio of the presence of the transcripts for the comparison shown at the top of the column. The arrows in the patterns indicate whether the ratio for a particular comparison is greater than 1.0, less than 1.0 or relatively unchanged. The colors represent the log-fold-change of the transcript for the particular comparison, ranging from 0.01 to 100, blue to red with shaded green representing changes near 1.0-fold (where unchanged refers to ratios between 0.75- and 1.33-fold).
Figure 5:
Figure 5:
Synopsis of the possible mechanisms of regulating SYK expression in basophils. There are four proposed mechanisms based on available information for regulation of SYK expression.

References

    1. Vilarino N, MacGlashan D Jr. Transient transfection of human peripheral blood basophils. J Immunol Methods 2005; 296:11–8. - PubMed
    1. MacGlashan DW Jr., Undem BJ. Inducing an Anergic State in Mast Cells and Basophils without Secretion. J. Allergy Clin. Immunol 2008; 121:1500–6. - PubMed
    1. Havard S, Scola AM, Kay LJ, Ishmael SS, Macglashan DW Jr., Peachell PT. Characterization of syk expression in human lung mast cells: relationship with function. Clin Exp Allergy 2011; 41:378–88. - PubMed
    1. Ishmael SS, MacGlashan DW Jr. Syk expression in peripheral blood leukocytes, CD34+ progenitors, and CD34-derived basophils. J Leukoc Biol 2010; 87:291–300. - PMC - PubMed
    1. MacGlashan DW Jr. Relationship Between Syk and SHIP Expression and Secretion from Human Basophils in the General Population. J. Allergy Clin. Immunol 2007; 119:626–33. - PubMed

Publication types