. 2019 Dec 9;374(1787):20190024.
doi: 10.1098/rstb.2019.0024. Epub 2019 Oct 21.

Autistic traits in synaesthesia: atypical sensory sensitivity and enhanced perception of details

Affiliations

Autistic traits in synaesthesia: atypical sensory sensitivity and enhanced perception of details

Tessa M van Leeuwen et al. Philos Trans R Soc Lond B Biol Sci. .

Abstract

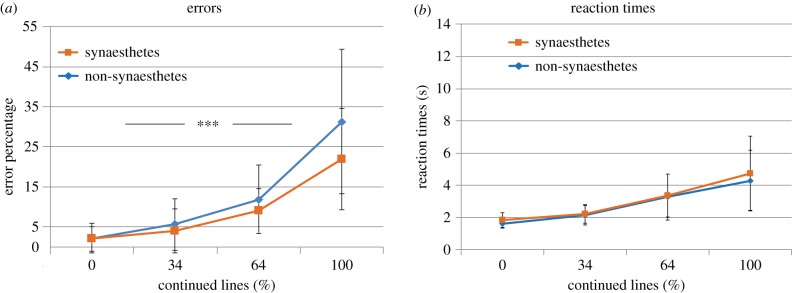
In synaesthetes, specific sensory stimuli (e.g. black letters) elicit additional experiences (e.g. colour). Synaesthesia is highly prevalent among individuals with autism spectrum disorder (ASD), but the mechanisms of this co-occurrence are not clear. We hypothesized autism and synaesthesia share atypical sensory sensitivity and perception. We assessed autistic traits, sensory sensitivity and visual perception in two synaesthete populations. In Study 1, synaesthetes (N = 79, of different types) scored higher than non-synaesthetes (N = 76) on the Attention-to-detail and Social skills subscales of the autism spectrum quotient indexing autistic traits, and on the Glasgow Sensory Questionnaire indexing sensory hypersensitivity and hyposensitivity which frequently occur in autism. Synaesthetes performed two local/global visual tasks because individuals with autism typically show a bias towards detail processing. In synaesthetes, elevated motion coherence thresholds (MCTs) suggested reduced global motion perception, and higher accuracy on an embedded figures task suggested enhanced local perception. In Study 2, sequence-space synaesthetes (N = 18) completed the same tasks. Questionnaire and embedded figures results qualitatively resembled Study 1 results, but no significant group differences with non-synaesthetes (N = 20) were obtained. Unexpectedly, sequence-space synaesthetes had reduced MCTs. Altogether, our studies suggest atypical sensory sensitivity and a bias towards detail processing are shared features of synaesthesia and ASD. This article is part of the discussion meeting issue 'Bridging senses: novel insights from synaesthesia'.

Keywords: autism; local/global; sensory sensitivity; synaesthesia; synesthesia; visual perception.


Conflict of interest statement

We declare we have no competing interests.

Figures

Figure 1.
Figure 1.
Average Autism Quotient subscores for synaesthetes (N = 79) and non-synaesthetes (N = 76). **p < 0.01, *p < 0.05. Detail, AQ-Attention-to-detail; Social, AQ-Social skills; Attention, AQ-Attention switching; Comm., AQ-Communication; Fantasy, AQ-Fantasy. Error bars denote the standard deviation. (Online version in colour.)
Figure 2.
Figure 2.
Average Glasgow Sensory Questionnaire subscores for synaesthetes (N = 74) and non-synaesthetes (N = 62). Vis, visual; Aud, auditory; Gus, gustatory; Olf, olfactory; Tac, tactile; Ves, vestibular; Prop, proprioceptive. Error bars denote the standard deviation. (Online version in colour.)
Figure 3.
Figure 3.
MCTs for synaesthetes (N = 49) and non-synaesthetes (N = 50). **p < 0.01. Error bars denote the standard deviation. Individual participants' thresholds are indicated by diamonds (synaesthetes) and triangles (non-synaesthetes). (Online version in colour.)
Figure 4.
Figure 4.
(a) Embedded figures task error rates and (b) reaction times for synaesthetes (N = 44) and non-synaesthetes (N = 64). ***p < 0.001, **p < 0.01 and *p < 0.05. Error bars denote the standard deviation. The x-axis denotes increasing levels of difficulty. (Online version in colour.)
Figure 5.
Figure 5.
Motion coherence thresholds for sequence-space synaesthetes (N = 18) and non-synaesthetes (N = 19). *p < 0.05. Error bars denote the standard deviation. Individual participants’ thresholds are indicated by diamonds (synaesthetes) and triangles (non-synaesthetes). (Online version in colour.)
Figure 6.
Figure 6.
(a) Embedded figures task error rates and (b) reaction times for sequence-space synaesthetes (N = 16) and non-synaesthetes (N = 18). Error bars denote the standard deviation. The x-axis denotes increasing levels of task difficulty. (Online version in colour.)

References

    1. Simner J, Mulvenna C, Sagiv N, Tsakanikos E, Witherby SA, Fraser C, Scott K, Ward J. 2006. Synaesthesia: the prevalence of atypical cross-modal experiences. Perception 35, 1024–1033. (10.1068/p5469) - DOI - PubMed
    1. Neufeld J, Roy M, Zapf A, Sinke C, Emrich HM, Prox-Vagedes V, Dillo W, Zedler M. 2013. Is synaesthesia more common in patients with Asperger syndrome? Front. Hum. Neurosci. 7, 847 (10.3389/fnhum.2013.00847) - DOI - PMC - PubMed
    1. Baron-Cohen S, Johnson D, Asher J, Wheelwright S, Fisher S, Gregersen P, Allison C. 2013. Is synaesthesia more common in autism? Mol. Autism. 4, 40 (10.1186/2040-2392-4-40) - DOI - PMC - PubMed
    1. Fombonne E. 2002. Epidemiological trends in rates of autism. Mol. Psychiatr. 7, S4–S6. (10.1038/sj.mp.4001162) - DOI - PubMed
    1. American Psychiatric Association. 2013. Diagnostic and statistical manual of mental disorders, 5th edn Arlington, VA: American Psychiatric Publishing.

Publication types