

AdipoRon Attenuates Wnt Signaling by Reducing Cholesterol-Dependent Plasma Membrane Rigidity
- PMID: 31630812
- PMCID: PMC7036725
- DOI: 10.1016/j.bpj.2019.09.009
AdipoRon Attenuates Wnt Signaling by Reducing Cholesterol-Dependent Plasma Membrane Rigidity
Abstract
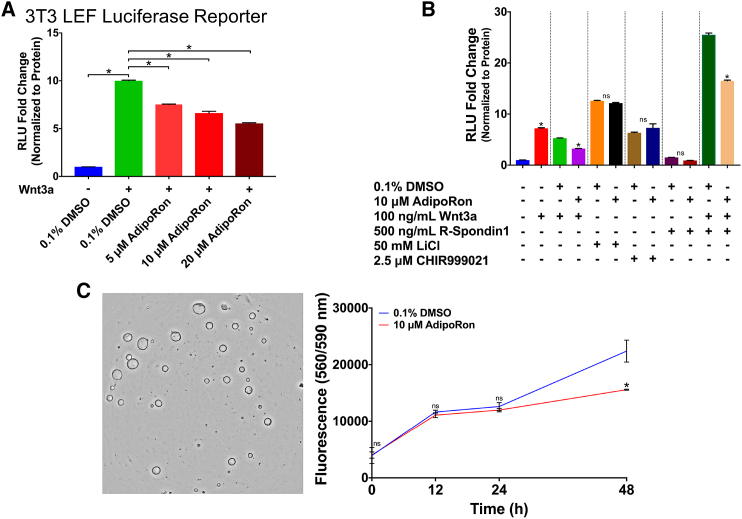
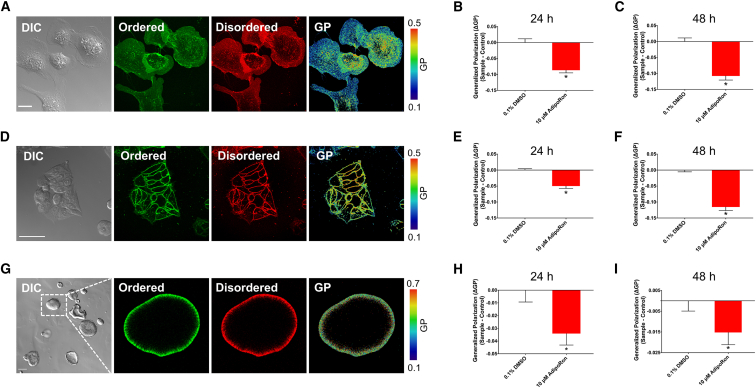
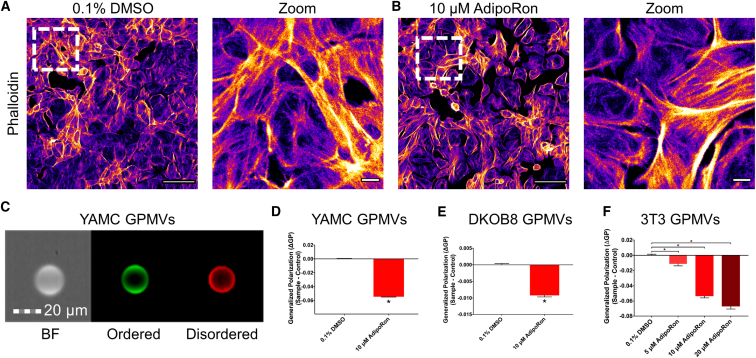
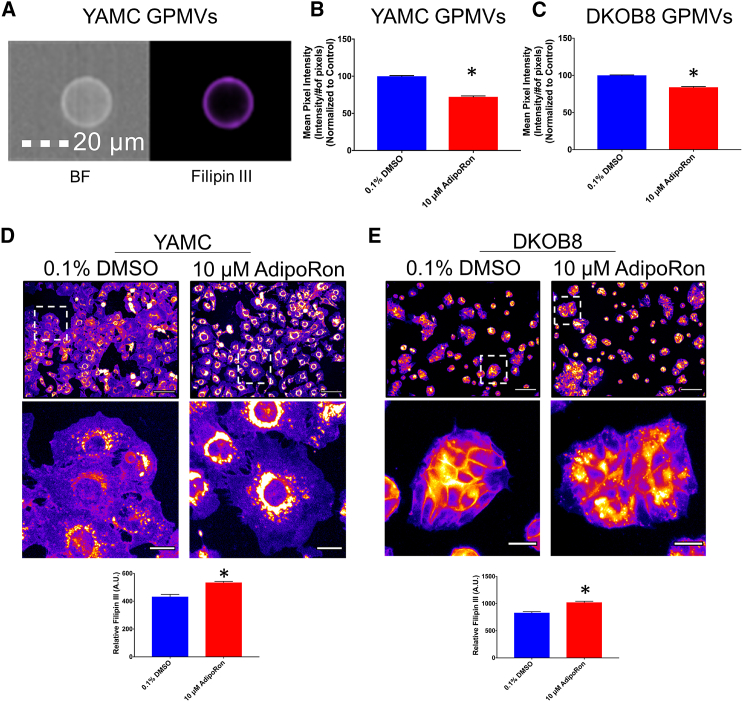
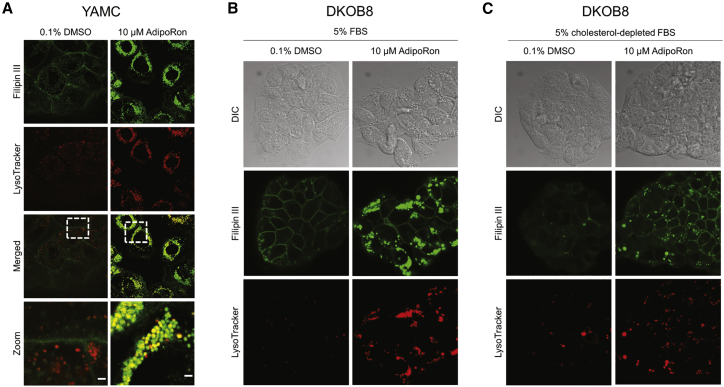
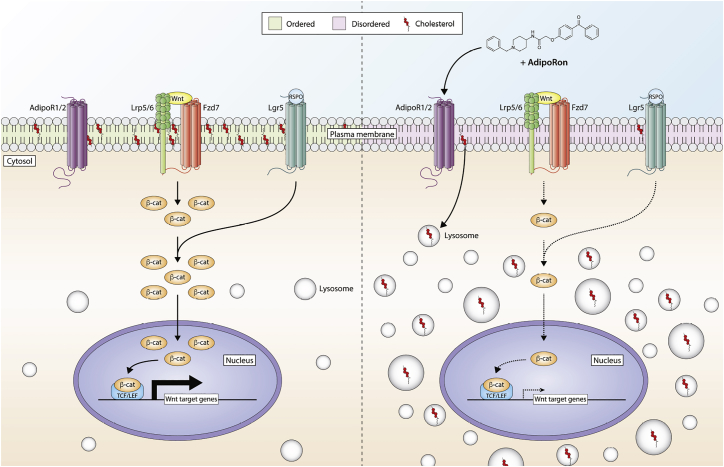
The increasing prevalence of adult and adolescent obesity and its associated risk of colorectal cancer reinforces the urgent need to elucidate the underlying mechanisms contributing to the promotion of colon cancer in obese individuals. Adiponectin is an adipose tissue-derived adipokine, whose levels are reduced during obesity. Both epidemiological and preclinical data indicate that adiponectin suppresses colon tumorigenesis. We have previously demonstrated that both adiponectin and AdipoRon, a small-molecule adiponectin receptor agonist, suppress colon cancer risk in part by reducing the number of Lgr5+ stem cells in mouse colonic organoids. However, the mechanism by which the adiponectin signaling pathway attenuates colon cancer risk remains to be addressed. Here, we have hypothesized that adiponectin signaling supports colonic stem cell maintenance through modulation of the biophysical properties of the plasma membrane (PM). Specifically, we investigated the effects of adiponectin receptor activation by AdipoRon on the biophysical perturbations linked to the attenuation of Wnt-driven signaling and cell proliferation as determined by LEF luciferase reporter assay and colonic organoid proliferation, respectively. Using physicochemical sensitive dyes, Di-4-ANEPPDHQ and C-laurdan, we demonstrated that AdipoRon decreased the rigidity of the colonic cell PM. The decrease in membrane rigidity was associated with a reduction in PM free cholesterol levels and the intracellular accumulation of free cholesterol in lysosomes. These results suggest that adiponectin signaling plays a role in modulating cellular cholesterol homeostasis, PM biophysical properties, and Wnt-driven signaling. These findings are noteworthy because they may in part explain how obesity drives colon cancer progression.
Copyright © 2019 Biophysical Society. Published by Elsevier Inc. All rights reserved.
Figures
Similar articles
-
AdipoRon and Other Adiponectin Receptor Agonists as Potential Candidates in Cancer Treatments.Int J Mol Sci. 2021 May 25;22(11):5569. doi: 10.3390/ijms22115569. Int J Mol Sci. 2021. PMID: 34070338 Free PMC article. Review.
-
AdipoRon, an adiponectin receptor agonist, attenuates PDGF-induced VSMC proliferation through inhibition of mTOR signaling independent of AMPK: Implications toward suppression of neointimal hyperplasia.Pharmacol Res. 2017 May;119:289-302. doi: 10.1016/j.phrs.2017.02.016. Epub 2017 Feb 22. Pharmacol Res. 2017. PMID: 28237515 Free PMC article.
-
Adiponectin receptor agonist AdipoRon ameliorates renal inflammation in diet-induced obese mice and endotoxin-treated human glomeruli ex vivo.Diabetologia. 2021 Aug;64(8):1866-1879. doi: 10.1007/s00125-021-05473-9. Epub 2021 May 14. Diabetologia. 2021. PMID: 33987714 Free PMC article.
-
The Adiponectin Receptor Agonist AdipoRon Ameliorates Diabetic Nephropathy in a Model of Type 2 Diabetes.J Am Soc Nephrol. 2018 Apr;29(4):1108-1127. doi: 10.1681/ASN.2017060627. Epub 2018 Jan 12. J Am Soc Nephrol. 2018. PMID: 29330340 Free PMC article.
-
AdipoRon: A Novel Insulin Sensitizer in Various Complications and the Underlying Mechanisms: A Review.Curr Mol Pharmacol. 2020;13(2):94-107. doi: 10.2174/1874467212666191022102800. Curr Mol Pharmacol. 2020. PMID: 31642417 Review.
Cited by
-
AdipoRon and Other Adiponectin Receptor Agonists as Potential Candidates in Cancer Treatments.Int J Mol Sci. 2021 May 25;22(11):5569. doi: 10.3390/ijms22115569. Int J Mol Sci. 2021. PMID: 34070338 Free PMC article. Review.
-
Dysregulation of cellular membrane homeostasis as a crucial modulator of cancer risk.FEBS J. 2024 Apr;291(7):1299-1352. doi: 10.1111/febs.16665. Epub 2022 Nov 7. FEBS J. 2024. PMID: 36282100 Free PMC article. Review.
-
Lipid flippase dysfunction as a therapeutic target for endosomal anomalies in Alzheimer's disease.iScience. 2022 Feb 4;25(3):103869. doi: 10.1016/j.isci.2022.103869. eCollection 2022 Mar 18. iScience. 2022. PMID: 35243232 Free PMC article.
-
The utility of 3D models to study cholesterol in cancer: Insights and future perspectives.Front Oncol. 2023 Apr 3;13:1156246. doi: 10.3389/fonc.2023.1156246. eCollection 2023. Front Oncol. 2023. PMID: 37077827 Free PMC article. Review.
-
Unravelling the Adiponectin Hallmark and Exploring the Therapeutic Potential of Its Receptor Agonists in Cancer Metabolic Reprogramming.Biomolecules. 2025 Jun 5;15(6):820. doi: 10.3390/biom15060820. Biomolecules. 2025. PMID: 40563460 Free PMC article. Review.
References
Publication types
MeSH terms
Substances
Grants and funding
LinkOut - more resources
Full Text Sources
Other Literature Sources
