. 2019 Dec;73(12):2436-2450.
doi: 10.1111/evo.13865. Epub 2019 Nov 6.

Altitude and life-history shape the evolution of Heliconius wings

Affiliations

Altitude and life-history shape the evolution of Heliconius wings

Gabriela Montejo-Kovacevich et al. Evolution. 2019 Dec.

Abstract

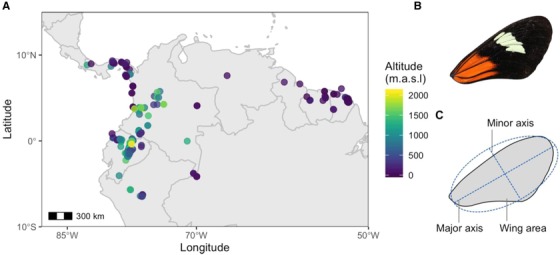
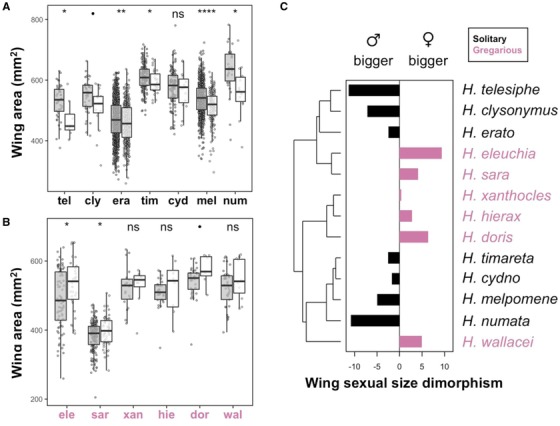
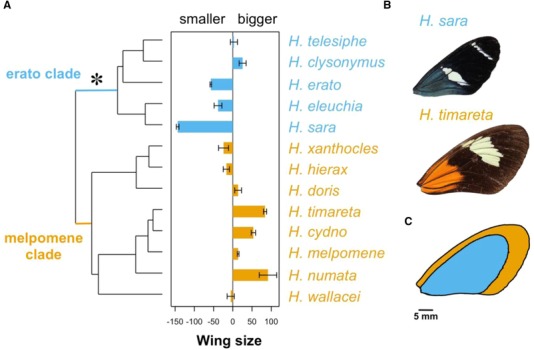
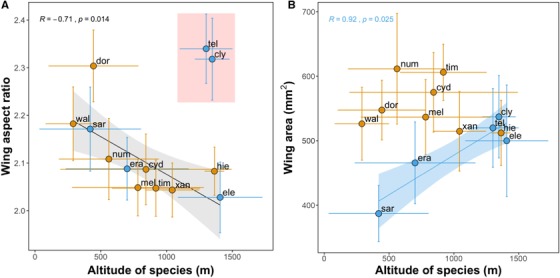
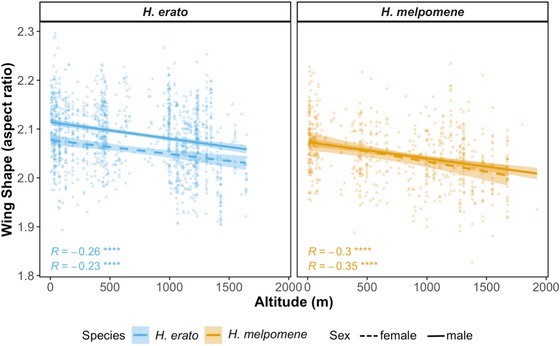
Phenotypic divergence between closely related species has long interested biologists. Taxa that inhabit a range of environments and have diverse natural histories can help understand how selection drives phenotypic divergence. In butterflies, wing color patterns have been extensively studied but diversity in wing shape and size is less well understood. Here, we assess the relative importance of phylogenetic relatedness, natural history, and habitat on shaping wing morphology in a large dataset of over 3500 individuals, representing 13 Heliconius species from across the Neotropics. We find that both larval and adult behavioral ecology correlate with patterns of wing sexual dimorphism and adult size. Species with solitary larvae have larger adult males, in contrast to gregarious Heliconius species, and indeed most Lepidoptera, where females are larger. Species in the pupal-mating clade are smaller than those in the adult-mating clade. Interestingly, we find that high-altitude species tend to have rounder wings and, in one of the two major Heliconius clades, are also bigger than their lowland relatives. Furthermore, within two widespread species, we find that high-altitude populations also have rounder wings. Thus, we reveal novel adaptive wing morphological divergence among Heliconius species beyond that imposed by natural selection on aposematic wing coloration.

Keywords: Altitude; Heliconius; Lepidoptera; phenotypic divergence; sexual dimorphism; wing morphology.


Figures

Figure 1
Figure 1
Localities and forewing measurements. (A) Map of exact locations (n = 313) across South America from where the samples used for our analyses were collected. Points are colored by altitude. (B) Representative of a right forewing image of H. melpomene malleti. (C) Measurements taken from each wing by fitting an ellipse with Fiji custom scripts. [Color figure can be viewed at http://wileyonlinelibrary.com]
Figure 2
Figure 2
Sexual wing area dimorphism across species and the phylogeny. (A) Wing size differences between males (grey) and females (white) of the seven single egg‐laying species and (B) the six gregarious species in this study. Error bars represent 95% confidence intervals of the means. Stars represent significance levels of two sample t‐tests between female and male wing areas for each species (•<0.1, *< 0.05, **<0.01, ***<0.001); for full t‐tests output, see Table S1. (C) Bar plot represents sexual size dimorphism calculated as percentage difference in female versus male size (positive means bigger females, right panel). Species with gregarious larvae are colored in pink, and those with solitary larvae are colored in black. [Color figure can be viewed at http://wileyonlinelibrary.com]
Figure 3
Figure 3
Male wing area differences across the phylogeny. (A) Bar plot represents centered mean wing area per species (positive values represent species with bigger wings than the average Heliconius wing). Wing area, x‐axis, is the difference in wing area from the mean (in mm2). Error bars represent standard errors. The star represents the origin of pupal‐mating. Species from the erato clade are in blue, and those from the melpomene clade are in orange. (B) Representatives of H. timareta and H. sara closest to the mean wing area of the species are shown (606.25 and 386.6 mm2, respectively). (C) Images from (B) superimposed to compare visually the mean size difference between the two species. [Color figure can be viewed at http://wileyonlinelibrary.com]
Figure 4
Figure 4
Species variation in wing aspect ratio (A) and wing area (B). Plots show the effect of altitude (meters above sea level) on wing aspect ratio (major axis/minor axis, higher values represent longer wings) and wing area (mm2). Points represent species mean raw values per species. Horizontal and vertical lines show standard error for species mean altitude and mean trait, respectively. Lines show best linear fit and are colored by clade when clade was a significant predictor (blue: erato clade, orange: melpomene clade). Shaded areas show confidence bands at 1 standard error. The point labels correspond to the first three characters of the following Heliconius species: H. telesiphe, H. clysonymus, H. erato, H. eleuchia, H. sara, H. doris, H. xanthocles, H. hierax, amH. wallacei, H. numata, H. melpomene, H. timareta, and H. cydno. Two species, H. telesiphe and H. clysonymus, showed high levels of phylogenetic autocorrelation (Fig. S7) and were thus excluded from the linear model plotted (but not from the main analyses where phylogeny is accounted for). [Color figure can be viewed at http://wileyonlinelibrary.com]
Figure 5
Figure 5
Within‐species variation in wing aspect ratio across altitudes in H. erato (blue) and H. melpomene (orange), females (triangles, dotted line) and males (circles, solid line). Lines show best linear fit and are colored by species. Shaded areas show confidence bands at 1 standard error. Pearson correlation coefficients and P‐values are shown for each regression plotted. (•<0.1, * < 0.05, ** <0.01, *** <0.001). [Color figure can be viewed at http://wileyonlinelibrary.com]

References

    1. Abouheif, E. 1999. A method for testing the assumption of phylogenetic independence in comparative data. Evol. Ecol. Res. 1:895–909.
    1. Allen, C. E. , Zwaan B. J., and Brakefield P. M.. 2011. Evolution of sexual dimorphism in the Lepidoptera. Annu. Rev. Entomol. 56:445–464. - PubMed
    1. Altizer, S. , and Davis A. K.. 2010. Populations of monarch butterflies with different migratory behaviors show divergence in wing morphology. Evolution 64:1018–1028. - PubMed
    1. Azevedo, R. B. R. , James A. C., McCabe J., and Partridge L.. 1998. Latitudinal variation of wing: thorax size ratio and wing‐aspect ratio in Drosophila melanogaster . Evolution 52:1353–1362. - PubMed
    1. Barton, K. and Barton M. K., 2019. Package ‘MuMIn’. Multi‐model inference. version, 1(6).

Publication types