. 2020 May;83(5):1673-1687.
doi: 10.1002/mrm.28039. Epub 2019 Oct 21.

3D Whole-heart free-breathing qBOOST-T2 mapping

Affiliations

3D Whole-heart free-breathing qBOOST-T2 mapping

Giorgia Milotta et al. Magn Reson Med. 2020 May.

Abstract

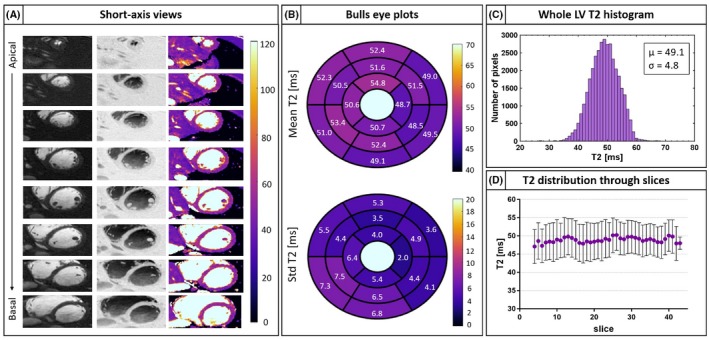
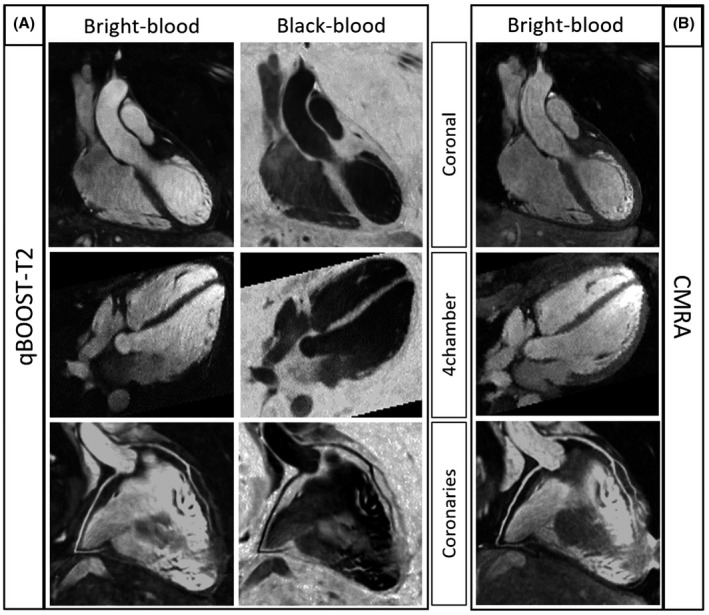
Purpose: To develop an accelerated motion corrected 3D whole-heart imaging approach (qBOOST-T2) for simultaneous high-resolution bright- and black-blood cardiac MR imaging and quantitative myocardial T2 characterization.

Methods: Three undersampled interleaved balanced steady-state free precession cardiac MR volumes were acquired with a variable density Cartesian trajectory and different magnetization preparations: (1) T2-prepared inversion recovery (T2prep-IR), (2) T2-preparation, and (3) no preparation. Image navigators were acquired prior the acquisition to correct for 2D translational respiratory motion. Each 3D volume was reconstructed with a low-rank patch-based reconstruction. The T2prep-IR volume provides bright-blood anatomy visualization, the black-blood volume is obtained by means of phase sensitive reconstruction between first and third datasets, and T2 maps are generated by matching the signal evolution to a simulated dictionary. The proposed sequence has been evaluated in simulations, phantom experiments, 11 healthy subjects and compared with 3D bright-blood cardiac MR and standard 2D breath-hold balanced steady-state free precession T2 mapping. The feasibility of the proposed approach was tested on 4 patients with suspected cardiovascular disease.

Results: High linear correlation (y = 1.09 × -0.83, R2 = 0.99) was found between the proposed qBOOST-T2 and T2 spin echo measurements in phantom experiment. Good image quality was observed in vivo with the proposed 4x undersampled qBOOST-T2. Mean T2 values of 53.1 ± 2.1 ms and 55.8 ± 2.7 ms were measured in vivo for 2D balanced steady-state free precession T2 mapping and qBOOST-T2, respectively, with linear correlation of y = 1.02x+1.46 (R2 = 0.61) and T2 bias = 2.7 ms.

Conclusion: The proposed qBOOST-T2 sequence allows the acquisition of 3D high-resolution co-registered bright- and black-blood volumes and T2 maps in a single scan of ~11 min, showing promising results in terms of T2 quantification.

Keywords: 3D whole-heart; T2 mapping; black-blood imaging; bright-blood cardiac anatomy; respiratory motion correction.


Figures

Figure 1
Figure 1
Framework of the proposed 3D whole‐heart qBOOST‐T2. Acquisition (A), Three undersampled interleaved bSSFP bright‐blood volumes are acquired with: (1) T2prep‐IR, (2) T2prep, and (3) no preparation modules, respectively. 2D‐iNAVs are acquired in each heartbeat before image acquisition. Reconstruction (B), image navigators are used to estimate/correct SI and LR translational motion. Translational beat‐to‐beat motion correction is performed on the 3 datasets independently and each volume is reconstructed with 3D PROST reconstruction. PSIR reconstruction (C), Black‐blood images are obtained by performing a PSIR reconstruction between the dataset acquired with T2prep‐IR preparation (bright‐blood image) and the third volume as a phase reference. T2 map generation (D), T2 map is generated by matching the measured signal and a previously generated EPG simulated dictionary. The first dataset acquisition includes a STIR fat suppression (TI = 110 ms), whereas the second and third datasets use a SPIR pulse for fat saturation
Figure 2
Figure 2
EPG simulations performed to investigate T1 and different HR dependency of the proposed technique. A, Signal evolution of T1/T2 pairs with T2 = (40:6:88) ms and T1 = (800:100:1400) ms were matched to a EPG dictionary with T1 = (900, 1100, 1300) ms. A T2 variability < 5% was observed for all the different T2 values. B, T2 values matched for different simulated HRs. The matched T2 is insensitive to HR variability in simulations experiments
Figure 3
Figure 3
Phantom experiments. A, T2 quantification obtained with reference SE experiment, 2D standard bSSFP T2 mapping and the proposed qBOOST‐T2 sequence for 6 vials with different agar concentration. B, T2 dependency of the proposed sequence to different T1 values included in the dictionary. 1st T1 dictionary = (900, 1100, 1300) ms, 2nd T1 dictionary = (900, 1100, 1300, 1600, 1800) ms, and 3rd T1 dictionary = (900, 1100, 1300, 1600, 1800, 2000, 2400, 2600) ms. A variation of 3.2% and 3.8% is observed, respectively, for T2 values that corresponds to healthy myocardium T2myoc = 55 ms and diseased myocardium T2myoc‐diseased = 65 ms, whereas a variation of 8.6% was observed for a long T2 = 115 ms. C, T2 dependency to different simulated HRs. A T2 variation between 8.2% and 11.6% for HR ranging between 40 and 120 bpm was observed for all the phantom vials
Figure 4
Figure 4
Two representative healthy subjects acquired with the proposed qBOOST‐T2 sequence. 3D high‐resolution bright‐blood (first column), black‐blood (second column), and T2 maps (third column) are co‐registered. Coronal, short axis, transversal, and 4‐chamber views are shown. Acquisition parameters included: 3D bSSFP, T2prep1st‐heartbeat = 50 ms, T2prep2nd‐heartbeat = 30 ms, TI = 110 ms, FA = 90 degrees, resolution = 1 × 1 × 2 mm, 4× undersampling, 14 start‐up echoes for iNAV acquisition
Figure 5
Figure 5
A, Bright‐blood, black‐blood, and T2 map short‐axis views from apex to base are shown for 1 representative healthy subject. The 3D nature of the acquisition permits to obtain complete coverage of the heart. B, Bull's eye plot of average T2 quantification and T2 standard deviation show uniform T2 quantification in all the different segments. C, Histogram of per‐pixel T2 distribution through the whole left ventricle. D, Averaged T2 distribution through coronal slice. Uniform T2 quantification is observed in the left ventricle
Figure 6
Figure 6
Comparison between bright‐blood anatomical images (first column), black‐blood images (second column) acquired with qBOOST‐T2 (A), and bright‐blood CMRA (B) for 1 healthy subject. Coronal, 4‐chamber views, and coronary artery reformats are shown in first, second, and third row, respectively
Figure 7
Figure 7
Comparison between 2D short‐axis standard T2 maps and short‐axis reformatted 3D qBOOST‐T2 maps for 10 healthy subjects. qBOOST‐T2 maps have been reformatted to the same slice position of the acquired 2D bSSFP T2 maps. Comparable visual image quality is obtained with the 2 approaches
Figure 8
Figure 8
Quantification of septal myocardium mean T2 and precision of the proposed qBOOST‐T2 technique and comparison with conventional 2D T2 mapping. A, Comparison between myocardial mean T2 obtained with conventional 2D T2 mapping (gray) and the proposed 3D qBOOST‐T2 mapping sequence (blue) for each healthy subject. Good agreement is observed in terms of mean T2 between the 2 approaches. B, Comparison between myocardial T2 precision (measured as standard deviation with in a septal ROI) obtained with conventional 2D T2 mapping (gray) and the proposed 3D qBOOST‐T2 mapping sequence (blue) for each healthy subject. C, Bland Altman plot comparing the proposed qBOOST‐T2 sequence with the conventional 2D bSSFP T2 mapping technique. Good agreement is observed between the 2 approaches. A slight T2 overestimation is obtained with qBOOST‐T2mapping (bias = 2.71 ms), however, T2 quantification is within the 95% interval. D, Comparison between precision obtained with standard T2 mapping and the proposed qBOOST‐T2. A slightly lower (not significant) precision is observed with the proposed qBOOST‐T2 sequence. Myocardial T2 accuracy and precision were measured in a ROI in the septum of the myocardium
Figure 9
Figure 9
Percentage of variation of mean T2 (A) and T2 precision (B) between 2D bSSFP and 3D qBOOST‐T2. T2 overestimation and a lower precision are observed in each segment of the left ventricle. A, anterior; S, septal; I, inferior; L, lateral; AS, anterior‐septal; IS, inferior‐septal; IL, inferior‐lateral; AL, anterior‐lateral
Figure 10
Figure 10
Comparison between 2D short‐axis standard T2 maps and short‐axis reformatted 3D qBOOST‐T2 maps for 4 patients with suspected cardiovascular disease. Apical, mid, and basal slices are shown for the acquired patients. Additionally, bright‐blood and black‐blood short axis reformatted images are shown for the qBOOST‐T2 acquisition. No pathologies were diagnosed for any of the acquired patients

References

    1. Marcotte F, Poirier N, Pressacco J, et al. Evaluation of adult congenital heart disease by cardiac magnetic resonance imaging. Congenit Heart Dis. 2009;4:216–230. - PubMed
    1. Neglia D, Rovai D, Caselli C, et al. Detection of significant coronary artery disease by noninvasive anatomical and functional imaging. Circ Cardiovasc Imaging. 2015;8:e002179 10.1161/CIRCIMAGING.114.002179. - DOI - PubMed
    1. Giri S, Chung Y‐C, Merchant A, et al. T2 quantification for improved detection of myocardial edema. J Cardiovasc Magn Reson. 2009;11:56. - PMC - PubMed
    1. Kim WY, Danias PG, Stuber M, et al. Coronary magnetic resonance angiography for the detection of coronary stenoses. N Engl J Med. 2001;345:1863–1869. - PubMed
    1. Jansen C, Perera D, Makowski MR, et al. Detection of intracoronary thrombus by magnetic resonance imaging in patients with acute myocardial infarction. Circulation. 2011;124:416 LP‐424. - PubMed

Publication types