

HIV Infected T Cells Can Proliferate in vivo Without Inducing Expression of the Integrated Provirus
- PMID: 31632364
- PMCID: PMC6781911
- DOI: 10.3389/fmicb.2019.02204
HIV Infected T Cells Can Proliferate in vivo Without Inducing Expression of the Integrated Provirus
Abstract
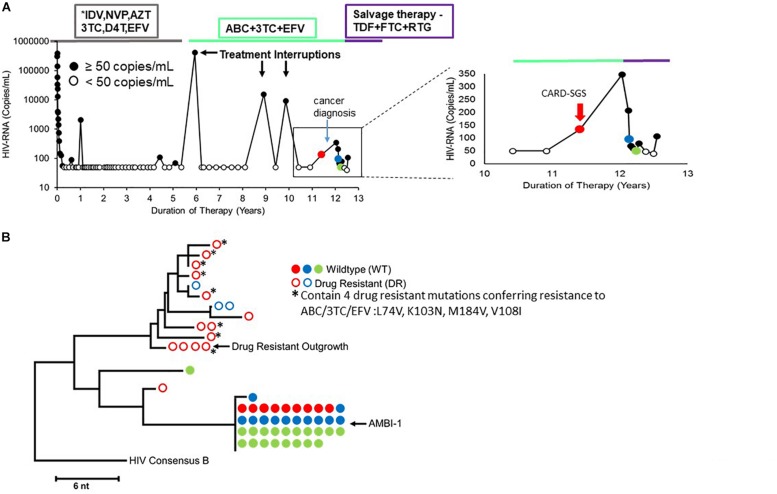
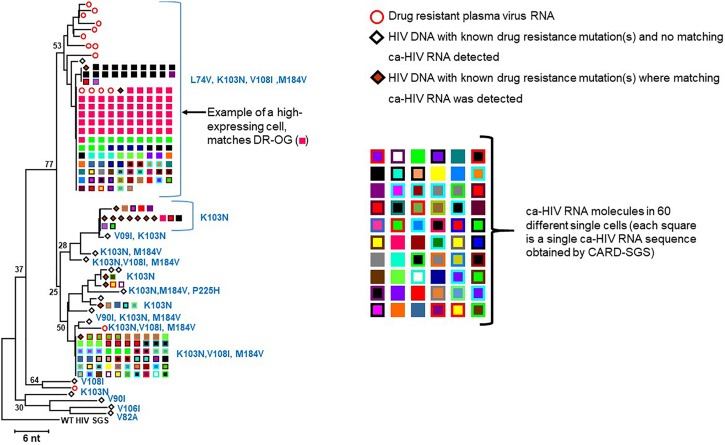
Background: HIV-1 proviruses can persist during ART in clonally-expanded populations of CD4+ T cells. To date, few examples of an expanded clones containing replication-competent proviruses exist, although it is suspected to be common. One such clone, denoted AMBI-1 (Maldarelli et al., 2014), was also a source of persistent viremia on ART, begging the question of how the AMBI-1 clone can survive despite infection with a replication-competent, actively-expressing provirus. We hypothesized that only a small fraction of cells within the AMBI-1 clone are activated to produce virus particles during cell division while the majority remain latent despite division, ensuring their survival. To address this question, we determined the fraction of HIV-1 proviruses within the AMBI-1 clone that expresses unspliced cell-associated RNA during ART and compared this fraction to 33 other infected T cell clones within the same individual.
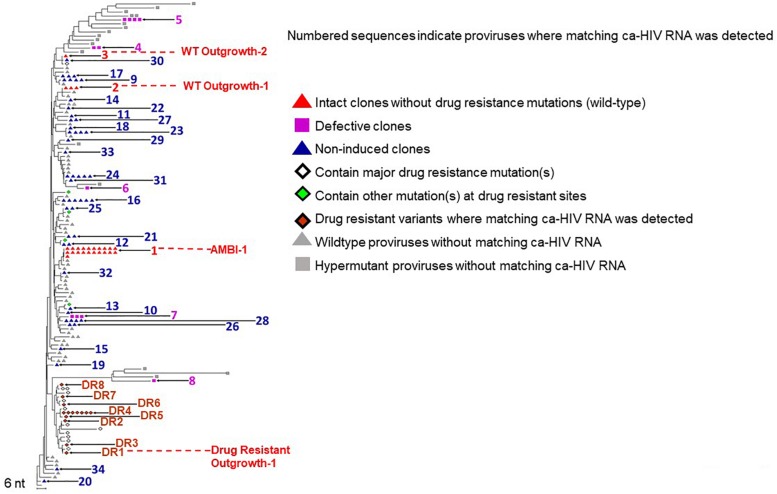
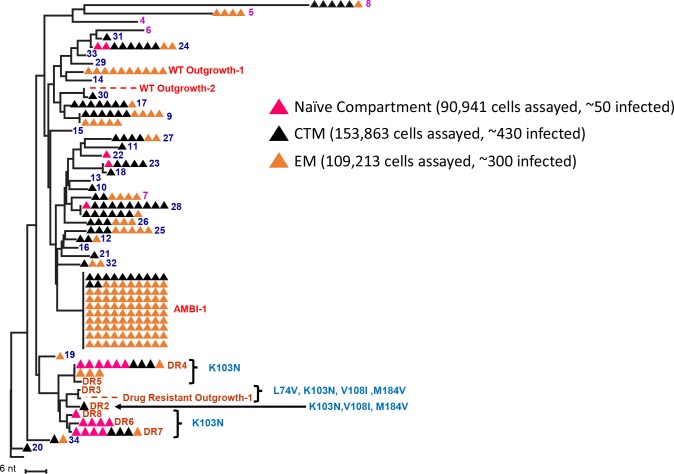
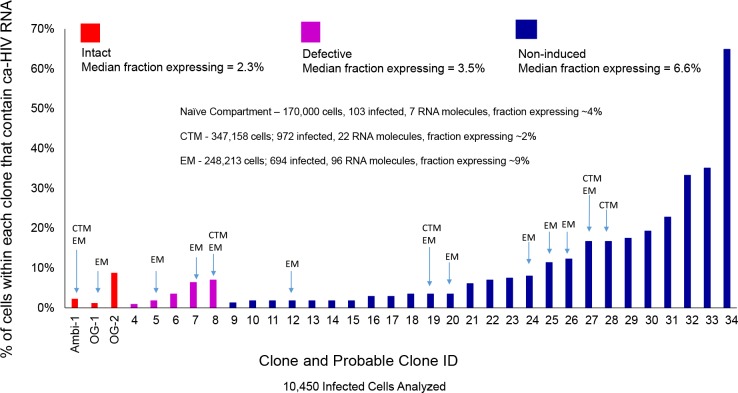
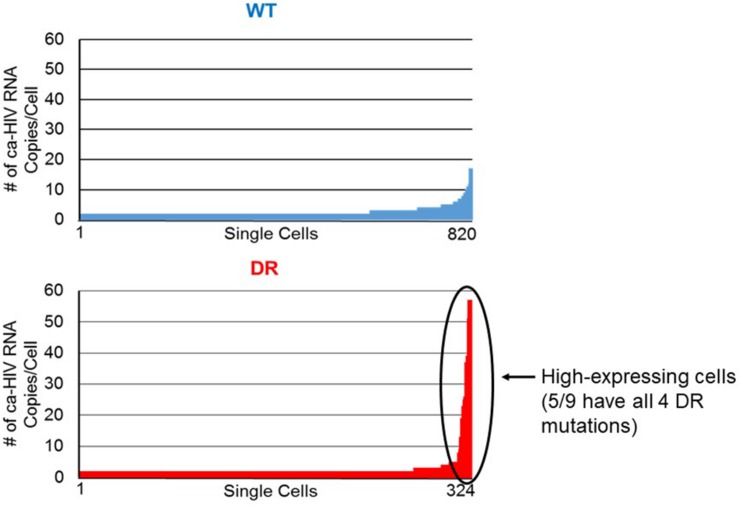
Results: In total, 34 different clones carrying either intact or defective proviruses in "Patient 1" from Maldarelli et al. (2014) were assessed. We found that 2.3% of cells within the AMBI-1 clone contained unspliced HIV-1 RNA. Highest levels of HIV-1 RNA were found in the effector memory (EM) T cell subset. The fraction of cells within clones that contained HIV-1 RNA was not different in clones with intact (median 2.3%) versus defective (median 3.5%) proviruses (p = 0.2). However, higher fractions and levels of RNA were found in cells with proviruses containing multiple drug resistance mutations, including those contributing to rebound viremia.
Conclusion: These findings show that the vast majority of HIV-1 proviruses within expanded T cell clones, including intact proviruses, may be transcriptionally silent at any given time, implying that infected T cells may be able to be activated to proliferate without inducing the expression of the integrated provirus or, alternatelively, may be able to proliferate without cellular activation. The results of this study suggest that the long, presumed correlation between the level of cellular and proviral activation may not be accurate and, therefore, requires further investigation.
Keywords: CARD-SGS; HIV reservoir; SGA; cell-associated HIV RNA; expanded clones; latent; latently-infected cells; proviral expression.
Copyright © 2019 Musick, Spindler, Boritz, Pérez, Crespo-Vélez, Patro, Sobolewski, Bale, Reid, Keele, Capoferri, Shao, Wiegand, Simonetti, Mellors, Hughes, Coffin, Maldarelli and Kearney.
Figures
Similar articles
-
Clonal Expansion of Infected CD4+ T Cells in People Living with HIV.Viruses. 2021 Oct 15;13(10):2078. doi: 10.3390/v13102078. Viruses. 2021. PMID: 34696507 Free PMC article. Review.
-
Single-cell analysis of HIV-1 transcriptional activity reveals expression of proviruses in expanded clones during ART.Proc Natl Acad Sci U S A. 2017 May 2;114(18):E3659-E3668. doi: 10.1073/pnas.1617961114. Epub 2017 Apr 17. Proc Natl Acad Sci U S A. 2017. PMID: 28416661 Free PMC article.
-
Proviral location affects cognate peptide-induced virus production and immune recognition of HIV-1-infected T cell clones.J Clin Invest. 2023 Nov 1;133(21):e171097. doi: 10.1172/JCI171097. J Clin Invest. 2023. PMID: 37698927 Free PMC article.
-
Clonally expanded CD4+ T cells can produce infectious HIV-1 in vivo.Proc Natl Acad Sci U S A. 2016 Feb 16;113(7):1883-8. doi: 10.1073/pnas.1522675113. Epub 2016 Feb 8. Proc Natl Acad Sci U S A. 2016. PMID: 26858442 Free PMC article.
-
New Approaches to Multi-Parametric HIV-1 Genetics Using Multiple Displacement Amplification: Determining the What, How, and Where of the HIV-1 Reservoir.Viruses. 2021 Dec 10;13(12):2475. doi: 10.3390/v13122475. Viruses. 2021. PMID: 34960744 Free PMC article. Review.
Cited by
-
HIV infected CD4+ T cell clones are more stable than uninfected clones during long-term antiretroviral therapy.PLoS Pathog. 2022 Aug 31;18(8):e1010726. doi: 10.1371/journal.ppat.1010726. eCollection 2022 Aug. PLoS Pathog. 2022. PMID: 36044447 Free PMC article.
-
The Complex Interactions Between HIV-1 and Human Host Cell Genome: From Molecular Mechanisms to Clinical Practice.Int J Mol Sci. 2025 Mar 29;26(7):3184. doi: 10.3390/ijms26073184. Int J Mol Sci. 2025. PMID: 40244051 Free PMC article. Review.
-
Clonal Expansion of Infected CD4+ T Cells in People Living with HIV.Viruses. 2021 Oct 15;13(10):2078. doi: 10.3390/v13102078. Viruses. 2021. PMID: 34696507 Free PMC article. Review.
-
Host T Cell Dedifferentiation Effects Drive HIV-1 Latency Stability.J Virol. 2022 Mar 9;96(5):e0197421. doi: 10.1128/jvi.01974-21. Epub 2022 Jan 12. J Virol. 2022. PMID: 35019721 Free PMC article.
-
Phenotypic characterization of single CD4+ T cells harboring genetically intact and inducible HIV genomes.Nat Commun. 2023 Feb 27;14(1):1115. doi: 10.1038/s41467-023-36772-x. Nat Commun. 2023. PMID: 36849523 Free PMC article.
References
-
- Bui J. K., Halvas E. K., Fyne E., Sobolewski M. D., Koontz D., Shao W., et al. (2017). Ex vivo activation of CD4+ T-cells from donors on suppressive ART can lead to sustained production of infectious HIV-1 from a subset of infected cells. PLoS Pathog. 13:e1006230. 10.1371/journal.ppat.1006230 - DOI - PMC - PubMed
-
- Chun T. W., Finzi D., Margolick J., Chadwick K., Schwartz D., Siliciano R. F. (1995). In vivo fate of HIV-1-infected T cells: quantitative analysis of the transition to stable latency. Nat. Med. 1 1284–1290. - PubMed
-
- Grau-Exposito J., Serra-Peinado C., Miguel L., Navarro J., Curran A., Burgos J., et al. (2017). A novel single-cell FISH-Flow assay identifies effector memory CD4(+) T cells as a major niche for HIV-1 transcription in HIV-Infected patients. mBio 8:e0876-17. 10.1128/mBio.00876-17 - DOI - PMC - PubMed
Grants and funding
LinkOut - more resources
Full Text Sources
Research Materials