. 2019;19(15):10087-10110.
doi: 10.5194/acp-2018-525.

Ultraviolet radiation modelling using output from the Chemistry Climate Model Initiative

Affiliations

Ultraviolet radiation modelling using output from the Chemistry Climate Model Initiative

Kévin Lamy et al. Atmos Chem Phys Discuss. 2019.

Abstract

We have derived values of the Ultraviolet Index (UVI) at solar noon using the Tropospheric Ultraviolet Model (TUV) driven by ozone, temperature and aerosol fields from climate simulations of the first phase of the Chemistry-Climate Model Initiative (CCMI-1). Since clouds remain one of the largest uncertainties in climate projections, we simulated only the clear-sky UVI. We compared the modelled UVI climatologies against present-day climatological values of UVI derived from both satellite data (the OMI-Aura OMUVBd product) and ground-based measurements (from the NDACC network). Depending on the region, relative differences between the UVI obtained from CCMI/TUV calculations and the ground-based measurements ranged between -5.9% and 10.6%. We then calculated the UVI evolution throughout the 21st century for the four Representative Concentration Pathways (RCPs 2.6, 4.5, 6.0 and 8.5). Compared to 1960s values, we found an average increase in the UVI in 2100 (of 2-4%) in the tropical belt (30°N-30°S). For the mid-latitudes, we observed a 1.8 to 3.4 % increase in the Southern Hemisphere for RCP 2.6, 4.5 and 6.0, and found a 2.3% decrease in RCP 8.5. Higher increases in UVI are projected in the Northern Hemisphere except for RCP 8.5. At high latitudes, ozone recovery is well identified and induces a complete return of mean UVI levels to 1960 values for RCP 8.5 in the Southern Hemisphere. In the Northern Hemisphere, UVI levels in 2100 are higher by 0.5 to 5.5% for RCP 2.6, 4.5 and 6.0 and they are lower by 7.9% for RCP 8.5. We analysed the impacts of greenhouse gases (GHGs) and ozone-depleting substances (ODSs) on UVI from 1960 by comparing CCMI sensitivity simulations (1960-2100) with fixed GHGs or ODSs at their respective 1960 levels. As expected with ODS fixed at their 1960 levels, there is no large decrease in ozone levels and consequently no sudden increase in UVI levels. With fixed GHG, we observed a delayed return of ozone to 1960 values, with a corresponding pattern of change observed on UVI, and looking at the UVI difference between 2090s values and 1960s values, we found an 8 % increase in the tropical belt during the summer of each hemisphere. Finally we show that, while in the Southern Hemisphere the UVI is mainly driven by total ozone column, in the Northern Hemisphere both total ozone column and aerosol optical depth drive UVI levels, with aerosol optical depth having twice as much influence on the UVI as total ozone column does.


Figures
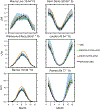
Figure 1.
Figure 1.
UVIGB (2000–2010) for six NDACC stations along with the respective closest grid point from CCMI&TUV UVI simulation (UVIMEAN and UVIMEDIAN). Station measurements are represented in the black curve with a 2σ dispersion bar. UVIMEAN and UVIMEDIAN are represented in green and red. Each CCMI models are represented in light blue, the shaded blue area represents the spread of the models. UVIOMI from the OMUVBd product are in orange.
Figure 2.
Figure 2.
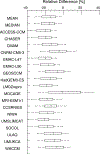
Boxplots summaries of the relative differences between the monthly UVI from CCMI models (refC2) and the monthly mean OMUVBd product for the period 2000–2010. Left and right end of the box are the first and third quartile respectively. The line inside the box is the median or second quartile. Left and right end of the whiskers are the mean ± 1-standard deviation. For a model M, (M being Mean, Median, ACCESS-CCM, CHASER, … ) from which we obtained UVIM, we compute: UVIRD[%]=100UVIMUVIOMIUVIOMI We then compute the average value of UVIRD over the entire globe and the period 2000–2010.
Figure 3.
Figure 3.
UVI annual mean relative difference between the median UVI obtained from the 18 CCMI model data used and TUV and the UVI obtained from the CCMI median TOZ used with TUV for the period 2000–2010. First, we compute the relative difference: UVIRD[%]=200UVIALLMUVIMEDIANUVIALLM+UVIMEDIAN Then we compute the average of UVIRD over the period 2000–2010 for each point.
Figure 4.
Figure 4.
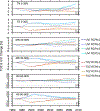
UVI and TOZ percent change in 2090–2100 relative to 1960–1970 values for six latitudinal bands; Northern Tropical band (0°- 30 °N), Southern Tropical band (0°- 30 °S), Northern Mid Latitude band (30°- 60 °N), Southern Mid Latitude band (30°- 60 °S), Northern High Latitude band (60°- 90 °N), Southern High Latitude band (60°- 90 °S). UVI changes are represented in different shades of blue for the four RCPs scenarios. TOZ changes are represented in different shades of red. Scale of the vertical axis are not the same for each subplot.
Figure 5.
Figure 5.
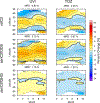
Latitudinal and monthly variation of UVI and TOZ percent change in 2090–2100 relative to 2000–2010 for the four RCP scenarios
Figure 6.
Figure 6.
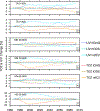
UVI and TOZ percent changes (relative to 1960s values) for six latitudinal bands; Northern Tropical band (0°- 30 °N), Southern Tropical band (0°- 30 °S), Northern Mid Latitude band (30°- 60 °N), Southern Mid Latitude band (30°- 60 °S), Northern High Latitude band (60°- 90 °N), Southern High Latitude band (60°- 90 °S). UVI changes are represented in differents shades of blue for the three EXP2 scenarios. TOZ changes are represented in differents shades of red.
Figure 7.
Figure 7.
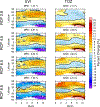
Latitudinal and monthly variation of UVI and TOZ percent change between 2090–2100 and 1960–1970 values for refC2, senC2fODS, senC2fGHG.
Figure 8.
Figure 8.
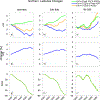
UVI, TOZ and AOD percent change from 2000 to 2010 values in the northern high, mid, and low latitudes for the EXP3 experiment. UVI modelled with transient TOZ and and AOD fixed at present-day climatological values are in blue. UVI modelled with TOZ fixed at present-day climatological values and AOD variable through the 21st century are in green. UVI modelled with transient TOZ and AOD are in orange. TOZ and AOD are respectively in blue and green.
Figure 9.
Figure 9.
UVI, TOZ and AOD percent change from 2000 to 2010 values in the southern high, mid, and low latitudes for the EXP3 experiment. UVI calculated with transient TOZ and and AOD fixed at present-day climatological values are in blue. UVI calculated with TOZ fixed at present-day climatological values and AOD variable through the 21st century are in green. UVI calculated with transient TOZ and AOD are in orange. TOZ and AOD are in blue and green respectively.

References

    1. Akiyoshi H, Nakamura T, Miyasaka T, Shiotani M, and Suzuki M: A nudged chemistry-climate model simulation of chemical constituent distribution at northern high-latitude stratosphere observed by SMILES and MLS during the 2009/2010 stratospheric sudden warming, Journal of Geophysical Research: Atmospheres, 121, 1361–1380, 2016.
    1. Andrews DG, Holton JR, and Leovy CB: Middle atmosphere dynamics, 40, Academic press, 1987.
    1. Bais A, McKenzie R, Bernhard G, Aucamp P, Ilyas M, Madronich S, and Tourpali K: Ozone depletion and climate change: impacts on UV radiation, Photochemical & Photobiological Sciences, 14, 19–52, 2015. - PubMed
    1. Bais AF, Zerefos CS, Meleti C, Ziomas IC, and Tourpali K: Spectral measurements of solar UVB radiation and its relations to total ozone, SO2, and clouds, Journal of Geophysical Research: Atmospheres, 98, 5199–5204, 10.1029/92JD02904, 10.1029/92JD02904,1993. - DOI - DOI
    1. Bais AF, Tourpali K, Kazantzidis A, Akiyoshi H, Bekki S, Braesicke P, Chipperfield MP, Dameris M, Eyring V, Garny H, and et al.: Projections of UV radiation changes in the 21st century: impact of ozone recovery and cloud effects, Atmospheric Chemistry and Physics, 11, 7533–7545, 10.5194/acp-11-7533-2011, 2011. - DOI

LinkOut - more resources