. 2019 Sep 15;11(9):5417-5437.
eCollection 2019.

Effect of local application of biphosphonates on improving peri-implant osseointegration in type-2 diabetic osteoporosis

Affiliations

Effect of local application of biphosphonates on improving peri-implant osseointegration in type-2 diabetic osteoporosis

Xiaoqian Ding et al. Am J Transl Res. .

Erratum in

Abstract

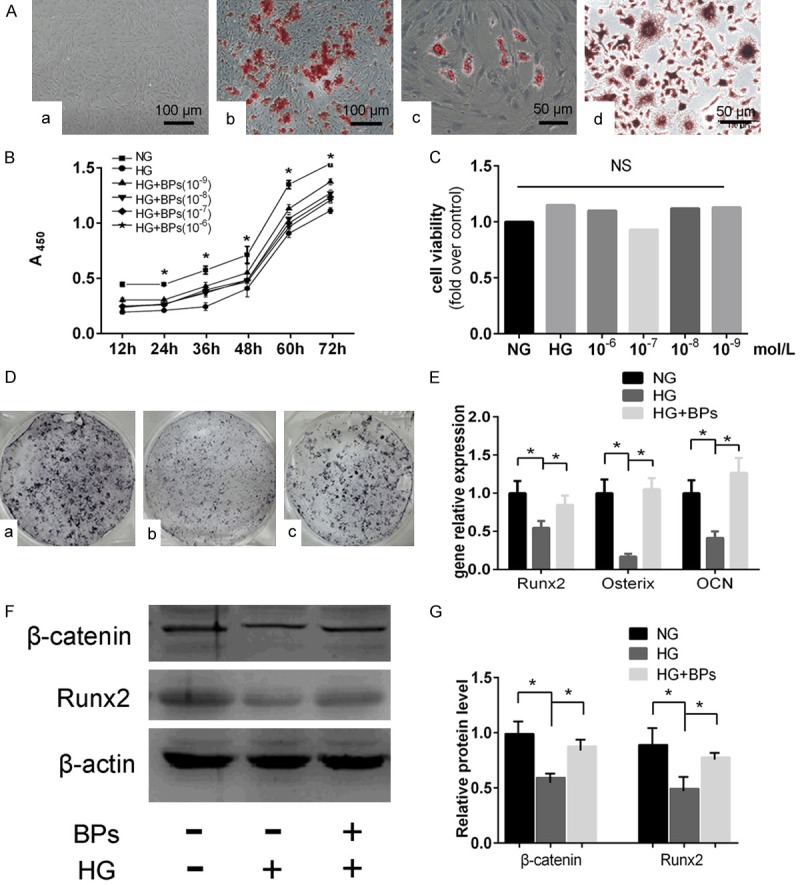
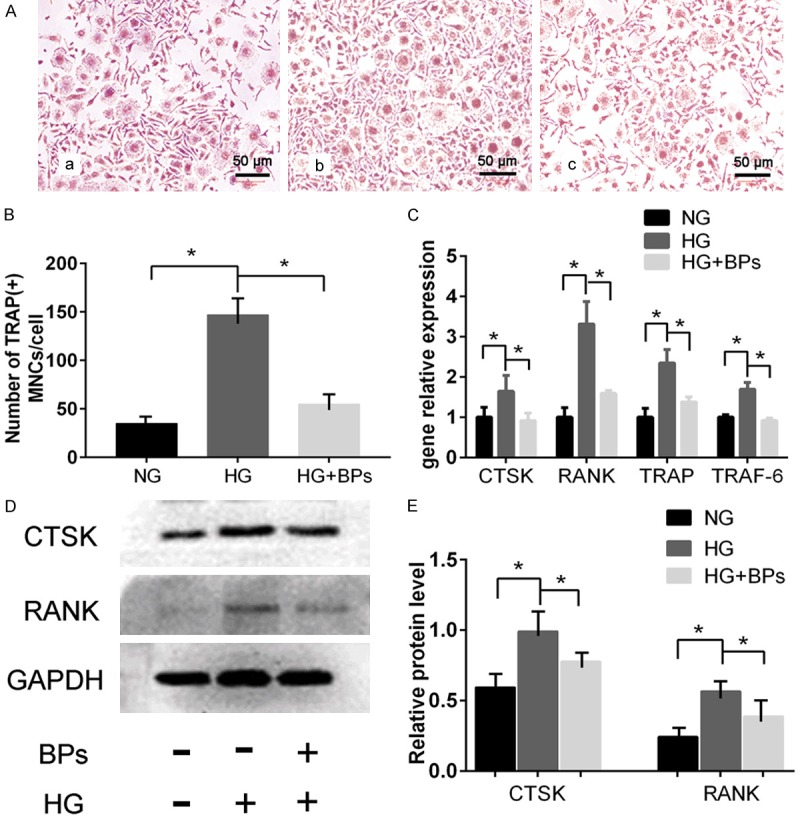
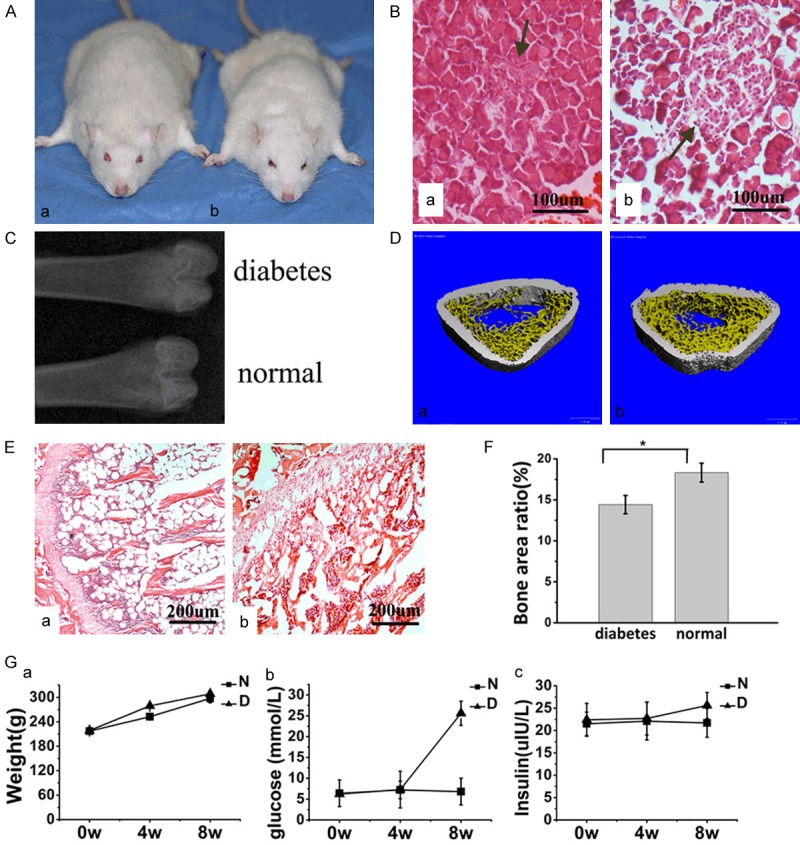
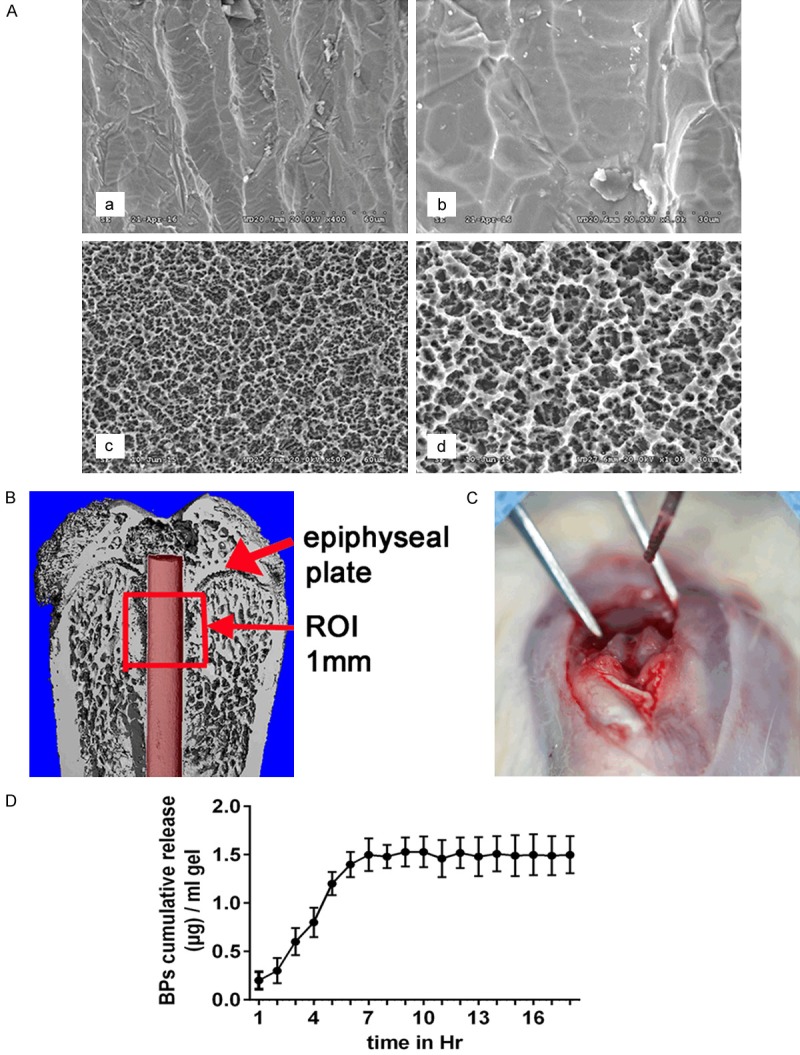
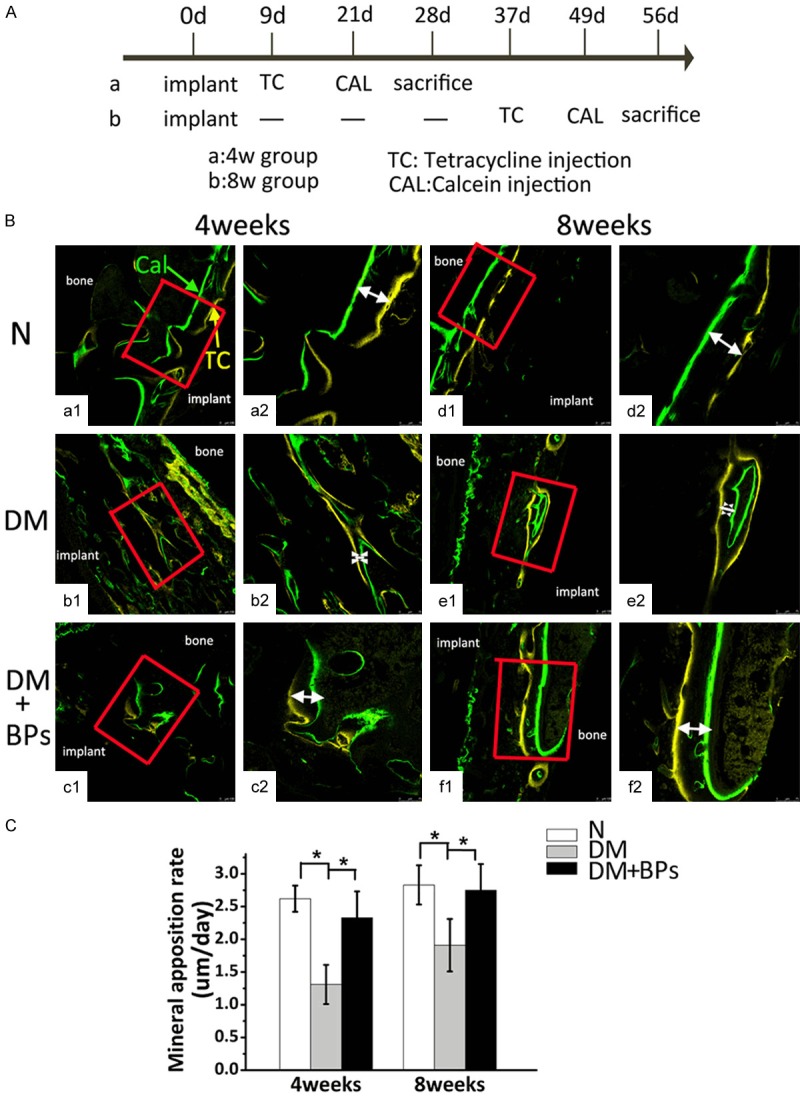
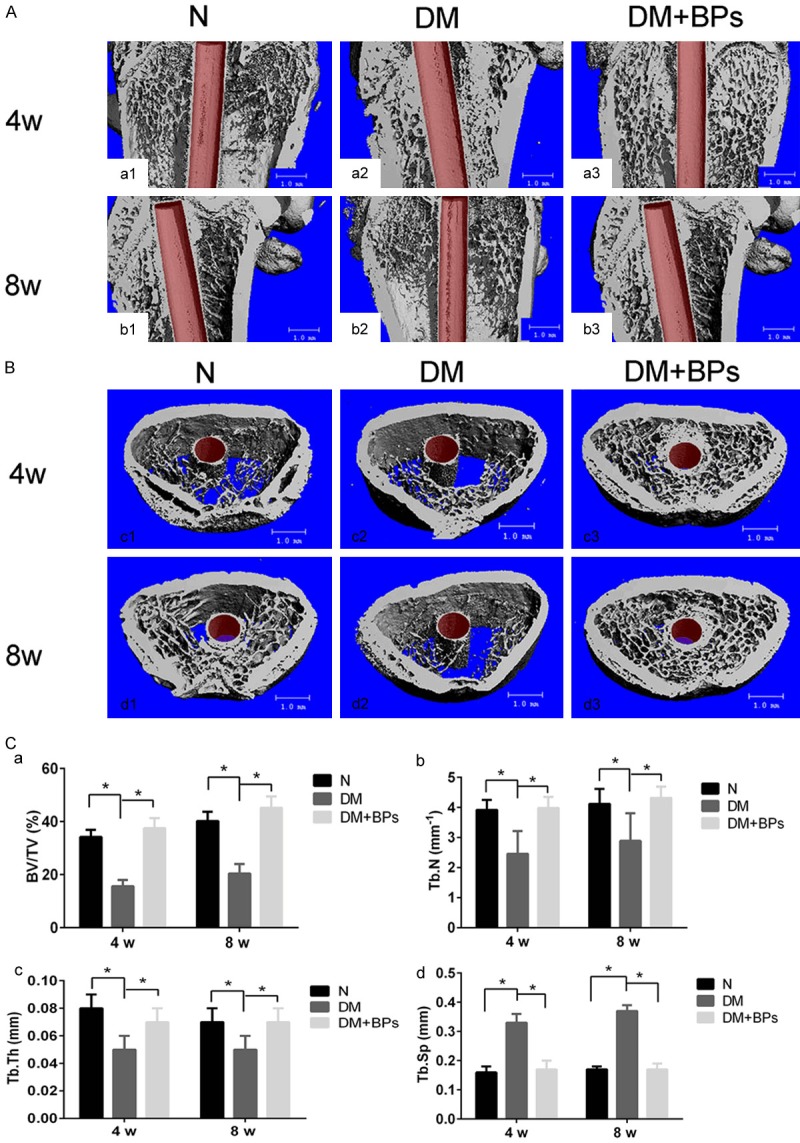
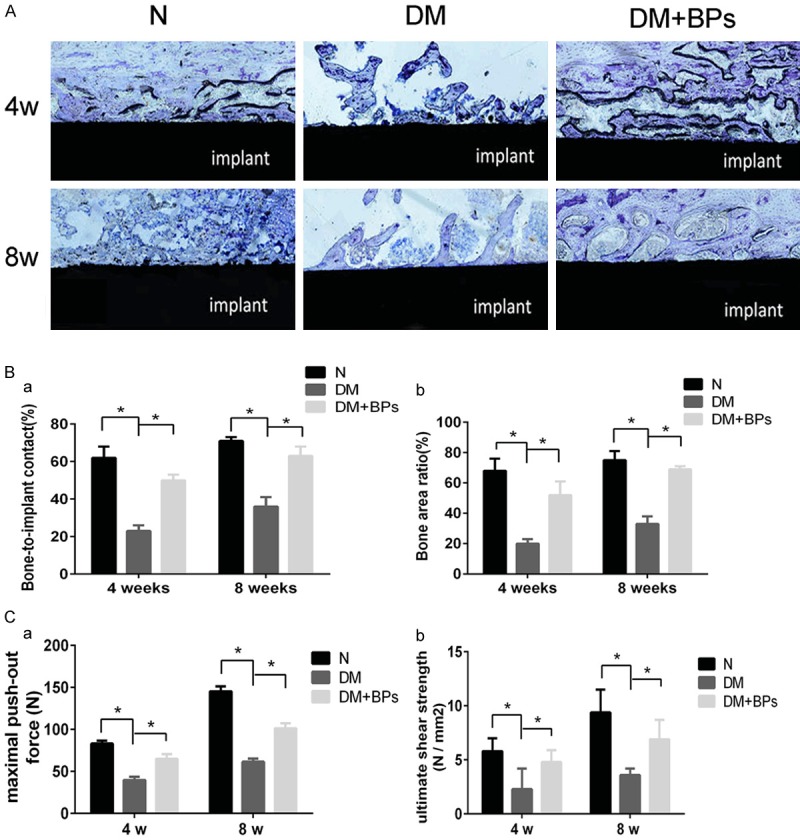
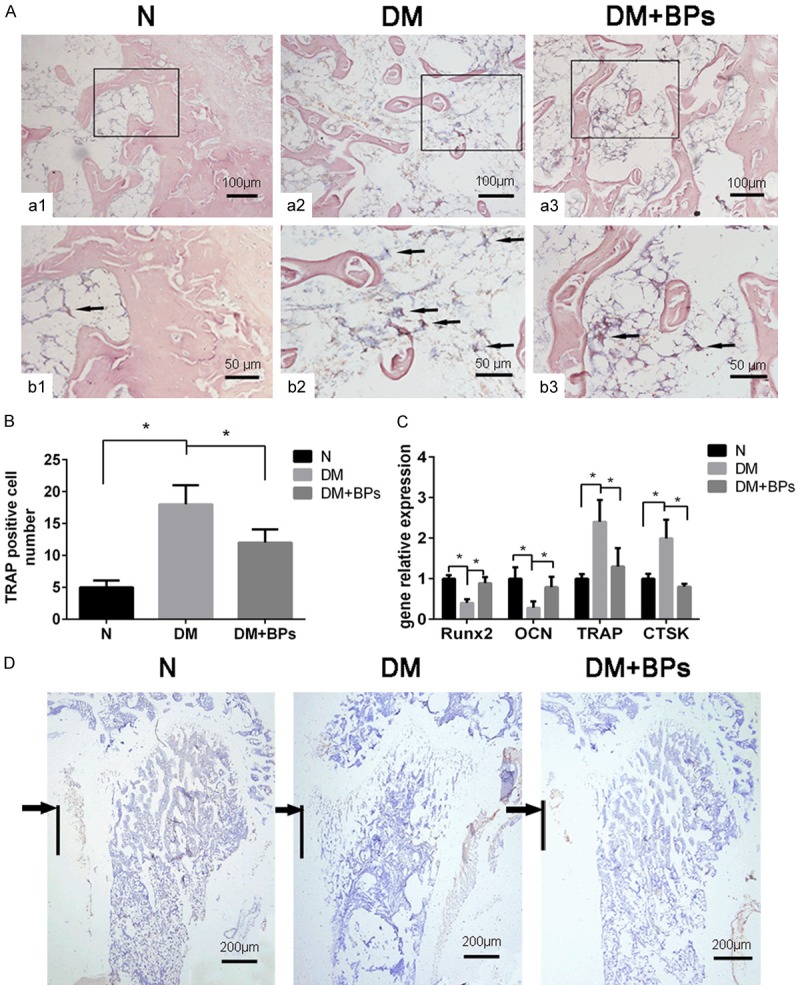
Type 2 diabetes mellitus (T2DM), a leading cause of osteoporosis, remains a contraindication for bone implant therapy. Although associated with side effects when systemically administered, biphosphonates (BPs) play a positive role in diabetic osteoporosis treatment. We hypothesized that local BP therapy would prevent decayed implant osseointegration under T2DM conditions. To assess cell proliferation and determine the optimal BP concentration, bone marrow-derived mesenchymal stem cells (BMSCs) and bone marrow macrophages (BMMs) were treated with BPs at various relatively low concentrations (10-9 mmol/L) for different periods of time. Our in vitro study results demonstrated that BP application reversed the process by which high glucose inhibits bone formation and stimulates bone resorption through osteoclast-specific gene and protein expression (P<0.05). In vivo, fat accumulation and insulin resistance were induced in T2DM rats. We used crosslinked hyaluronic acid as the drug delivery vehicle for BPs to ensure that BPs administered at a dose of 30 µg/kg could settle into the prepared hole in rats. Thereafter, implants were inserted into cylindrical holes of a specific size, created parallel to the long axis of the femora. The outcomes of the in vivo study revealed that BPs promoted bone formation, which reversed the reduction in the DM group according to double fluorescence labeling, micro-CT, biomechanical and histomorphometric analyses (P<0.05). Furthermore, intergroup comparisons revealed significant correlation coefficients (P<0.05) between the micro-CT and biomechanical parameters. Therefore, local administration of BPs could stimulation bone remodeling and represent an effective treatment strategy for preventing decayed implant osseointegration under T2DM conditions.

Keywords: Osteoporosis; bisphosphonates; implant; osseointegration; type 2 diabetes mellitus.


Conflict of interest statement

None.

Figures

Figure 1
Figure 1
Cell identification, concentration filtering and osteogenic differentiation of BMSCs in vitro. A, a. An image of cultured BMSCs grown in DMEM (original magnification *200). b. BMSCs differentiated into osteoblasts and stained with Alizarin red (original magnification *200). c. BMSCs differentiated into adipocytes and stained with Oil Red O (original magnification *400). d. BMMS differentiated into osteoclasts and stained with TRAP (original magnification *400). B. Assessment of cell proliferation and filtering of optimal concentration by CCK-8, NG: 5.5 mmol/L glucose, HG: 44 mmol/L glucose, HG+BPs: 44 mmol/L glucose with BPs of 10-6 mol/L, 10-7 mol/L, 10-8 mol/L, and 10-9 mol/L for 12 h, 24 h, 36 h, 48 h, and 72 h). Experiments were performed at least in triplicate, and the data are expressed as the mean ± SD (n=6). C. Assessment of cell viability of high glucose or BPs on osteoclast formation (NG: 5.5 mmol/L glucose, HG: 44 mmol/L glucose, HG+BPs: 44 mmol/L glucose with BPs of 10-6 mol/L, 10-7 mol/L, 10-8 mol/L, and 10-9 mol/L for 48 h culturing). Experiments were performed at least in triplicate, and the data are expressed as the mean ± SD (n=6). D. ALP staining for osteoblastogenesis of BMSCs affected by BPs. a. NG group: 5.5 mmol/L glucose. b. HG group 44 mmol/L glucose. c. HG+BPs: 44 mmol/L glucose + 10-9 mol/L BPs. E. Runx2, OCN and Osterix expression during osteogenesis. Experiments were performed at least in triplicate, and the data are expressed as the mean ± SD (n=3). *P<0.05. (by ANOVA); F, G. Runx2 and β-catenin protein were detected by Western blot. Experiments were performed at least in triplicate. These data are expressed as the mean ± SD (n=3). *P<0.05 (by ANOVA).
Figure 2
Figure 2
In vitro experiment of osteoclast differentiation of BMMs. BMMs in the BPs group were treated with RANKL and BPs at a concentration of 10-9 mmol/L for 7 days. A. TRAP staining for osteoclastogenesis of BMMs affected by BPs (original magnification *400). a. 5.5 mmol/L glucose. b. 44 mmol/L glucose. c. 44 mmol/L glucose + 10-9 mol/L BPs. B. Number of TRAP-positive multinucleated cells (MNCs) on day 6. Experiments were performed at least in triplicate, and the data are shown as the means ± SD (n=3). *P<0.05 (by ANOVA). C. TRAF-6, TRAP, RANK, and CTSK expression during osteoclastogenesis. Experiments were performed at least in triplicate. The data are expressed as the mean ± SD (n=3). *P<0.05 (by ANOVA). D, E. RANK and CTSK protein were detected by Western blot. The cells were induced by three different stimulators of osteoclastogenesis for 6 days. Experiments were performed at least in triplicate, and the data are expressed as the mean ± SD (n=3). *P<0.05 (by ANOVA).
Figure 3
Figure 3
Establishment of type-2 diabetic rat model. A, a. Diabetic rat. b. Normal rat. General morphology of the rats. B, a. Diabetic rat. b. Normal rat. Histological staining of sections of the pancreas (HE staining, original magnification *200). The area of pancreatic islets was markedly reduced, and β-cells appeared to exhibit marked injury in T2DM rats. Decreased bone mass and impaired trabecular microarchitectures were evaluated by X-ray, histological images and micro-CT in T2DM rats. C. X-ray of the proximal femora through the longitudinal plane. D, a. Diabetic rat. b. Normal rat. Micro-CT of the distal femora through the transversal plane. E, a. Diabetic rat. b. Normal rat. Histological sections of the distal femora through the transverse plane (HE staining, original magnification *100). F. Statistical results of BA according to histomorphometry. Experiments were performed in at least triplicate. Data are expressed as the mean ± SD (n=2). *P<0.05 (by ANOVA). Experiments were performed at least in triplicate. G. The changes in body weight, glucose level, and insulin level between the two groups tended to reveal more remarkable changes in glucose levels in the DM group than in the N group. Among the rats after STZ injection, there were no significant differences in body weight or insulin levels between the DM and N groups. Experiments were performed at least in triplicate. The data are expressed as the mean ± SD (n=2). *P<0.05 (by ANOVA).
Figure 4
Figure 4
Implant surgery and the mode of BP release. A. Surface morphology of implants observed using a scanning electron microscope (SEM). a, b. Without grit-blasting and etching. c, d. With grit-blasting and etching). B. Schematic of the region of interest (ROI) in the micro-CT evaluation. The defined ROI was identified as the total trabecular section around the implant with a radius of 500 µm from the first slice to the growth plate and then to the distal 100 slices. C. Prepared implant hole. The implants were inserted into the holes created parallel to the long axis of the femora. D. The cumulative amount of BPs released from 1 mg of crosslinked hyaluronic acid in the gel. The BPs showed relatively rapid release in the first 7 h, continued by a steady release phase.
Figure 5
Figure 5
Results of the double fluorescence labeling analysis. (A) Timeline for the experiment. The femoral specimens of 10 rats from each group (n=20 per group: N, DM, DM+BPs) were harvested at 4 weeks, and the remaining specimens were harvested at 8 weeks. (B) Double fluorescence labeling image scanning was performed by confocal laser scanning microscopy (a1-f1, magnification *100; a2-f2, magnification *200). Double labeling lines, including yellow (representing tetracycline staining) and green (representing calcein staining), could be observed in the peri-implant bone in each group by confocal laser scanning. The white arrows indicate the distance between the two lines. (C) MAR values after 4 weeks and 8 weeks in the N, DM, and DM+BPs groups. Experiments were performed at least in triplicate. The data are expressed as the mean ± SD (n=3). *P<0.05 (by ANOVA).
Figure 6
Figure 6
Micro-CT images of femora with implants. A, B. Micro-CT images of the ROI. The bone-implant interface and the trabecular microstructure of the peri-implant bone tissue among the three groups were analyzed by micro-CT. C. Statistical results of BV/TV, Tb.Th, Tb.N and Tb.Sp according to micro-CT at 4 weeks and 8 weeks after implant insertion in the N, DM and DM+BPs groups, respectively. Experiments were performed at least in triplicate. The data are expressed as the mean ± SD (n=3). *P<0.05 (by ANOVA).
Figure 7
Figure 7
Results of histological evaluation and biomechanical test analysis. (A) Toluidine staining. All histological sections are located approximately 1 mm below the epiphyseal plate of the femora. (B, a, b) Statistical results of BIC (a) and BA (b) according to histomorphometry. Experiments were performed at least in triplicate, and the data are expressed as the mean ± SD (n=3). *P<0.05 (by ANOVA). (C, a, b) Statistical results of the maximal push-out force and the ultimate shear strength according to biomechanical testing at 4 weeks and 8 weeks after implant insertion. Experiments were performed at least in triplicate, and the data are expressed as the mean ± SD (n=3). *P<0.05 (by ANOVA).
Figure 8
Figure 8
Results of relevant gene expression, histology and immunohistochemistry examinations. (A, a1-a3) TRAP staining of sections derived from the ROI of the femora (original magnification *200). (b1-b3) Higher power fields of the black box areas in (a1-a3) (original magnification *400). (B) The number of TRAP-positive multinucleated cells (MNCs) is shown as the mean ± SD (n=3). *P<0.05. (C) Runx2, OCN, TRAP and CTSK expression extracted from the femora of mice. Experiments were performed in at least triplicate. Data are expressed as the mean ± SD (n=3). *P<0.05 (by ANOVA). (D) Immunohistochemistry examinations of OCN. All sections are derived from the ROI of the femora (original magnification *100). The black arrows indicate the segments around the implant. The black line denotes the region of the original implant placement.

References

    1. Jackson RD, Mysiw WJ. Insights into the epidemiology of postmenopausal osteoporosis: the women’s Health Initiative. Semin Reprod Med. 2014;32:454–462. - PubMed
    1. Bonds DE, Larson JC, Schwartz AV, Strotmeyer ES, Robbins J, Rodriguez BL, Johnson KC, Margolis KL. Risk of fracture in women with type 2 diabetes: the women’s health initiative observational study. J Clin Endocrinol Metab. 2006;91:3404–3410. - PubMed
    1. Kanazawa I, Takeno A, Tanaka KI, Yamane Y, Sugimoto T. Osteoporosis and vertebral fracture are associated with deterioration of activities of daily living and quality of life in patients with type 2 diabetes mellitus. J Bone Miner Metab. 2019;37:503–511. - PubMed
    1. Vestergaard P. Discrepancies in bone mineral density and fracture risk in patients with type 1 and type 2 diabetes-a meta-analysis. Osteoporos Int. 2007;18:427–444. - PubMed
    1. Chen FP, Kuo SF, Lin YC, Fan CM, Chen JF. Status of bone strength and factors associated with vertebral fracture in postmenopausal women with type 2 diabetes. Menopause. 2019;26:182–188. - PubMed

LinkOut - more resources