. 2019 Sep 15;11(9):5438-5456.
eCollection 2019.

High expression of long non-coding RNA NNT-AS1 facilitates progression of cholangiocarcinoma through promoting epithelial-mesenchymal transition

Affiliations

High expression of long non-coding RNA NNT-AS1 facilitates progression of cholangiocarcinoma through promoting epithelial-mesenchymal transition

Yulei Gu et al. Am J Transl Res. .

Abstract

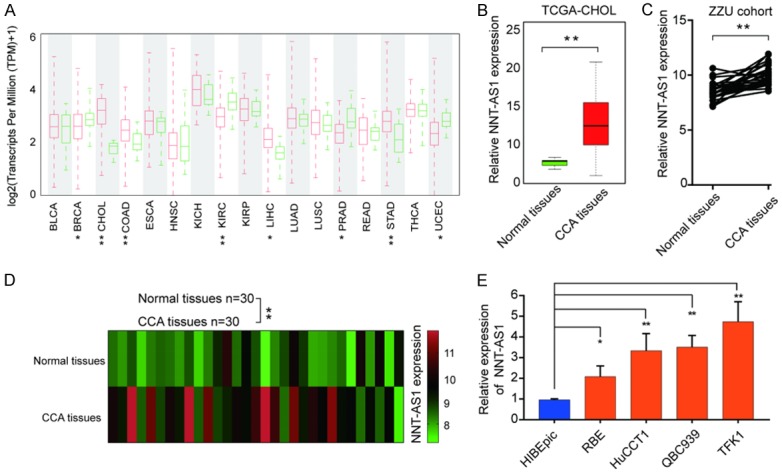
Background: Cholangiocarcinoma (CCA) is a biliary malignancy, which is notoriously difficult to diagnose and associated with poor survival. Accumulating evidence indicates that long non-coding RNA Nicotinamide Nucleotide Transhydrogenase-antisense RNA1 (NNT-AS1) is overexpressed in several tumors and plays a crucial role in the development of neoplasm. However, the expression pattern and functional role of NNT-AS1 in CCA remain largely unknown.

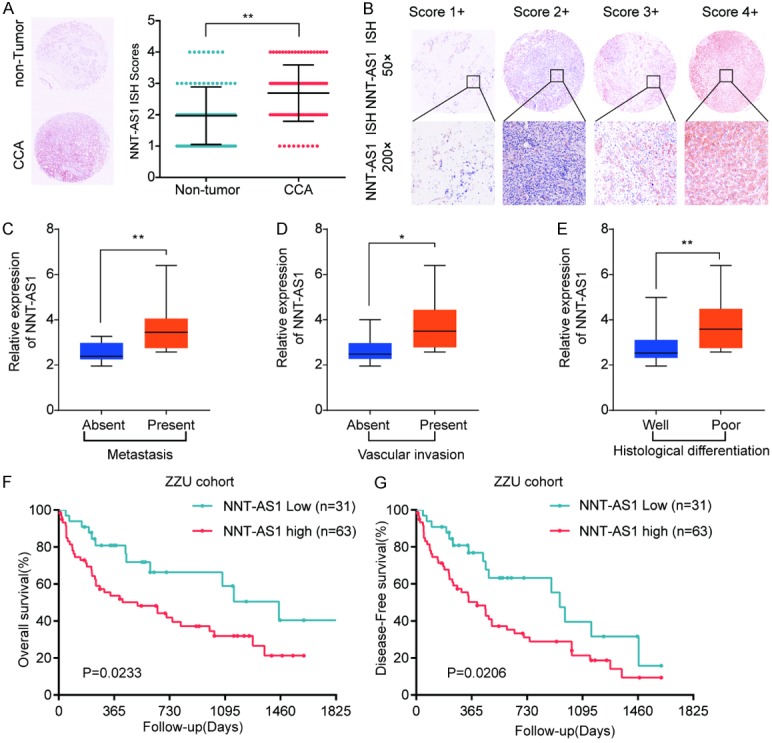
Methods: NNT-AS1 expression was assessed by RT-qPCR and In Situ Hybridization (ISH) assay. The clinical relevance of NNT-AS1 was analyzed using a CCA tissue microarray with follow-up data. The function role of NNT-AS1 and its underlying molecular mechanisms were evaluated using both in vitro/in vivo experiments and bioinformatics analysis. Luciferase reporter assay, western blot and RT-qPCR were conducted to identify the miRNA/target gene involved in the regulation of CCA progression.

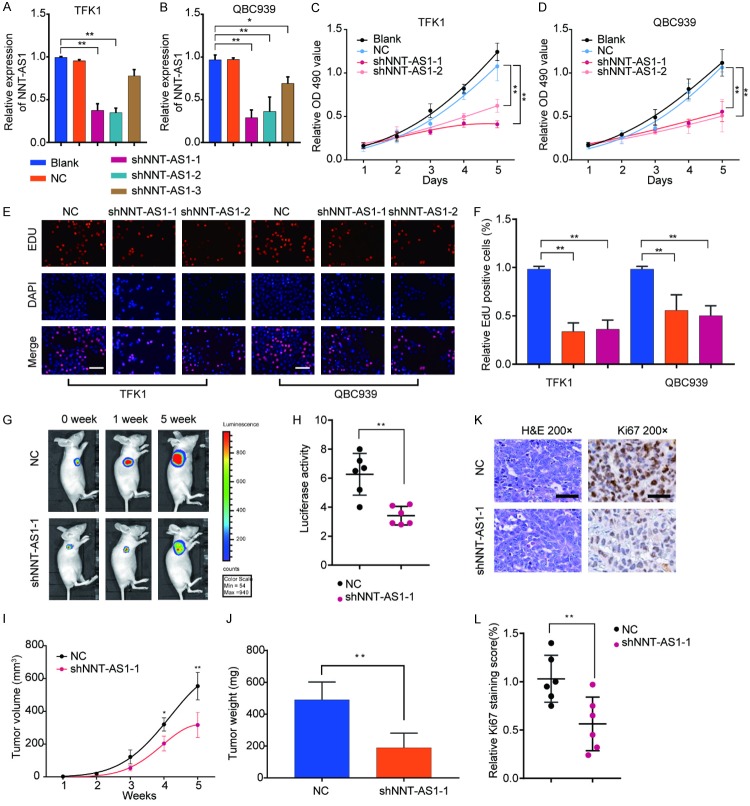
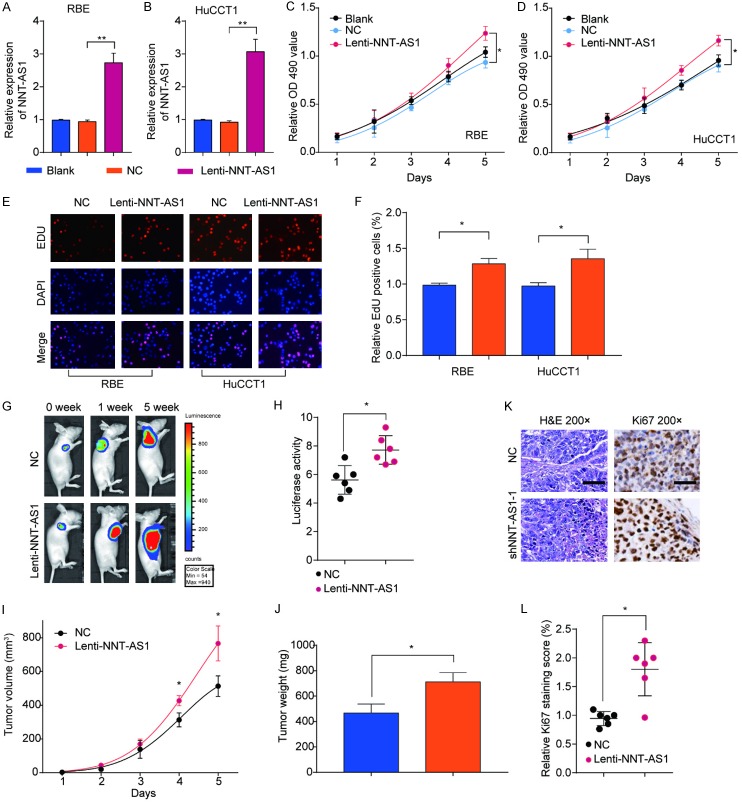
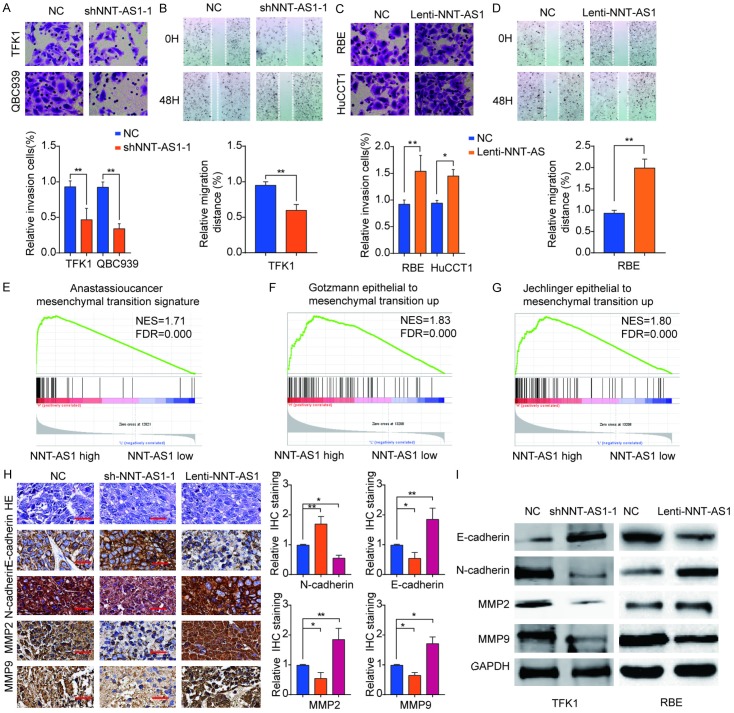
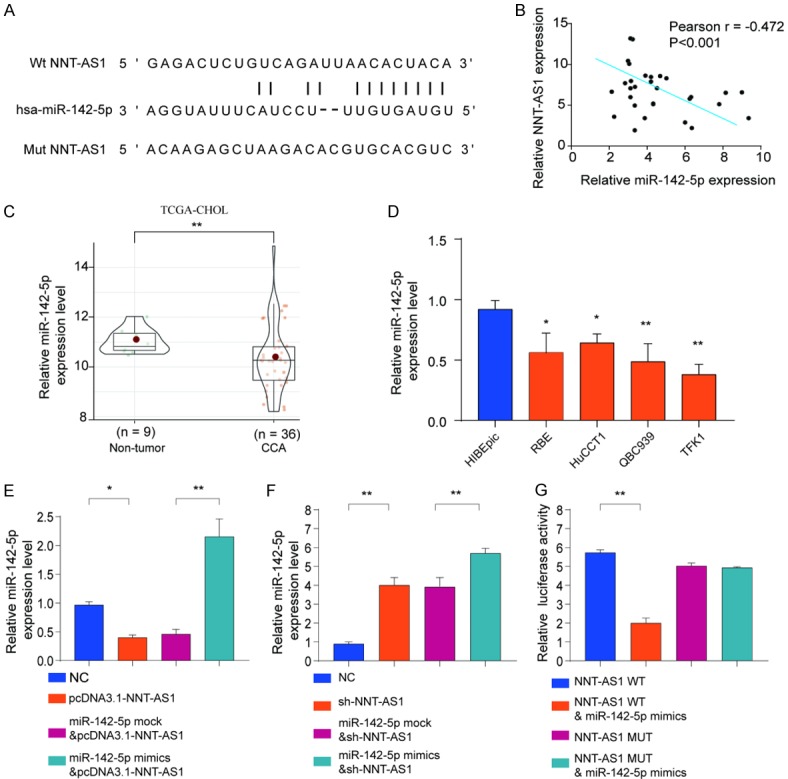
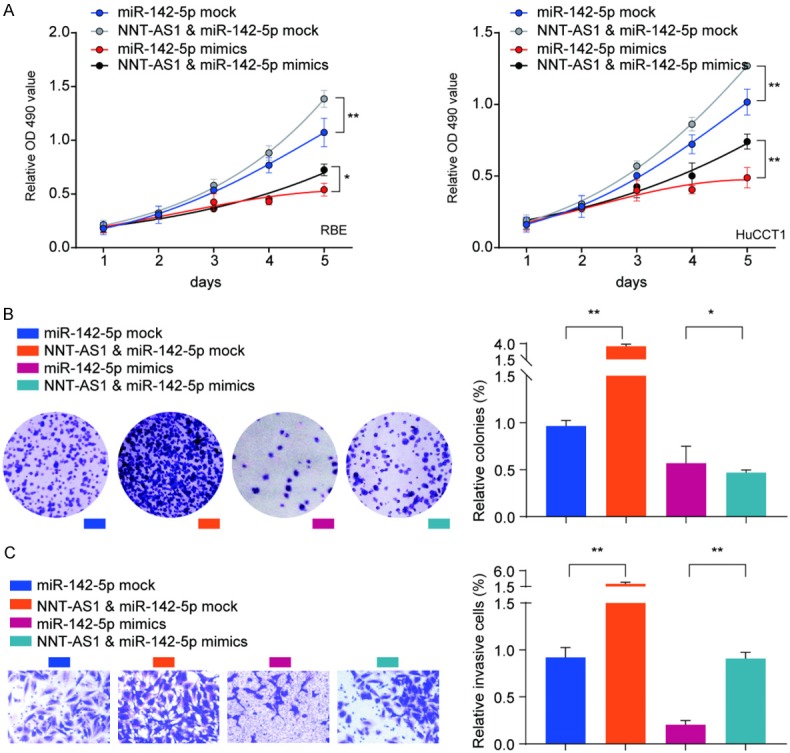
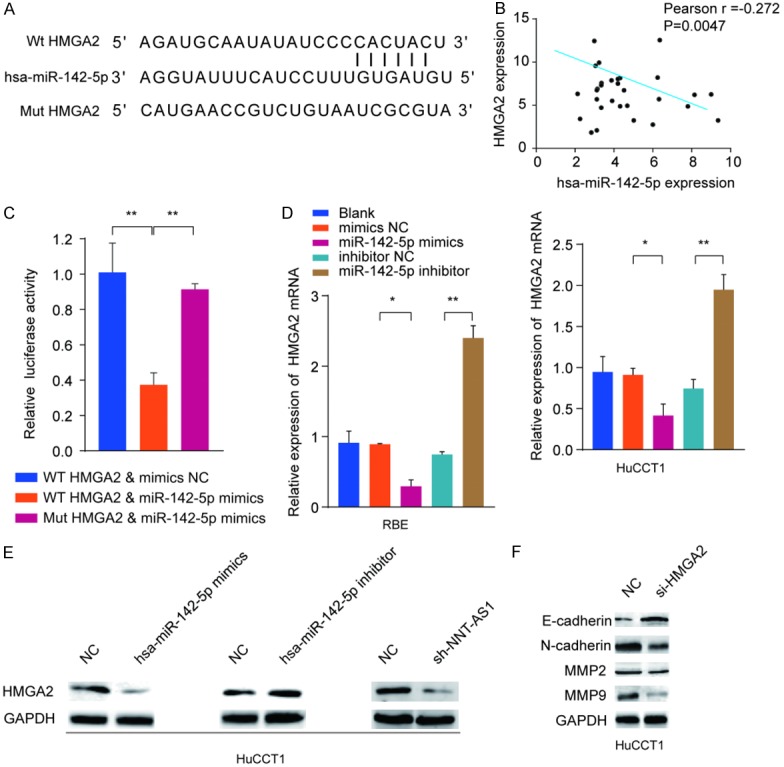
Results: LncRNA NNT-AS1 was found highly expressed in CCA. Upregulated NNT-AS1 expression was tightly associated with clinical malignancies and predicted poor prognosis of CCA patients. Functional studies showed that NNT-AS1 knockdown inhibited cell proliferation, migration and invasion of CCA cells in vitro. Conversely, NNT-AS1 overexpression showed the opposite biological effects. In a tumor xenograft model, we confirmed that NNT-AS1 knockdown could significantly inhibit the growth of CCA, while NNT-AS1 overexpression promoted CCA development. Mechanistically, we demonstrated that NNT-AS1 might function as a ceRNA in regulating HMGA2 (high mobility group AT-hook 2) through competitively binding to miR-142-5p in CCA. Moreover, we showed that NNT-AS1 regulated epithelial-mesenchymal transition in CCA.

Conclusion: In summary, these findings suggest the potential prognostic and therapeutic value of NNT-AS1/miR-142-5p/HMGA2 axis in CCA patients.

Keywords: NNT-AS1; cholangiocarcinoma; epithelial-mesenchymal transition; proliferation; tumor progression.


Conflict of interest statement

None.

Figures

Figure 1
Figure 1
LncRNA NNT-AS1 is upregulated in human CCA tissues and cell lines. A. Analysis of NNT-AS1 expression in TCGA database. B. Analysis of NNT-AS1 expression level in normal tissues and CCA tissues in TCGA-CHOL. Bars represent median NNT-AS1 level. C, D. Analysis of NNT-AS1 expression in 20-paired normal tissues and CCA tissues. E. Expression level of NNT-AS1 in normal intrahepatic biliary epithelial and CCA cell lines. *P<0.05, **P<0.01, Mean ± SD, unpaired Student’s t-test.
Figure 2
Figure 2
High expression of NNT-AS1 is positively associated with clinical malignant and poor prognosis in CCA patients. A. Representative ISH staining of NNT-AS1 (left panel) and the quantification of NNT-AS1 ISH staining scores in CCA tissues and corresponding non-tumor tissues. B. Representative pictures of NNT-AS1 expression with different staining scores in CCA tissues. C-E. Analysis the association between NNT-AS1 expression and metastasis, vascular invasion and histological differentiation. F, G. The overall survival and disease free survival were analyzed by Kaplan-Meier analysis, according to NNT-AS1 expression levels. *P<0.05, **P<0.01, Mean ± SD, unpaired Student’s t-test or Kaplan Meier analysis.
Figure 3
Figure 3
Knockdown of NNT-AS1 suppresses cell proliferation of CCA both in vitro and in vivo. TFK1 or QBC939 cells were transfected with shRNA1/2/3 targeting NNT-AS1, respectively. A, B. The NNT-AS1 knockdown efficiency was determined by RT-qPCR. C, D. CCK-8 assay was performed to determine the viability of sh-NNT-AS1-1/2-transfected TFK1 or QBC939 cells at indicated time points. E, F. EdU staining assay were performed to determine the growth of sh- NNT-AS1-1/2-transfected TFK1 or QBC939 cells. TFK1 cells stably transfected with sh-NNT-AS1-1 or negative control (NC) were implanted into nude mice. Xenograft tumor was monitored for 5 weeks. G, H. Luciferase signal in the NC or sh-NNT-AS1-1 group was determined at indicated time points. I, J. Tumor growth and tumor volume were analyzed at indicated time points. Mice were euthanized and tumor tissues were extracted at week 5. Tumor weight was measured. Values are the mean ± SD (n=6/group). K, L. H&E and Ki67 IHC staining of xenograft tumors tissues from NC or sh-NNT-AS1-1 group. Mean ± SD, *P<0.05, **P<0.01, unpaired Student’s t-test or one-way ANNOVA followed by multiple t-test. Representative images and data are based on three independent experiments.
Figure 4
Figure 4
Overexpression of NNT-AS1 promotes cell proliferation of CCA both in vitro and in vivo. RBE or HuCCT1 cells were transfected with Lenti-NNT-AS1 or negative control (NC). A, B. NNT-AS1 expression in RBE or HuCCT1 cells was analyzed by RT-qPCR. C, D. CCK-8 assay was performed to assess the viability of RBE cells and HuCCT1 cells after NNT-AS1 overexpression. E, F. EdU staining assay was performed to determine the growth of RBE cells and HuCCT1 cells. RBE cells stably transfected with Lenti-NNT-AS1 or negative control (NC) were implanted into nude mice. Xenograft tumor was monitored for 5 weeks. G, H. Luciferase signal in the NC or Lenti-NNT-AS1 group was determined at indicated time points. I, J. Tumor growth and tumor volume were analyzed at indicated time points. Mice were euthanized and tumor tissues were extracted at week 5. Tumor weight was measured. Values are the mean ± SD (n=6/group). K, L. H&E and Ki67 IHC staining of xenograft tumors tissues from NC or Lenti-NNT-AS1 group. Mean ± SD, *P<0.05, **P<0.01, unpaired Student’s t-test or one-way ANNOVA followed by multiple t-test. Representative images and data are based on three independent experiments.
Figure 5
Figure 5
NNT-AS1 promotes CCA cell invasion and migration via promoting EMT. A. TFK1 or QBC939 cells were transfected with shNNT-AS1-1 or negative control (NC). Transwell assay was performed to evaluate the cell invasion. B. TFK cells were transfected with shNNT-AS1-1 or NC. Wound-healing assay was conducted to evaluate the cell migration capability. C. RBE or HuCCT1 cells were transfected with Lenti-NNT-AS1-1 or NC. Transwell assay was performed to evaluate the cell invasion. D. RBE cells were transfected with Lenti-NNT-AS1-1 or NC. Wound-healing assay was conducted to evaluate the cell migration capability. E-G. Gene Set Enrichment Analysis indicated a significant correlation between NNT-AS1 expression and EMT. H. Western blot analysis of E-cadherin, N-cadherin, MMP2 and MMP9 in TFK1 cells transfected with shNNT-AS1-1 or NC, or in RBE cells transfected with Lenti-NNT-AS1 or NC. I. IHC staining analysis of E-cadherin, N-cadherin, MMP2 and MMP9 in tumor tissues from NNT-AS1 silencing or overexpression group. Scale bar, 100 μm. Mean ± SD, *P<0.05, **P<0.01, unpaired Student’s t-test. Representative images and data are based on three independent experiments.
Figure 6
Figure 6
NNT-AS1 directly interacts with miR-142-5p as miRNA sponge. (A) Diagram of the putative binding sites of miR-142-5p on NNT-AS1 (WT) and the mutated sequences of NNT-AS1 (Mut). (B) Pearson correlation analysis of NNT-AS1 expression and miR-142-5p expression in CCA tissues. (C) The expression levels of miR-142-5p in CCA tissues and normal control tissues were analyzed based on TCGA. (D) The expression levels of miR-142-5p in CCA cell lines (RBE, HuCCT1, QBC939 and TFK1) and nonmalignant cell line HIBEpic were analyzed by qRT-PCR. (E, F) HEK293 cells were transfected with negative control (NC), pcDNA3.1-NNT-AS1, miR-142-5p mock, or miR-142-5p mimics and the expression of miR-142-5p (D) or NNT-AS1 (E) was analyzed by qRT-PCR. (G) The WT or mutated NNT-AS1 was fused to the luciferase-coding region and co-transfected into HEK293T cells with miR-142-5p mimics. Relative luciferase activity was determined 48 h after transfection. Data are presented as mean ± SD; Student’s t-test, *P<0.05 and **P<0.01. Pearson analysis was used to calculate the correlation between the expression of NNT-AS1 and miR-142-5p.
Figure 7
Figure 7
Overexpression of NNT-AS1 partially reverses the suppressive effect of miR-142-5p in CCA cells. RBE or HuCCT1 cells were transfected with miR-142-5p mock or miR-142-5p mimics, with or without NNT-AS1 overexpression vector. A. Cell proliferation of RBE or HuCCT1 was analyzed at indicated time points by CCK-8 kit. B, C. Colony formation and cell invasion of RBE cells were analyzed by colony formation assay and transwell assay, respectively. Data are presented as the mean ± SD; Using the Student’s t-test for statistical analysis. *P<0.05 and **P<0.01.
Figure 8
Figure 8
MiR-142-5p negatively regulates High Mobility Group AT-Hook 2 (HMGA2) expression by targeting 3’-UTR of HMGA2. A. Graphical representation of the potential binding sites between miR-142-5p and HMGA2. B. Correlation between HMGA2 and miR-142-5p was analyzed by Pearson’s correlation curve. C. Luciferase reporter assay was performed and the relative luciferase activity was tested after co-transfection with HMGA2 wide type, HMGA2 mutant type and miR-142-5p mimic. D, E. RBE or HuCCT1 cells were transfected with miR-142-5p mimics, inhibitor or negative controls. The mRNA and protein expression levels of HMGA2 were analyzed by RT-qPCR and western blot. F. Western blot analysis of E-cadherin, N-cadherin, MMP2 and MMP9 in HuCCT1 cells treated with siRNA targeting HMGA2 or negative group. Mean ± SD, *P<0.05 and **P<0.01, unpaired Student’s t-test. Representative images and data are based on three independent experiments.

Similar articles

Cited by

References

    1. Shin HR, Oh JK, Masuyer E, Curado MP, Bouvard V, Fang YY, Wiangnon S, Sripa B, Hong ST. Epidemiology of cholangiocarcinoma: an update focusing on risk factors. Cancer Sci. 2010;101:579–585. - PMC - PubMed
    1. Rizvi S, Gores GJ. Pathogenesis, diagnosis, and management of cholangiocarcinoma. Gastroenterology. 2013;145:1215–1229. - PMC - PubMed
    1. Alberts SR, Gores GJ, Kim GP, Roberts LR, Kendrick ML, Rosen CB, Chari ST, Martenson JA. Treatment options for hepatobiliary and pancreatic cancer. Mayo Clin Proc. 2007;82:628–637. - PubMed
    1. Djebali S, Davis CA, Merkel A, Dobin A, Lassmann T, Mortazavi AM, Tanzer A, Lagarde J, Lin W, Schlesinger F. Landscape of transcription in human cells. Nature. 2012;489:101. - PMC - PubMed
    1. Evans JR, Feng FY, Chinnaiyan AM. The bright side of dark matter: lncRNAs in cancer. J Clin Invest. 2016;126:2775–82. - PMC - PubMed

LinkOut - more resources