Meta-Analysis
. 2019 Oct 11;5(1):30.
doi: 10.1038/s41522-019-0103-8. eCollection 2019.

Individualized recovery of gut microbial strains post antibiotics

Affiliations
Meta-Analysis

Individualized recovery of gut microbial strains post antibiotics

Hyunmin Koo et al. NPJ Biofilms Microbiomes. .

Abstract

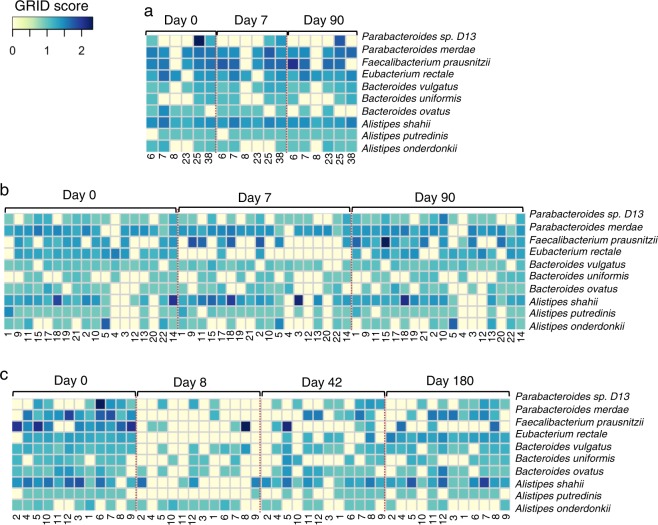
To further understand the impact of antibiotics on the gastrointestinal tract microbial community, the intra-individual recovery pattern of specific microbial strains was determined using metagenomic sequencing coupled with strain-tracking analyses. In a study where 18 individuals were administered a single antibiotic (cefprozil), new microbial genomic variants (herein strains) were transiently detected in 15 individuals, while in a second study that used a cocktail of three antibiotics (meropenem, gentamicin, and vancomycin), all 12 participants had either permanent or transient strain changes. The presence of distinct microbial genomic variants indicates a pattern of strain recovery that is intra-individual specific following disruption of the human gastrointestinal tract with antibiotics.

Keywords: Metagenomics; Microbiome.


Conflict of interest statement

Competing interestsThe authors declare no competing interests.

Figures

Fig. 1
Fig. 1
Summarized WSS scores. The top 10 species that were abundant across all individuals (n = 36) from the three data sets (control and single antibiotic data sets from Raymond et al., and multiple antibiotics data set from Palleja et al.) were selected to compare the WSS scores between every possible pair of samples per each individual. a The boxplots show the fraction of the top 10 species of each data set (C = control, S = single antibiotic, and M = multiple antibiotics) that fall into the respective color box group indicated by the horizontal color-coded bars (colors described in the main text). Values from the red and blue color box groups were merged to represent a single boxplot per each data set. The boxplots display a median (a yellow triangle), a mean (a red asterisk), interquartile range boxes. Each dot in the boxplot represents a value observed per individual in each data set, and the whiskers of the box are extended to the lowest and highest value observed in each data set. Significant differences (P value <0.05) between each data set were tested using an ANOVA followed by Tukey’s multiple-comparisons post hoc tests in R (version 3.5.1), and represented as a black asterisk above the boxplot; *P value <0.05, **P value <0.01, ***P value <0.001, n.s. = not significant (see Supplementary Data 1 for detailed values). b, c The summarized WSS scores of the top 10 species per individual from b, single antibiotic, and c multiple antibiotics data set were grouped into different color boxes (colors described in the main text). Each column in the table represents an individual and matches to the number shown in the Supplementary Data 1. WSS scores for all identified species are provided in Supplementary Data 1, and the summarized WSS scores for the control data set shown in the Supplementary Fig. 4. Additional strain profiling analysis was conducted for B. uniformis from individual #19 from Raymond et al. and for B. vulgatus from individual #3 and #11 from Palleja et al. (red outlined boxes; result from this analysis shown in Fig. 2)
Fig. 2
Fig. 2
Strain profiling using Integrative Genomics Viewer and StrainPhlAn. The SNV patterns of the microbial genomic variants shown through Integrative Genomics Viewer (IGV) were randomly selected from a high-density SNV region (1000 base pairs length). a Individual #19 from Raymond et al. was selected to show the SNV patterns of the genomic variant against the reference sequence of B. uniformis at each time point. c Individual #3 and e Individual #11 were selected from Palleja et al. to show the SNV patterns of their genomic variants against the reference sequence of B. vulgatus at each time point. b, d, f For each selected individual, StrainPhlAn analysis was conducted. DNA sequences from species-specific marker genes were aligned and used to construct a neighbor-joining tree based on percentage identity (PID) distance between the marker genes through Jalview. The numbers at joining nodes indicate a PID. The tree is drawn to scale bar unit (0.1) displayed below the tree
Fig. 3
Fig. 3
Microbe replication. Heatmap representing the Growth Rate InDex (GRiD) scores for the top 10 species that were abundant across all individuals (n = 36) determined at each time point for all individuals from the three data sets; a control and b single antibiotic data sets from Raymond et al., and c multiple antibiotics data set from Palleja et al. The heatmap was generated using the heatmap.2 function in R (version 3.5.1). Each number shown below the heatmap corresponds to the individual listed in Supplementary Data 1. The larger GRiD scores indicate a higher growth rate represented in dark blue, and the smaller GRiD scores represent a lower growth rate shown in light yellow (values <1.5 generally slow-growing microbes). GRiD scores for all identified bacterial genomes as well as common species across all data sets were elaborated in Supplementary Data 1 and Supplementary Fig. 6, respectively. Significant differences (P value < 0.05) of the GRiD scores of the top 10 species between different time points, particularly Day 0 vs. the last day of the post-treatment sample in each data set were tested using an ANOVA followed by Tukey’s multiple-comparisons post hoc tests in R (version 3.5.1), showing no significant differences (P value >0.05) between Day 0 and Day 90 in both the control and single antibiotic data sets (see detailed values in Supplementary Data 1). Similarly, the multiple antibiotics data set showed no significant differences (P value >0.05) between Day 0 and Day 180 for the majority of species (9 out of 10 species; see detailed values in Supplementary Data 1)

References

    1. Jernberg C, Lofmark S, Edlund C, Jansson JK. Long-term ecological impacts of antibiotic administration on the human intestinal microbiota. ISME J. 2007;1:56–66. doi: 10.1038/ismej.2007.3. - DOI - PubMed
    1. Becattini S, Taur Y, Pamer EG. Antibiotic-induced changes in the intestinal microbiota and disease. Trends Mol. Med. 2016;22:458–478. doi: 10.1016/j.molmed.2016.04.003. - DOI - PMC - PubMed
    1. Dethlefsen L, Huse S, Sogin ML, Relman DA. The pervasive effects of an antibiotic on the human gut microbiota, as revealed by deep 16S rRNA sequencing. PLoS Biol. 2008;6:e280. doi: 10.1371/journal.pbio.0060280. - DOI - PMC - PubMed
    1. Rashid MU. Determining the long-term effect of antibiotic administration on the human normal intestinal microbiota using culture and pyrosequencing methods. Clin. Infect. Dis. 2015;60:S77–S84. doi: 10.1093/cid/civ137. - DOI - PubMed
    1. Segata, N. On the road to strain-resolved comparative metagenomics. mSystems3, 10.1128/mSystems.00190-17 (2018). - PMC - PubMed

Publication types

MeSH terms

Substances