. 2019 Oct 10:2:370.
doi: 10.1038/s42003-019-0611-3. eCollection 2019.

An improved neuroanatomical model of the default-mode network reconciles previous neuroimaging and neuropathological findings

Affiliations

An improved neuroanatomical model of the default-mode network reconciles previous neuroimaging and neuropathological findings

Pedro Nascimento Alves et al. Commun Biol. .

Abstract

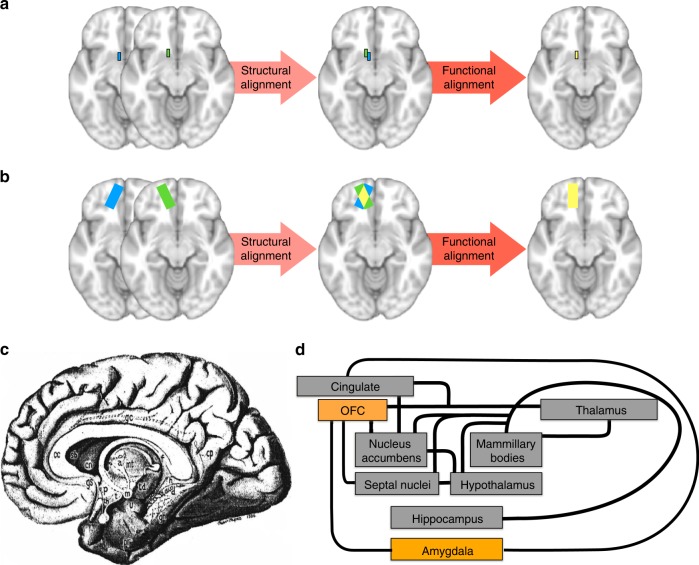
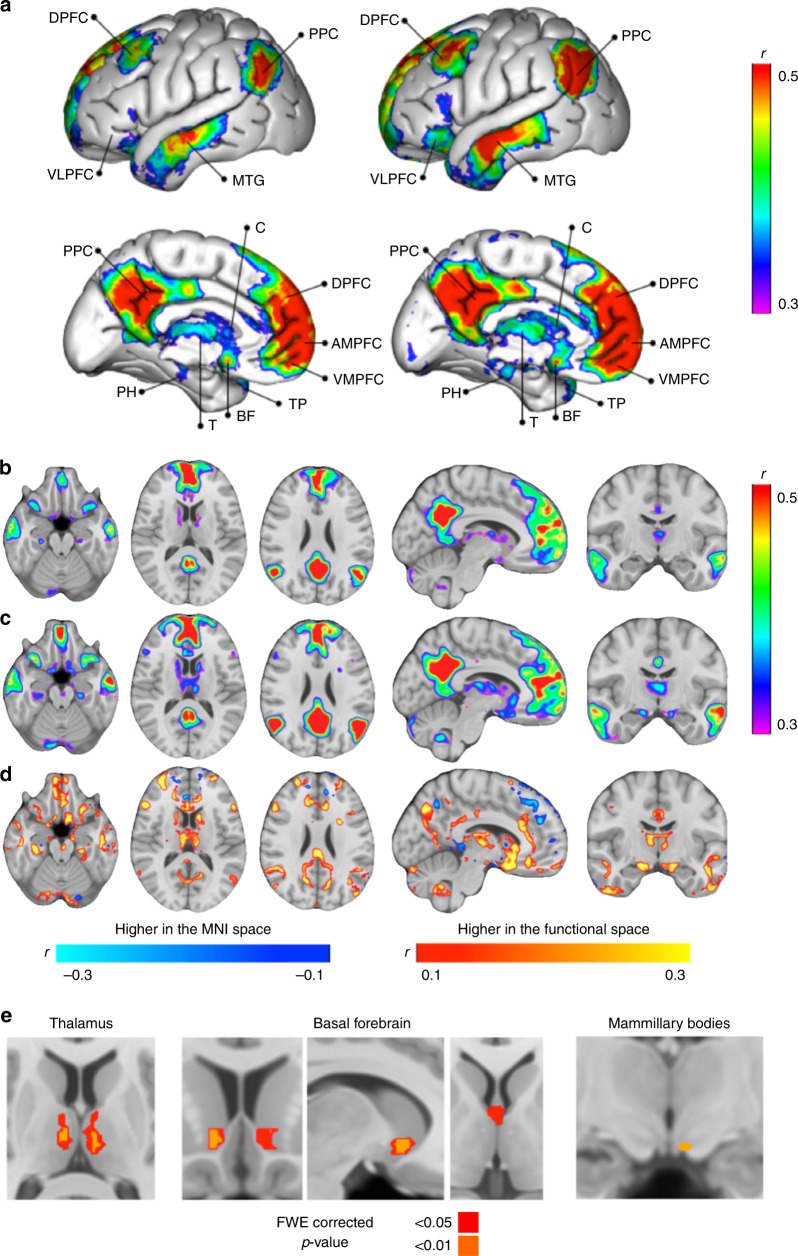
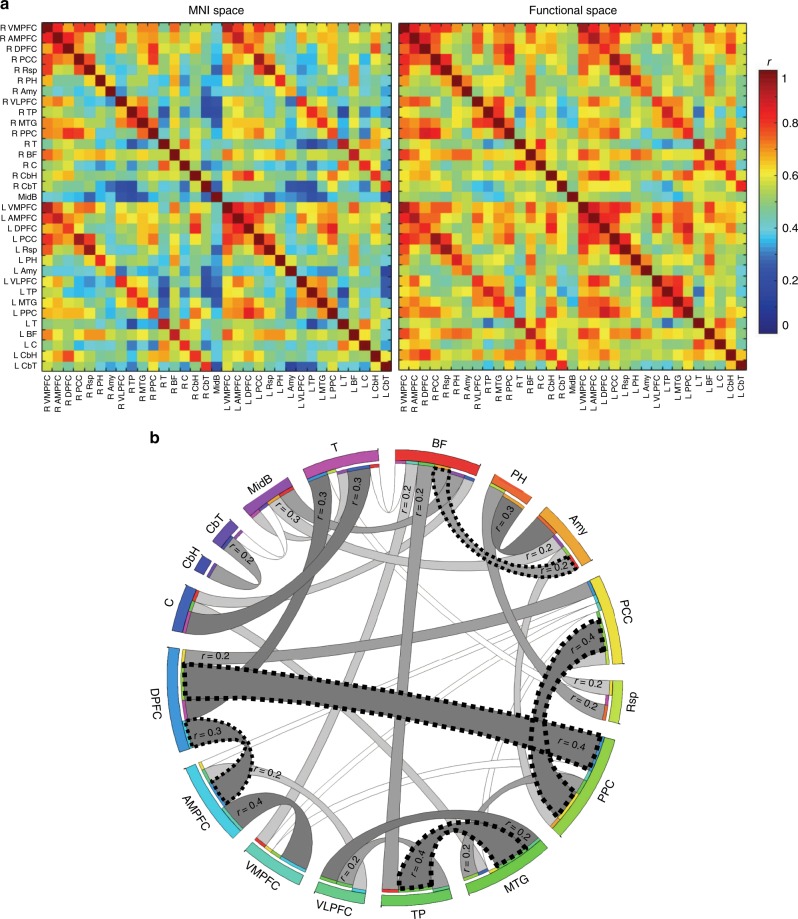
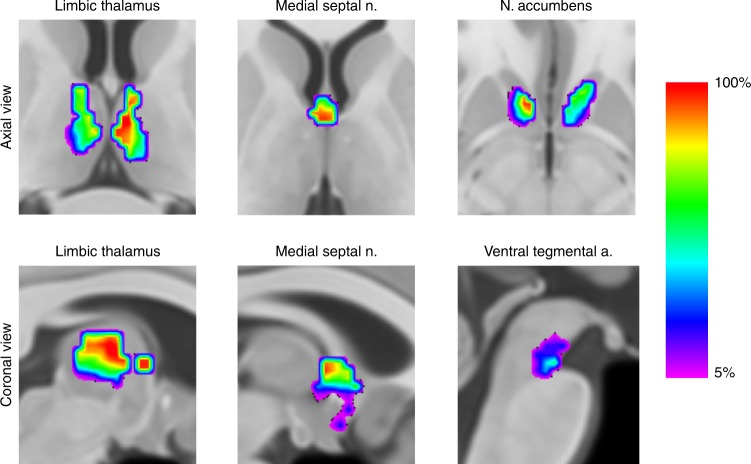
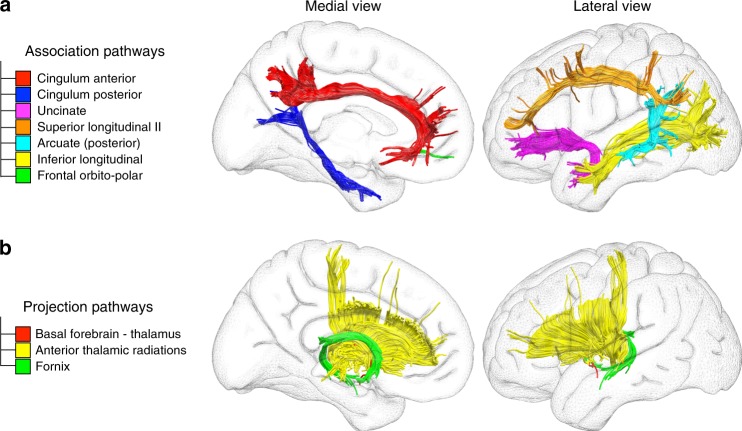
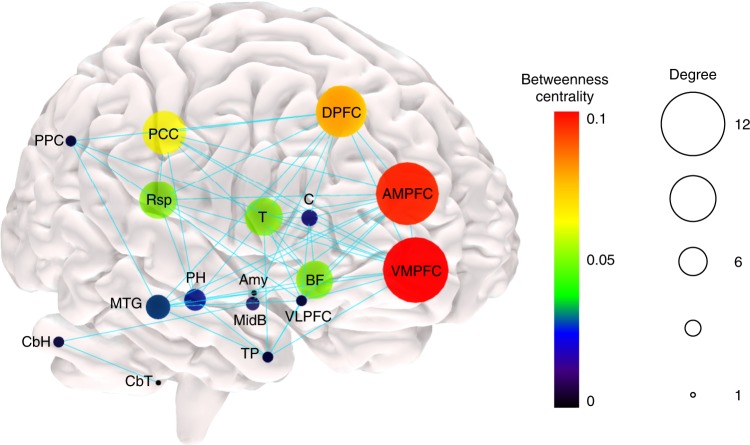
The brain is constituted of multiple networks of functionally correlated brain areas, out of which the default-mode network (DMN) is the largest. Most existing research into the DMN has taken a corticocentric approach. Despite its resemblance with the unitary model of the limbic system, the contribution of subcortical structures to the DMN may be underappreciated. Here, we propose a more comprehensive neuroanatomical model of the DMN including subcortical structures such as the basal forebrain, cholinergic nuclei, anterior and mediodorsal thalamic nuclei. Additionally, tractography of diffusion-weighted imaging was employed to explore the structural connectivity, which revealed that the thalamus and basal forebrain are of central importance for the functioning of the DMN. The contribution of these neurochemically diverse brain nuclei reconciles previous neuroimaging with neuropathological findings in diseased brains and offers the potential for identifying a conserved homologue of the DMN in other mammalian species.

Keywords: Brain; Human behaviour; Neural circuits.


Conflict of interest statement

Competing interestsMichel Thiebaut de Schotten is an Editorial Board Member for Communications Biology, but was neither involved in the editorial review of nor the decision to publish this article. The authors declare no other competing financial or non-financial interests.

Figures

Fig. 1
Fig. 1
Illustration of intersubject alignment of brain images and unitary model of the limbic system. Blue and green rectangles represent the same functional area in two subjects, while yellow rectangles illustrate the overlap of the two individual areas after alignment. With structural alignment, there can be a complete misalignment of small functional areas (a) or partial misalignment of large functional areas (b) due to functional–anatomical variability or poor anatomical contrasts in MRI imaging. If an additional step of functional alignment is performed, an optimised overlap of functional areas is obtained. c The limbic system as originally depicted by Papez and (d) diagram of the unitary model of the limbic system–,–
Fig. 2
Fig. 2
Maps of the DMN structurally or functionally aligned. a 3D view of the two DMN left panel corresponds to the structural space alignment, right panel to the functional space alignment, b brain sections of the structurally aligned DMN, c brain sections of the functionally aligned DMN, d subtraction of the structurally and the functionally aligned DMN maps, e statistical comparison (paired t test) between the two methods of alignment —structurally and functionally aligned DMN—in the three hypothesised regions, with colours indicating statistically significant differences at two levels of significance: <0.05 and <0.01, family-wise error (FWE) corrected p-values (higher in the functional space). DPFC dorsal prefrontal cortex, PPC posterior parietal cortex, VLPFC ventrolateral prefrontal cortex, MTG middle temporal gyrus, PCC posterior cingulate cortex, C caudate, DPFC dorsal prefrontal cortex, AMPFC antero-median prefrontal cortex, VMPFC ventro-median prefrontal cortex, TP temporal pole, BF basal forebrain, T thalamus, PH parahippocampal. n = 20 participants
Fig. 3
Fig. 3
Functional connectivity. a Matrices of the Pearson’s correlations between rs-fMRI time series of the regions of interest in the structural and in the functional space. b Graph representation of the partial correlations between regions of interest in the functional space (connections with partial correlation above 0.2 are depicted; darker grey tones represent stronger connections). Statistically significant partial correlations have a dashed borderline (one-sample t test; p < 0.0001, which corresponds to the Bonferroni corrected level of significance). The left side structures are not represented, for a clearer visualisation. DPFC dorsal prefrontal cortex, PPC posterior parietal cortex, VLPFC ventrolateral prefrontal cortex, Rsp retrosplenial cortex, MTG middle temporal gyrus, PCC posterior cingulate cortex, C caudate, DPFC dorsal prefrontal cortex, AMPFC antero-median prefrontal cortex, VMPFC ventro-median prefrontal cortex, TP temporal pole, BF basal forebrain, T thalamus, PH parahippocampal region, CbH cerebellar hemisphere, CbT cerebellar tonsil, Amy amygdala, MidB midbrain. n = 20 participants
Fig. 4
Fig. 4
Density maps of the functionally aligned individual DMN networks superimposed in the MNI152 space. Colour bar represents the percentage of individuals with a significant correlation in each voxel. This map is freely available at https://neurovault.org/collections/CTTXXAYJ/. n = 20 participants
Fig. 5
Fig. 5
Structural connections supporting the DMN. a corresponds to the association pathways connecting the cortical regions of the DMN. b illustrates the projection pathways mediating the connections between subcortical and cortical regions of the DMN
Fig. 6
Fig. 6
Graph theory analysis of structural connectivity. The node size represents node degree and the node colour illustrates node betweenness centrality. The edges denote presence of structural connection. DPFC dorsal prefrontal cortex, PPC posterior parietal cortex, VLPFC ventrolateral prefrontal cortex, Rsp retrosplenial cortex, MTG middle temporal gyrus, PCC posterior cingulate cortex, C caudate, DPFC dorsal prefrontal cortex, AMPFC antero-median prefrontal cortex, VMPFC ventro-median prefrontal cortex, TP temporal pole, BF basal forebrain, T thalamus, PH parahippocampal region, CbH cerebellar hemisphere, CbT cerebellar tonsil, Amy amygdala, MidB midbrain. n = 20 participants

References

    1. Ingvar DH. “Hyperfrontal” distribution of the cerebral grey matter flow in resting wakefulness; on the functional anatomy of the conscious state. Acta Neurol. Scand. 1979;60:12–25. doi: 10.1111/j.1600-0404.1979.tb02947.x. - DOI - PubMed
    1. Mazoyer B, et al. Cortical networks for working memory and executive functions sustain the conscious resting state in man. Brain Res Bull. 2001;54:287–298. doi: 10.1016/S0361-9230(00)00437-8. - DOI - PubMed
    1. Shulman G, et al. Top-down modulation of early sensory cortex. Cereb. cortex. 1997;7:193–206. doi: 10.1093/cercor/7.3.193. - DOI - PubMed
    1. Raichle ME, et al. A default mode of brain function. Proc. Natl Acad. Sci. USA. 2001;98:676–682. doi: 10.1073/pnas.98.2.676. - DOI - PMC - PubMed
    1. Buckner RL, Andrews-Hanna JR, Schacter DL. The brain’s default network: anatomy, function, and relevance to disease. Ann. N. Y. Acad. Sci. 2008;1124:1–38. doi: 10.1196/annals.1440.011. - DOI - PubMed

Publication types