

Senescent human melanocytes drive skin ageing via paracrine telomere dysfunction
- PMID: 31633821
- PMCID: PMC6885734
- DOI: 10.15252/embj.2019101982
Senescent human melanocytes drive skin ageing via paracrine telomere dysfunction
Abstract
Cellular senescence has been shown to contribute to skin ageing. However, the role of melanocytes in the process is understudied. Our data show that melanocytes are the only epidermal cell type to express the senescence marker p16INK4A during human skin ageing. Aged melanocytes also display additional markers of senescence such as reduced HMGB1 and dysfunctional telomeres, without detectable telomere shortening. Additionally, senescent melanocyte SASP induces telomere dysfunction in paracrine manner and limits proliferation of surrounding cells via activation of CXCR3-dependent mitochondrial ROS. Finally, senescent melanocytes impair basal keratinocyte proliferation and contribute to epidermal atrophy in vitro using 3D human epidermal equivalents. Crucially, clearance of senescent melanocytes using the senolytic drug ABT737 or treatment with mitochondria-targeted antioxidant MitoQ suppressed this effect. In conclusion, our study provides proof-of-concept evidence that senescent melanocytes affect keratinocyte function and act as drivers of human skin ageing.
Keywords: SASP; melanocytes; senescence; skin ageing; telomeres.
© 2019 The Authors.
Conflict of interest statement
DG, DT and KB are Unilever employees. Although no products were tested, this work could potentially promote the use of anti‐ageing products and lead to financial gain for Unilever.
Figures
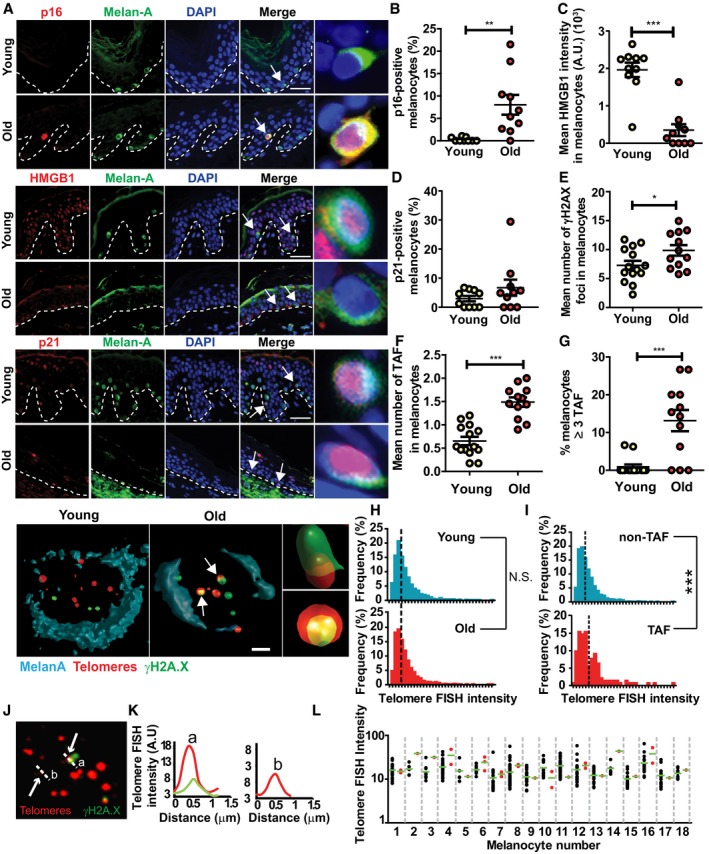
- A
Representative immunofluorescence images for p16, HMGB1 and p21 together with Melan‐A in young and older skin. Arrows indicate melanocytes, which are amplified on the right. Scale bar is 30 μm. Bottom panel shows representative immuno‐FISH images for γH2AX (green) and telomeres (red) in melanocytes in young and older skin sections. Arrows indicate co‐localisation between γH2AX foci and telomeres (TAF), which are amplified on the right. Images are 3D reconstructions of immuno‐FISH using confocal microscopy and taken with a 100× oil objective. Scale bar is 10 μm.
- B–G
Dot plots show (B) percentage of p16‐positive melanocytes, (C) mean HMGB1 intensity in melanocytes, (D) percentage of p21‐positive melanocytes, (E) mean number of γH2AX foci, (F) mean number of TAF in melanocytes and (G) percentage of melanocytes containing ≥ 3 TAF for each individual subject (n = 10–14 young and 10–12 old donors). The horizontal line represents the mean for each group ± SEM.
- H
Histograms showing distribution of telomere signal intensities in melanocytes analysed by Q‐FISH in young (n = 8) and old (n = 7) skin biopsies. Dotted lines indicate median intensity.
- I
Histograms showing distribution of intensities of γH2AX‐negative (non‐TAF) and γH2AX‐positive (TAF) telomeres in melanocytes in older skin (n = 8 donors). Dotted lines indicate median intensity.
- J
Representative immuno‐FISH image (red: telomeres; green: γH2AX) of a melanocyte in the skin of an older donor, showing a longer telomere co‐localising with γH2AX (a) and a shorter one which is γH2AX‐negative (b). Arrows indicate telomeres measured in (K), and dashed lines show the area quantified in (K). Images are Huygen (SVI) deconvolved Z projections and were taken using a 100× oil objective.
- K
Graphs showing the quantification of telomere intensity of γH2AX‐positive (a) and γH2AX‐negative (b) telomeres. Red line indicates telomere intensity, and green shows γH2AX intensity.
- L
Graph showing FISH intensities for individual telomeres co‐localising (TAF; red) or not co‐localising (non‐TAF; black) with γH2AX foci in individual melanocytes (n = 18). Green horizontal line indicates the mean FISH intensity.
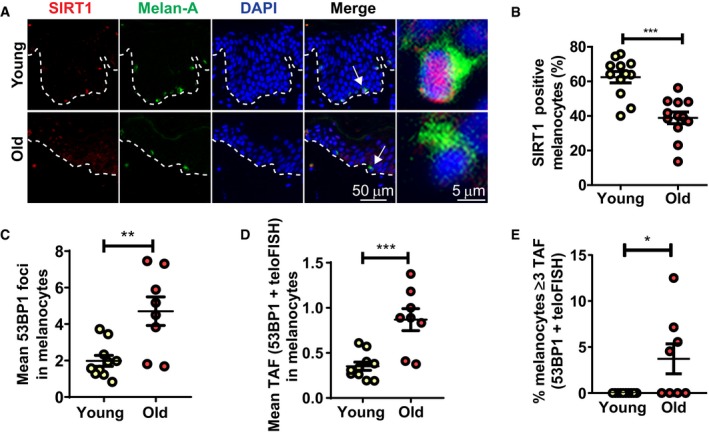
- A
Representative images of SIRT1 immunofluorescence in combination with the melanocyte marker Melan‐A in young and older skin. Arrow indicates a melanocyte, which is amplified on the right.
- B
Dot plot showing percentage of SIRT1‐positive melanocytes for each individual donor. The horizontal line represents the group mean (n = 12 donors for each group). Data are shown as mean ± SEM.
- C–E
Graphs showing (C) mean number of 53BP1 foci in melanocytes, (D) mean number of 53BP1 foci co‐localising with telomeres in melanocytes and (E) percentage of melanocytes containing ≥ 3 53BP1 foci co‐localising with telomeres for each individual subject. The horizontal line represents the mean for each group (n = 10 young donors; n = 8 old donors). Data are shown as mean ± SEM.
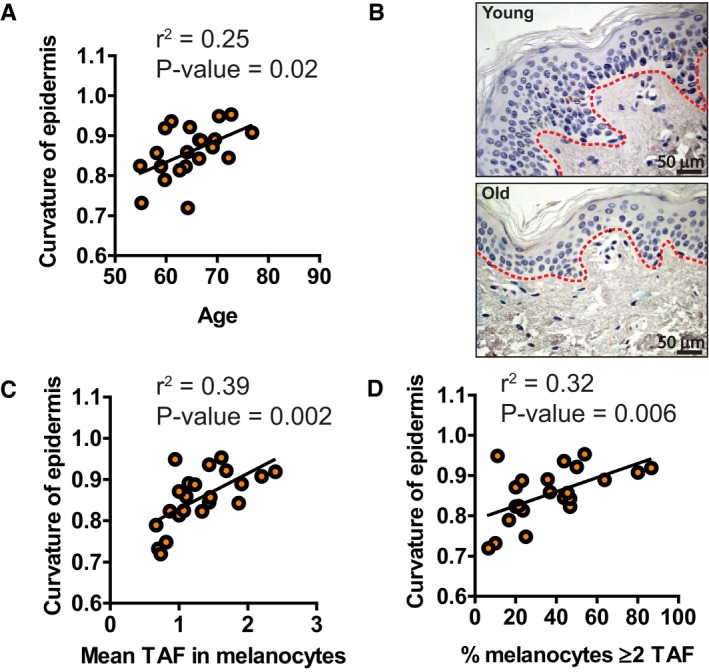
- A
Graph showing the correlation between epidermal curvature and age for each individual donor (n = 22 donors) accounting for subject age. A curvature value closer to 1 denotes a flatter epidermal–dermal junction (EDJ).
- B
Images illustrating the loss in epidermal curvature (red dotted lines) with age. Red dotted lines represent the EDJ.
- C, D
Graphs showing correlations between (C) mean number of TAF in melanocytes and (D) percentage of melanocytes containing ≥ 2 TAF and epidermal curvature for each individual donor. When accounting for subject age, the statistical significance for these correlations was (C) P = 0.007 and (D) P = 0.02.
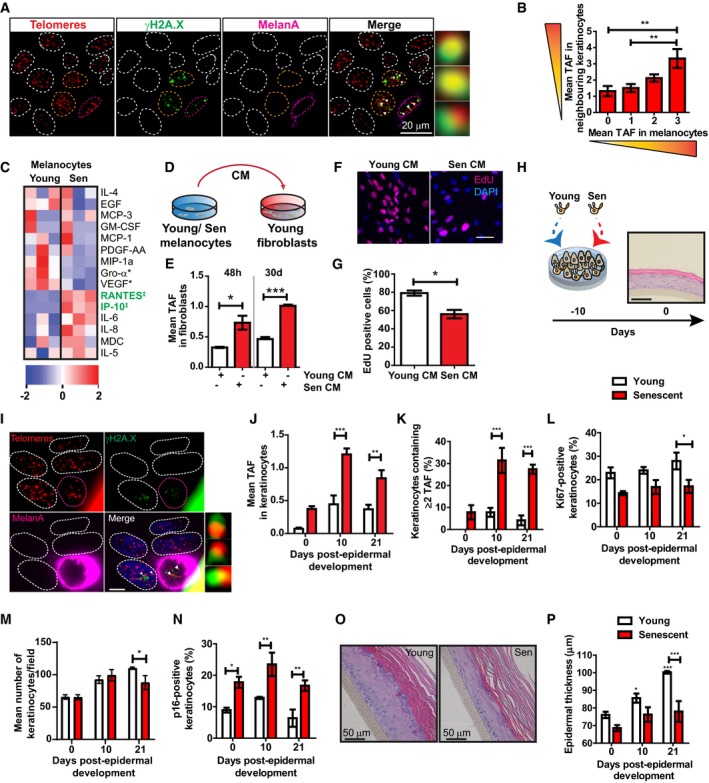
- A
Representative immuno‐FISH images of keratinocytes around melanocytes with 3 TAF in skin from older donors. Melanocytes are circled in pink, and keratinocytes analysed are circled in orange. Areas encircled with white dashed lines represent other keratinocytes not included in this analysis. Arrows represent co‐localisation between γH2AX and telomeres (TAF), which are amplified on the right. Images are Z projections taken using a 100× oil objective.
- B
Graph showing mean number of TAF in keratinocytes adjacent to melanocytes containing 0–3 TAF in skin biopsies of older donors (n = 7). Data are shown as mean ± SEM.
- C
Heatmap showing cytokines detected in conditioned medium from young and senescent melanocytes. Blue represents low expression, whereas red denotes high expression. Each column represents one independent experiment for the corresponding condition (n = 3). Heatmap was generated using Ingenuity Pathway Analysis (IPA). ‡ = cytokines significantly up‐regulated; * = cytokines significantly down‐regulated.
- D
Experimental scheme. Young dermal fibroblasts were cultured with conditioned medium collected from either young or senescent melanocyte.
- E
Graph showing mean number of TAF in fibroblasts cultured with young or senescent melanocyte CM for 48 h and 30 days. Data are shown as mean ± SEM (n = 3 independent experiments).
- F
Representative EdU immunofluorescence images of fibroblasts cultured in young or senescent melanocyte CM for 20 days. Images were taken using a 20× objective. Scale bar is 50 μm.
- G
Graph showing percentage of EdU‐positive fibroblasts at the indicated culture conditions. Data are shown as mean ± SEM (n = 3 independent experiments).
- H
Scheme representing the development of 3D human epidermal equivalents. Proliferating or senescent melanocytes are co‐cultured with keratinocytes for 10 days before fully differentiating into an epidermal equivalent. Day 0 indicates the day of complete epidermal differentiation. Scale bar is 50 μm.
- I
Representative immuno‐FISH image of a melanoderm containing senescent melanocytes. Telomeres are shown in red, γH2AX is shown in green, and Melan‐A is shown in pink. Arrow indicates co‐localisation between γH2AX and telomeres (TAF), which is amplified on the right. Images are Z projections taken with a 63× oil objective. Scale bar is 10 μm.
- J–N
Graphs showing (J) mean number of TAF in keratinocytes, (K) percentage of keratinocytes containing ≥ 2 TAF, (L) percentage of Ki‐67‐positive keratinocytes, (M) mean number of keratinocytes and (N) percentage of p16‐positive keratinocytes in melanoderms containing either young (white bars) or senescent (red bars) melanocyte at the time points indicated. Data are shown as mean ± SEM of n = 3–4 (proliferating) and n = 3 (senescent) melanoderms.
- O
Representative H&E images showing epidermal thickness of melanoderms containing young or senescent melanocytes. Images were taken using a 20× objective.
- P
Graph showing epidermal thickness of melanoderms containing either young (white bars) or senescent (red bars) melanocyte at the time points indicated. Data are shown as mean ± SEM of n = 4 (proliferating) or n = 3 (senescent) melanoderms.
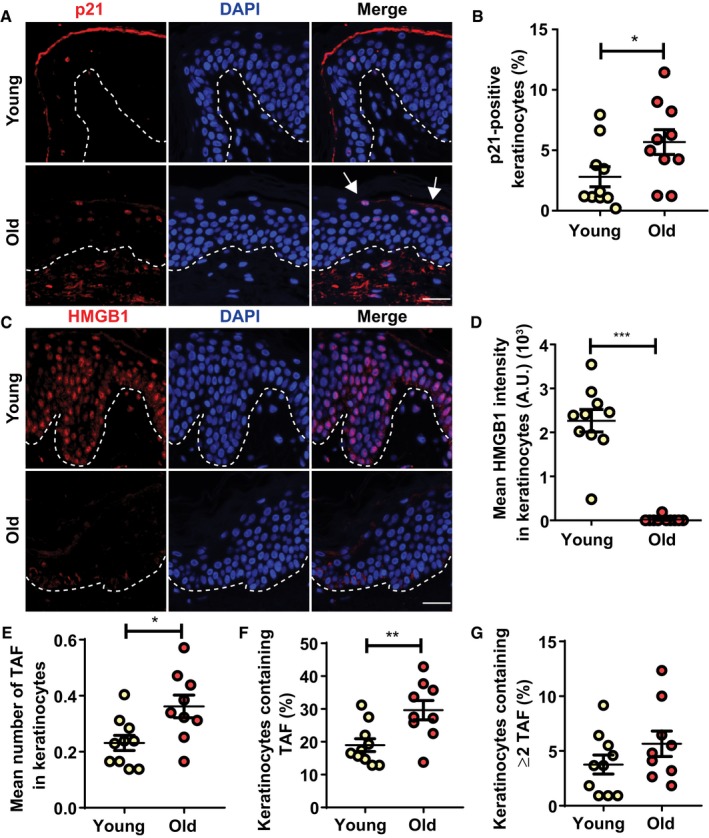
- A–D
Representative immunofluorescence images of (A) p21 and (C) HMGB1 in skin from young and old donors. Images were taken using a 20× objective. Arrows indicate p21‐positive keratinocytes in the uppermost layer of the epidermis. Scale is 30 μm. Graphs showing (B) percentage of p21‐positive keratinocytes per donor and (D) HMGB1 intensity in keratinocytes. The horizontal line represents the mean for each group (n = 10 donors per group). Data are shown as mean ± SEM.
- E–G
(E) Mean number of TAF in keratinocytes, (F) percentage of keratinocytes containing TAF and (G) percentage of keratinocytes containing ≥ 2 TAF in skin sections from young and old donors. The mean for each group is represented by the horizontal line (n = 10 young donors; n = 9 old donors). Data are shown as ± SEM.
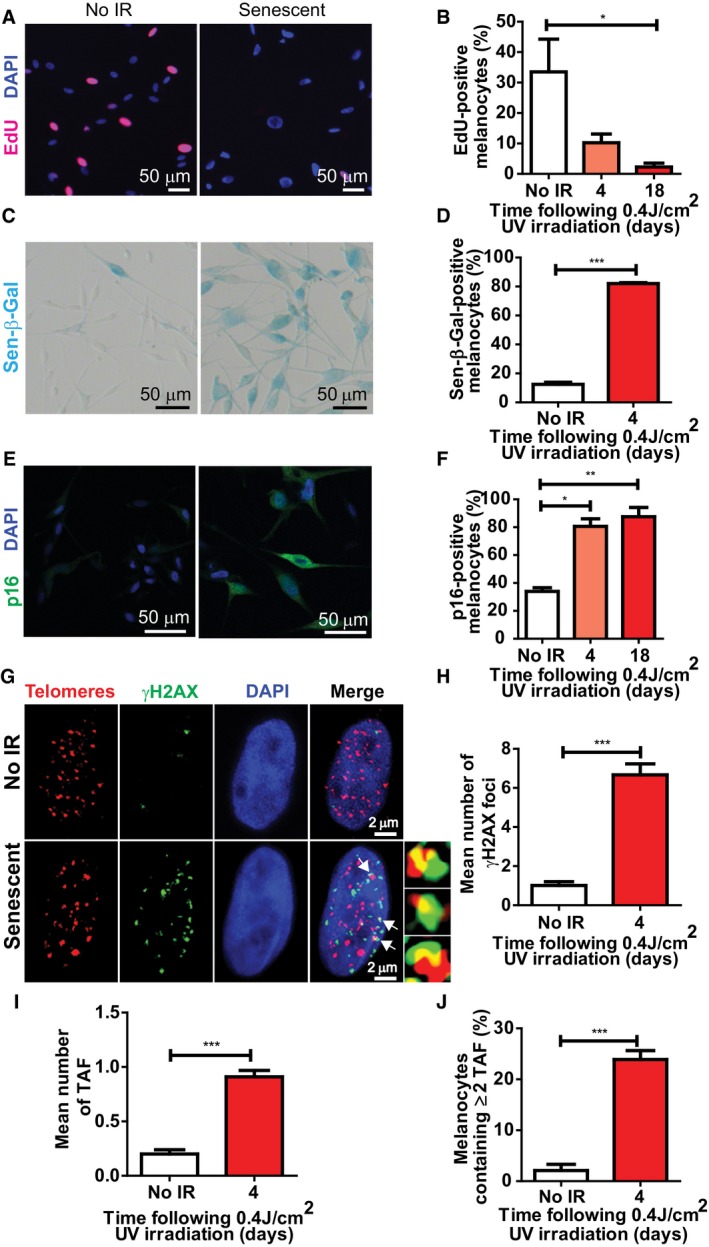
- A
Representative EdU immunofluorescence images of proliferating and irradiated melanocytes (18 days post‐IR) (red: EdU; blue: DAPI). Images were taken using a 20× objective.
- B
Graph showing the percentage of EdU‐positive melanocytes at the time points indicated. Data are shown as mean ± SEM of n = 3 independent experiments.
- C
Representative images of Sen‐β‐Gal (blue) of proliferating and UV‐irradiated melanocytes. Images were taken using a 20× objective.
- D
Graph showing the percentage of control and irradiated (4 days after the last exposure) Sen‐β‐Gal‐positive melanocytes. Data are shown as mean ± SEM of n = 3 independent experiments.
- E
Representative p16 immunofluorescence images of proliferating and senescent melanocytes (18 days following the last UV exposure). Images were taken using a 20× objective.
- F
Graph showing the percentage of p16‐positive melanocytes at the time points indicated following the last UV exposure. Data are shown as mean ± SEM of n = 3 independent experiments.
- G
Representative immuno‐FISH images of proliferating (top) and senescent (bottom) melanocytes. Telomeres are shown in red, γH2AX is depicted in green, and DAPI is shown in blue. Arrows indicate co‐localisation between γH2AX and telomeres, which are amplified on the right. Images are Z projections and were taken using a 63× oil objective.
- H–J
Graphs showing (H) mean number of γH2AX foci, (I) mean number of TAF, (J) percentage of melanocytes containing ≥ 2 TAF. Data are shown as mean ± SEM of n = 3 independent experiments.
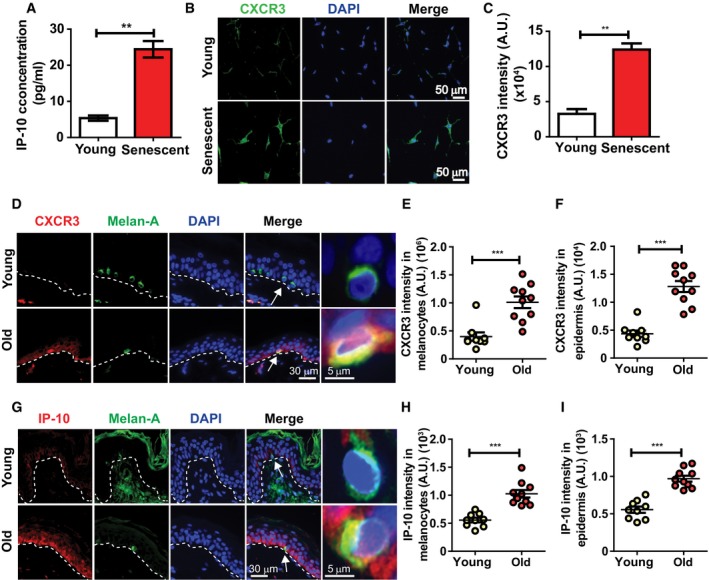
- A
Graph showing the concentration of IP‐10 secreted by senescent melanocytes in culture. Data are shown as mean ± SEM of n = 3 independent experiments.
- B
Representative immunofluorescence images of CXCR3 (green) in young and stress‐induced senescent melanocytes. Images were taken using a 20× objective.
- C
Graph showing CXCR3 fluorescence signal intensity in young and senescent melanocytes. Data are shown as mean ± SEM of n = 3 independent experiments.
- D
Representative immunofluorescence images of CXCR3 (red) in skin sections from young and older donors. Images were taken using a 20× objective. Arrows indicate melanocytes, which are amplified on the right.
- E, F
Dot plots showing CXCR3 fluorescence intensity in (E) melanocytes specifically and (F) whole epidermis of young (n = 9) and older (n = 10) human skin for each individual donor. The horizontal line represents the mean for each group. Data are shown as mean ± SEM.
- G
Representative immunofluorescence images of IP‐10 (red) in skin sections from young and older donors. Images were taken using a 20× objective. Arrows indicate melanocytes, which are amplified on the right.
- H, I
Dot plots showing IP‐10 fluorescence intensity in (H) melanocytes specifically and (I) whole epidermis of young (n = 9) and older (n = 10) human skin for each individual donor. The horizontal line represents the mean for each group. Data are shown as mean ± SEM.
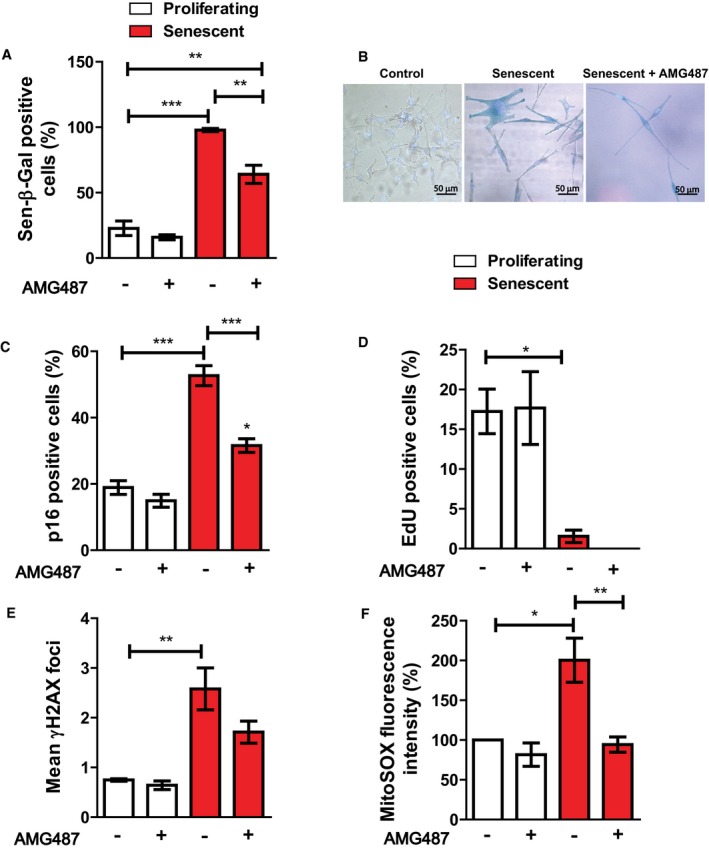
- A
Graph showing the percentage of Sen‐β‐Gal‐positive melanocytes at the conditions indicated (white: proliferating melanocytes; red: senescent melanocytes). Data are shown as ± SEM (n = 3 independent experiments).
- B
Representative Sen‐β‐Gal images of proliferating and senescent melanocytes with or without AMG487 treatment. Images were taken using a 20× objective.
- C–F
Graphs showing the percentage of (C) p16‐positive and (D) EdU‐positive melanocytes at the conditions indicated. (E) Mean number of γH2AX foci in proliferating and senescent melanocytes with or without AMG487 treatment. (F) MitoSOX fluorescence intensity of melanocytes at the conditions indicated. Values are a percentage fold change normalised to proliferating controls (untreated). ROS measurements were performed at 3 days following irradiation. Data are shown as mean ± SEM of N = 3 independent experiments.
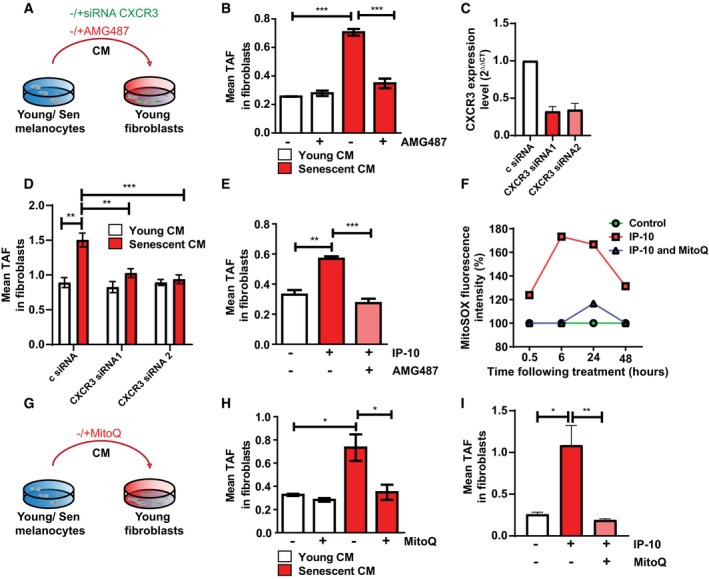
Dermal fibroblasts were cultured with either young or senescent melanocyte conditioned medium. CXCR3 inhibition was achieved either by siRNA knockdown of CXCR3 or by treating fibroblasts with the CXCR3 inhibitor, AMG487.
Graph showing the mean number of TAF in fibroblasts cultured with young or senescent melanocyte CM with or without AMG487. Data are shown as mean ± SEM of n = 3 independent experiments.
Knockdown efficiency of two different siRNAs against CXCR3. Data are shown as mean ± SD of n = 2 independent experiments.
Mean number of TAF in fibroblasts cultured with young or senescent melanocyte CM after CXCR3 knockdown. Data are shown as mean ± SEM of n = 3 independent experiments.
Mean number of TAF in fibroblasts cultured with IP‐10 with or without AMG487. Data are shown as mean ± SEM of n = 3 independent experiments.
Graph showing MitoSOX fluorescence intensity of fibroblasts treated with IP‐10 with or without MitoQ at the time points indicated. Values are a percentage fold change normalised to controls. Graph is representative of one out of n = 3 independent experiments.
Dermal fibroblasts were cultured with either young or senescent melanocyte conditioned medium with or without MitoQ.
Mean number of TAF in fibroblasts cultured with young or senescent melanocyte CM with or without MitoQ. Data are shown as mean ± SEM of n = 3 independent experiments.
Mean number of TAF in fibroblasts treated with IP‐10 with or without MitoQ. Data are shown as mean ± SEM of n = 3 independent experiments.
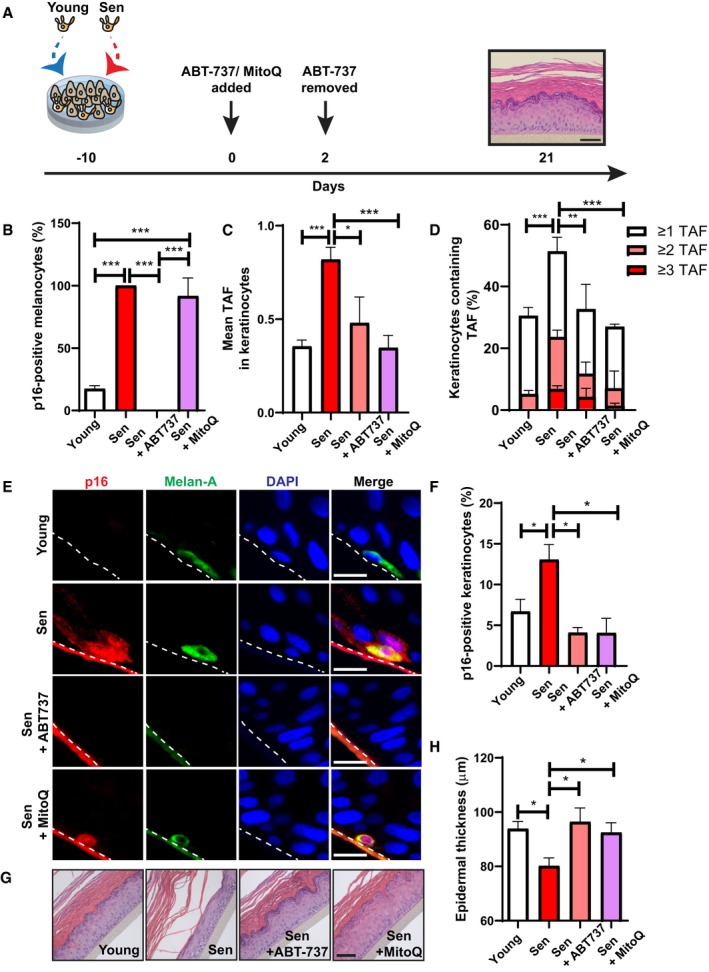
- A
Melanoderms comprised young keratinocytes with either young or senescent melanocytes. ABT737 or MitoQ was added at day 0 (day of full epidermal differentiation). ABT737 was removed at day 2, and melanoderms were cultured under normal culture conditions for the remainder of the experiment. MitoQ was refreshed every 2 days until the end of the experiment at day 21. Tissues were analysed at day 21. Scale bar is 50 μm.
- B
Graph showing the percentage of p16‐positive melanocytes in melanoderms with or without ABT737 treatment. Data are shown as mean ± SEM of n = 4 (young) and n = 3 (senescent control and treated) melanoderms.
- C, D
Graphs showing (C) the mean number of TAF in keratinocytes and (D) the percentage of keratinocytes containing ≥ 1, ≥ 2 and ≥ 3 TAF in melanoderms in the conditions indicated. Data are shown as mean ± SEM of n = 3–6 melanoderms (statistical significance is indicated for ≥ 2 TAF).
- E
Representative immunofluorescence images of p16 (red) in melanoderms containing young or senescent melanocytes with or without ABT737 or MitoQ treatment. Images were taken using a 20× objective. Scale bar = 50 μm.
- F
Graph showing the percentage of p16‐positive keratinocytes in melanoderms in the conditions indicated. Data are shown as mean ± SEM of n = 3–7 melanoderms.
- G
Representative H&E images showing epidermal thickness of melanoderms containing young or senescent melanocytes with and without ABT737 or MitoQ at 21 days following epidermal development. Images were taken using a 20× objective. Scale bar = 50 μm.
- H
Graph showing epidermal thickness of melanoderms containing either young or senescent melanocytes with or without ABT737 or MitoQ at the time points indicated. Data are shown as mean ± SEM of n = 3–8 melanoderms.
References
-
- d'Adda di Fagagna F, Reaper PM, Clay‐Farrace L, Fiegler H, Carr P, Von Zglinicki T, Saretzki G, Carter NP, Jackson SP (2003) A DNA damage checkpoint response in telomere‐initiated senescence. Nature 426: 194–198 - PubMed
Publication types
MeSH terms
Substances
Grants and funding
- BB/K017314/1/UK Research and Innovation|Biotechnology and Biological Sciences Research Council (BBSRC)/International
- Ted Nash Foundation/International
- P01 AG031862/AG/NIA NIH HHS/United States
- Unilever/International
- PD1921/Glenn Foundation for Medical Research (Glenn Foundation)/International
- BB/L502066/1/UK Research and Innovation|Biotechnology and Biological Sciences Research Council (BBSRC)/International
- UL1TR002377/National Center for Advancing Translational Science (NCATS)/International
- UL1 TR002377/TR/NCATS NIH HHS/United States
- SBF003_1179/AMS_/Academy of Medical Sciences/United Kingdom
LinkOut - more resources
Full Text Sources
Other Literature Sources
Medical
Miscellaneous
