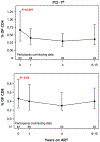
T cells with high PD-1 expression are associated with lower HIV-specific immune responses despite long-term antiretroviral therapy
- PMID: 31634201
- PMCID: PMC7313719
- DOI: 10.1097/QAD.0000000000002406
T cells with high PD-1 expression are associated with lower HIV-specific immune responses despite long-term antiretroviral therapy
Abstract
Objective: We evaluated frequencies of T cells with high PD-1 expression (PD-1) before and after long-term effective antiretroviral therapy (ART), and determined if frequencies on-ART correlated positively with measures of HIV persistence and negatively with HIV-specific responses.
Methods: We enrolled individuals who started ART during chronic infection and had durable suppression of viremia for at least 4 years (N = 99). We assessed PD-1 T-cell frequencies at timepoints pre-ART and on-ART using flow cytometry, and evaluated how frequencies on-ART are associated with measures of HIV persistence, HIV-specific immune responses, and immune activation levels.
Results: Pre-ART, PD-1 CD4 T cells correlated positively with viremia and negatively with CD4 T-cell count. At year 1 on-ART, %PD-1 CD4 T cells decreased but then remained stable at 4 and 6-15 years on-ART, whereas %PD-1 CD8 T cells on-ART remained similar to pre-ART. PD-1 CD4 T cells correlated positively with HIV DNA pre-ART and on-ART, and with CD4 T-cell activation on-ART. PD-1 CD4 T cells negatively correlated with HIV Gag-specific and Env-specific T-cell responses but not with CMV-specific or EBV-specific responses. PD-1 CD8 T cells trended towards a negative correlation with responses to Gag and Env, but not to CMV and EBV.
Conclusion: PD-1 T cells persist in blood despite prolonged suppression on ART, correlate with HIV DNA levels, and are associated with lower HIV-specific T-cell responses but not CMV-specific or EBV-specific responses, suggesting that these cells are HIV-specific. The findings support evaluating PD-1 blockade strategies for their effect on HIV persistence and HIV-specific immunity.
Figures


References
Publication types
MeSH terms
Substances
Grants and funding
- UM1 AI069494/AI/NIAID NIH HHS/United States
- P30 CA047904/CA/NCI NIH HHS/United States
- UM1 AI068634/AI/NIAID NIH HHS/United States
- R01 AI131798/AI/NIAID NIH HHS/United States
- U01 AI068636/AI/NIAID NIH HHS/United States
- UL1 TR002384/TR/NCATS NIH HHS/United States
- UM1 AI106701/AI/NIAID NIH HHS/United States
- UM1 AI069419/AI/NIAID NIH HHS/United States
- UM1 AI106716/AI/NIAID NIH HHS/United States
- P30 AI050410/AI/NIAID NIH HHS/United States
- U01 AI068634/AI/NIAID NIH HHS/United States
- UM1 AI068636/AI/NIAID NIH HHS/United States
LinkOut - more resources
Full Text Sources
Medical
Research Materials

