. 2019 Oct 21;17(10):e3000081.
doi: 10.1371/journal.pbio.3000081. eCollection 2019 Oct.

High-throughput micropatterning platform reveals Nodal-dependent bisection of peri-gastrulation-associated versus preneurulation-associated fate patterning

Affiliations

High-throughput micropatterning platform reveals Nodal-dependent bisection of peri-gastrulation-associated versus preneurulation-associated fate patterning

Mukul Tewary et al. PLoS Biol. .

Abstract

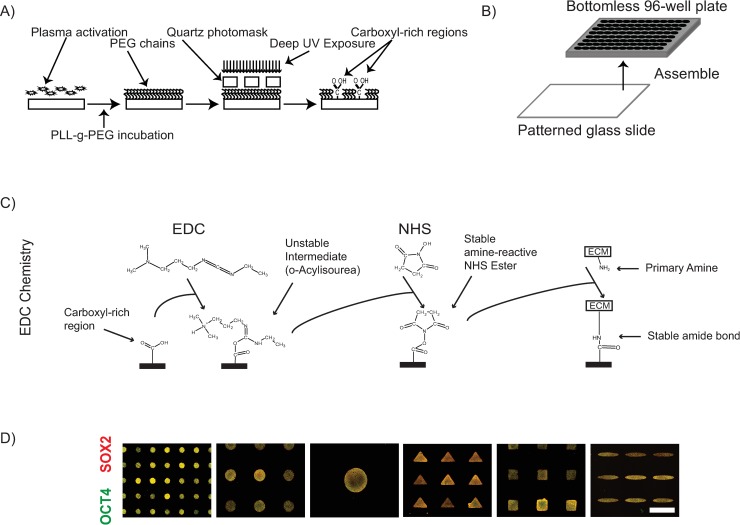
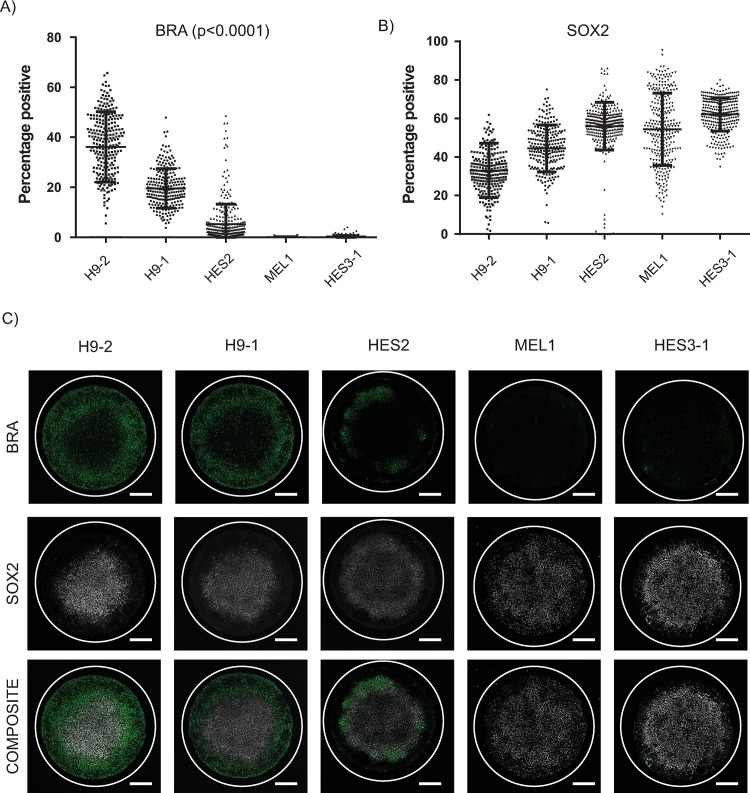
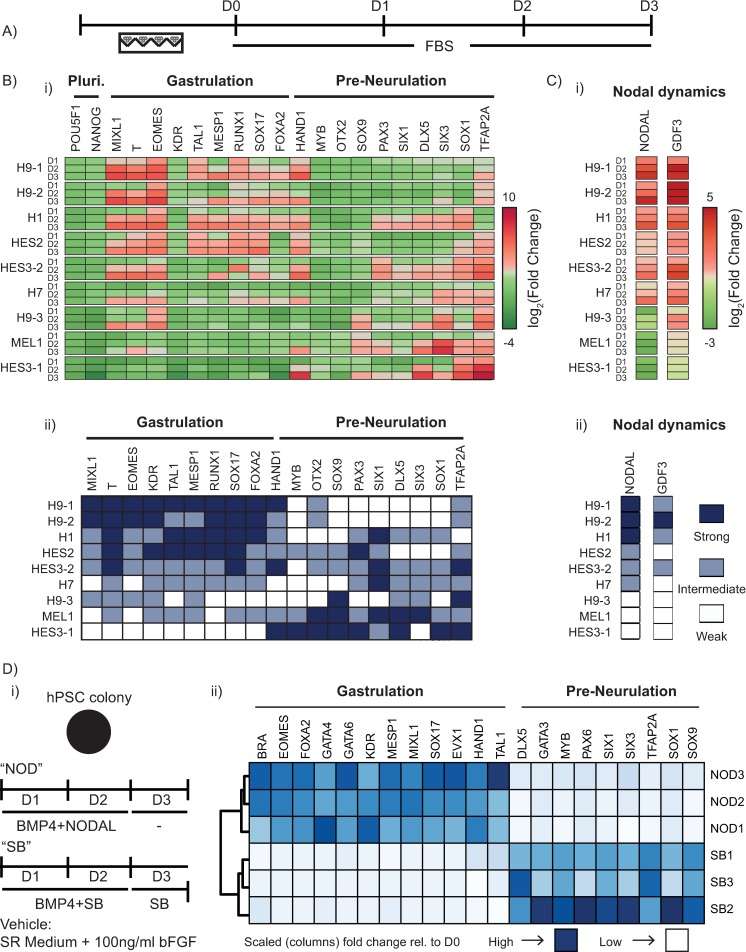
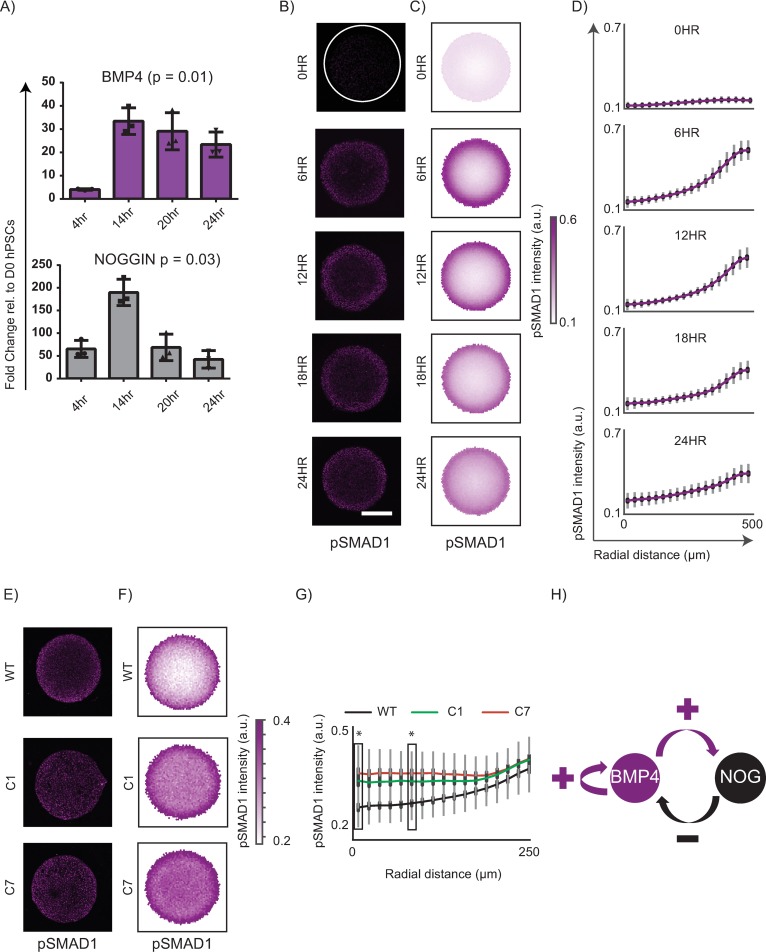
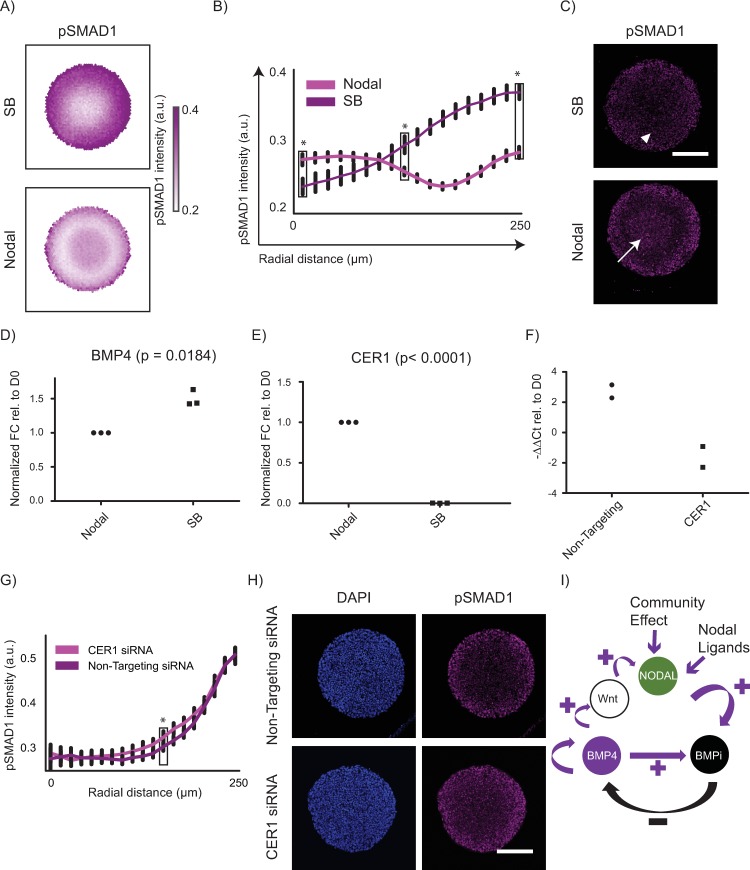
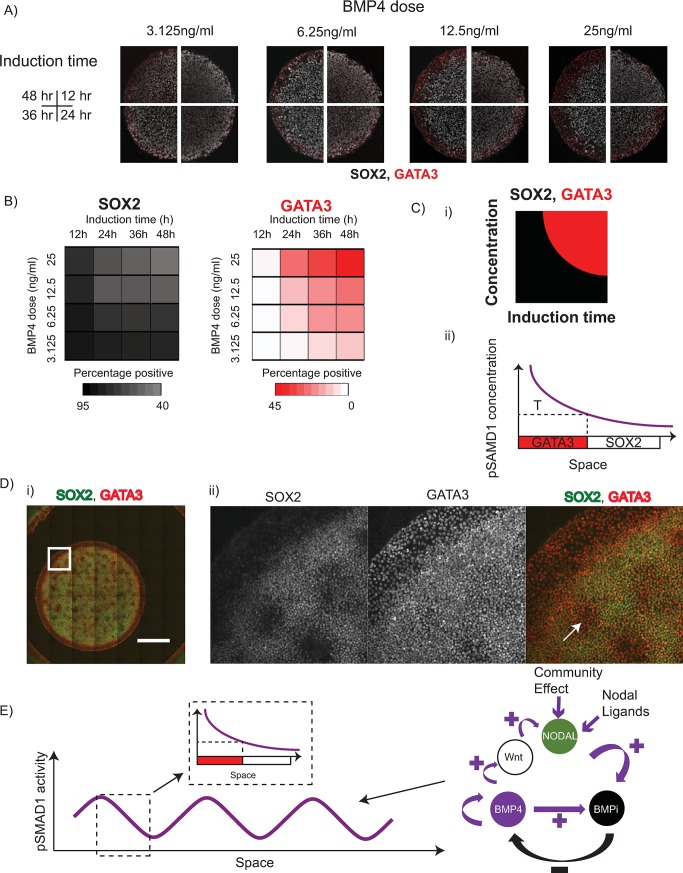
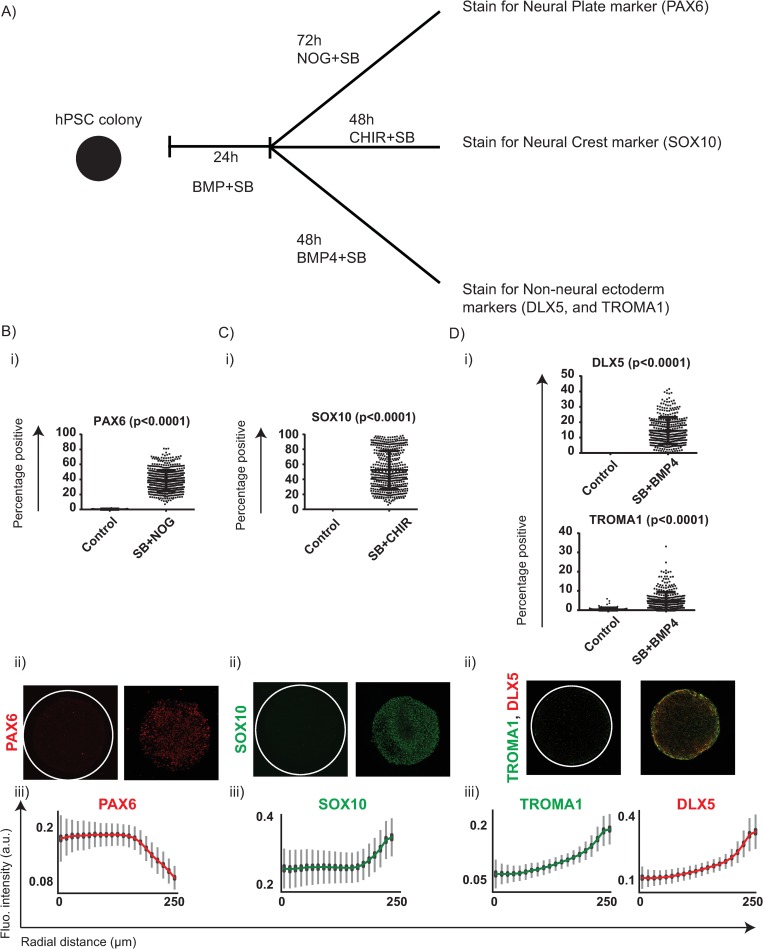
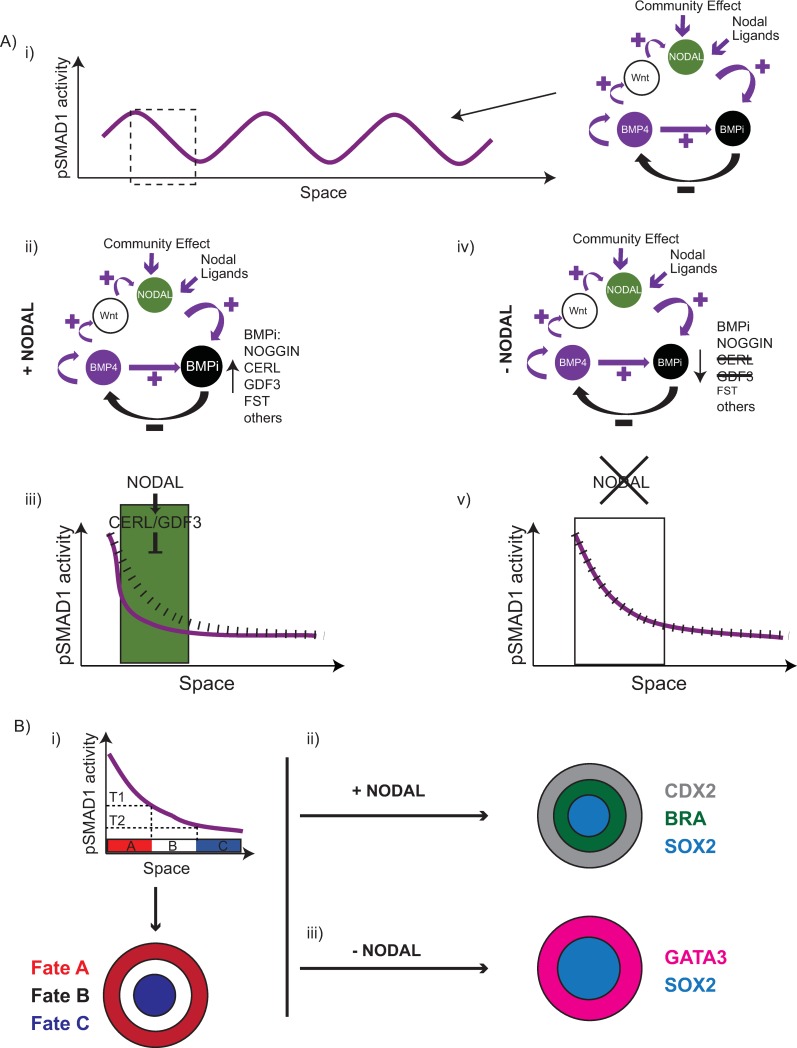
In vitro models of postimplantation human development are valuable to the fields of regenerative medicine and developmental biology. Here, we report characterization of a robust in vitro platform that enabled high-content screening of multiple human pluripotent stem cell (hPSC) lines for their ability to undergo peri-gastrulation-like fate patterning upon bone morphogenetic protein 4 (BMP4) treatment of geometrically confined colonies and observed significant heterogeneity in their differentiation propensities along a gastrulation associable and neuralization associable axis. This cell line-associated heterogeneity was found to be attributable to endogenous Nodal expression, with up-regulation of Nodal correlated with expression of a gastrulation-associated gene profile, and Nodal down-regulation correlated with a preneurulation-associated gene profile expression. We harness this knowledge to establish a platform of preneurulation-like fate patterning in geometrically confined hPSC colonies in which fates arise because of a BMPs signalling gradient conveying positional information. Our work identifies a Nodal signalling-dependent switch in peri-gastrulation versus preneurulation-associated fate patterning in hPSC cells, provides a technology to robustly assay hPSC differentiation outcomes, and suggests conserved mechanisms of organized fate specification in differentiating epiblast and ectodermal tissues.


Conflict of interest statement

The authors have declared that no competing interests exist.

Figures

Fig 1
Fig 1. Development of PEG based micropatterning platform.
(A) Scheme of protocol for transferring carboxyl-rich micro-patterns onto glass coverslips. (B) Overview of assembly procedure to produce 96-well microtiter plates with micropatterned culture surface. (C) Overview of carbodiimide- and succinimide-based ECM protein immobilization scheme. The carboxyl groups induced on the patterned glass coverslips react with EDC to form an unstable intermediate molecule O-Acylisourea. If kept in an aqueous environment for an extended period of time, this activated state may hydrolyze and result in the loss of activation of the carboxyl group. O-Acylisourea reacts with the present NHS molecules to form a stable amine-reactive NHS ester. This activated state is stable when kept dry, and the plates can be stored dry for some time after this activation step. Upon incubation with proteins (for instance, ECM proteins), it results in a covalent immobilization of the protein to the substrate. (D) Representative immunofluorescent images of micropatterned hPSCs colonies generated using the protocol depicted in panels A through C stained for OCT4 and SOX2. ECM, extracellular matrix; EDC, 1-Ethyl-3-(3-dimethylaminopropyl)carbodiimide; NHS, N-HydroxySuccinimide; OCT4, octamer-binding transcription factor 4 (also known as POU5F1); PEG, Polyethylene Glycol; PLL-g-PEG, Poly-L-Lysine-grafted-Polyethylene Glycol.
Fig 2
Fig 2. Variability in peri-gastrulation–like induction observed between test hPSC lines.
(A–B) Quantified expression of BRA (A) and SOX2 (B) observed within the assayed hPSC lines tested. Number of colonies were 252, 245, 327, 288, and 304 for H9-2, H9-1, HES2, MEL1, and HES3-1, respectively. Each data point represents individual colonies identified. Data pooled from 2 experiments. (C) Representative immunofluorescent images for BRA and SOX2 for the test hPSC lines. Scale bar represents 200 μm. For DAPI staining, please see S3B Fig. Underlying numerical data for this figure can be found in https://osf.io/zrvxj/. BRA, Brachyury; hPSC, human pluripotent stem cell; SOX2, SRY (sex determining region Y)-box 2.
Fig 3
Fig 3. Nodal bisects gastrulation- and preneurulation-associated gene expression profiles.
(A) Overview of experimental setup for EB assay. EBs were made from each test hPSC line and allowed to spontaneously differentiate in the presence of FBS for 3 days. (B) Observed gene expression dynamics of test cell lines when differentiated as EBs in FBS. (i) Observed gene expression for a panel of differentiation-associated genes (shown under ‘Gastrulation’ and ‘Pre-Neurulation’ groups) along with POU5F1 (OCT4) and NANOG. Data shown as heat map of mean expression of each day from 3 biological replicates, represented as log2(Fold Change) relative to the D0 sample of respective hPSC line. ‘Pluri’ indicates the pluripotency associated genes. (ii) Heat map representation of panel B(i) with the panel of hPSC lines clustered into 3 groups of ‘Strong’, ‘Intermediate’, and ‘Weak’ responders for each gene using unsupervised K-means clustering. ‘Pluri’ indicates the pluripotency associated genes. (C) Nodal dynamics during EB assay. (i) Observed gene expression of Nodal and a Nodal signalling target (GDF3). Data shown as heat map of mean expression of each day from 3 biological replicates (expression levels for individual replicates shown in S4 Fig), represented as log2(Fold Change) relative to the D0 sample of the respective hPSC line. (ii) Heat map representation of panel C(i) with the panel of hPSC lines clustered into 3 groups of ‘Strong’, ‘Intermediate’, and ‘Weak’ responders for Nodal and GDF3 using unsupervised K-Means clustering. (D) Effect of modulation of Nodal in the peri-gastrulation–like assay using geometrically confined colonies of the ‘CA1’ hPSC line. (i) Overview of the experimental setup. Geometrically confined colonies of CA1s were induced to differentiate for 3 days, with either a 2-day pulse of BMP4 and Nodal and just Nodal for the third day or a 2-day pulse of BMP4 and an inhibitor of Nodal signalling (SB431542, ‘SB’) and just SB for the third day. The vehicle employed in this experiment was SR medium (see Materials and methods for composition). (ii) Heat map representation of a panel of differentiation genes associated with either gastrulation or preneurulation. Dark blue represents higher levels of expression, whereas light blue represents lower levels of expression. Data shown as mean of 3 biological replicates. Expression levels of individual replicates shown in S7 Fig. Underlying numerical data for this figure can be found in https://osf.io/zrvxj/. BMP4, bone morphogenetic protein 4; BRA, brachyury (also known as T); DLX5, distal-less homeobox 5; EB, embryoid body; EOMES, Eomesodermin; FOXA2, forkhead box protein A2; GDF3, growth differentiation factor 3; HAND1, Heart- and neural crest derivatives-expressed protein 1; hPSC, human pluripotent stem cell; KDR, Kinase insert domain receptor; MESP1, mesoderm posterior bHLH transcription factor 1; MIXL1, Mix paired-like homeobox protein 1; MYB, Myb proto-oncogene protein; NANOG, Homeobox protein NANOG; OTX2, Orthodenticle homeobox 2; PAX3, paired box gene 3; POU5F1, POU domain, class 5, transcription factor 1 (also known as OCT4); RUNX1, Runt-related transcription factor 1; SIX1, Sineoculis homeobox homolog 1; SIX3, Sineoculis homeobox homolog 3; SOX1, SRY-box transcription factor 1; SOX17, SRY-box transcription factor 17; SOX9, SRY-box transcription factor 9; SR, serum replacement; T, T box transcription factor T (also known as Brachyury); TAL1, T-cell acute lymphocytic leukemia protein 1; TFAP2A, transcription factor AP2-alpha.
Fig 4
Fig 4. In the absence of Nodal, an interaction network between BMP4-Noggin underlies organization of pSMAD1 gradient.
(A) Temporal gene expression for BMP4 and Noggin at 4 h, 14 h, 20 h, and 24 h after BMP4 and SB treatment. Data shown as mean ± SD of 3 independent experiments. The p-values shown were calculated using Kruskal-Wallis test. Underlying numerical data for this figure can be found in the file Fig 4A in OSF repository in the project named after the paper title. (B) Representative immunofluorescent images of geometrically confined hPSC colonies of 500 μm in diameter stained for pSMAD1 after different times (0 h, 6 h, 12 h, 18 h, and 24 h) of BMP4 and SB exposure. Scale bar represents 200 μm. (C) Average pSMAD1 intensity observed in colonies treated with BMP4 and SB represented as overlays of 231, 241, 222, 238, and 228 colonies for respective induction times. Data pooled from 2 experiments. (D) The average radial trends of pSMAD1 at each duration shown as line plots. SDs shown in grey, and 95% confidence intervals shown in black. Underlying numerical data for this figure can be found in the file Fig 4D in OSF repository in the project named after the paper title. (E–G) Response of pSMAD1 organization in homozygous knockout lines of Noggin. (E) Representative immunofluorescent images of geometrically confined hPSC colonies of WT, Noggin−/− clones C1, and C7 (characterization shown in S8 Fig) stained for pSMAD1 after 24 h of BMP4 exposure in the presence of SB. (F–G) The average radial trends of pSMAD1 for the WT, C1, and C7 clones shown as overlays of all identified colonies (F) and line plots (G). Data pooled from 2 experiments and include 151, 150, 150 colonies for each line, respectively. SDs shown in grey, and 95% confidence intervals shown in black. The p-values were calculated using Mann-Whitney U test. *p < 0.0001 for each clone relative to the WT control. Underlying numerical data for this figure can be found in the file Fig 4G in OSF repository in the project named after the paper title. (H) Model of RD mediated organization of pSMAD1. Underlying numerical data for this figure can be found in https://osf.io/zrvxj/. BMP4, bone morphogenetic protein 4; hPSC, human pluripotent stem cell; OSF, open science framework; pSMAD1, phosphorylated SMAD1; RD, reaction-diffusion; SB, SB431541 (Nodal signalling antagonist); WT, wild type.
Fig 5
Fig 5. Nodal signalling contributes to the formation of the pSMAD1 gradient.
(A–C) Perturbing Nodal signalling results in a significant change in the pSMAD1 organized gradient formation. (A) Average pSMAD1 intensity detected with colonies were treated with 25 ng/ml of BMP4 for 24 h either in the presence of Nodal or SB represented as overlays of 188 and 163 colonies for Nodal and SB conditions, respectively. Data pooled from 2 experiments. (B) The average radial trends of pSMAD1 for SB and Nodal conditions when treated with 25 ng/ml of BMP4 shown as line plots. SDs shown in black. The p-values were calculated using Mann-Whitney U test. *p < 0.0001. Underlying numerical data for this figure can be found in the file Fig 5B in OSF repository in the project named after the paper title. (C) Representative immunofluorescence images of 500 μm diameter hPSC colonies stained for pSMAD1 after 24 h of BMP4 treatment (25 ng/ml) in ‘Nodal’ and ‘SB’ conditions (average response shown in panel A). Scalebar represents 200 μm. White arrows indicate regions where second peak of pSMAD1 appears. White triangles indicate regions of discernable pSMAD1 levels that appear to be lower than the levels at the colony periphery. (D–E) Changes in the activator and antagonists of BMP signalling upon perturbation of Nodal signalling. (D) BMP4 expression after 24 h of treatment of hPSCs with BMP4 containing media supplemented with either Nodal or SB. (E) CER1 expression after 24 h of treatment of hPSCs with BMP4 containing media supplemented with either Nodal or SB. Data in panels D and E represent 3 biological replicates and are shown as normalized (with respect to the expression observed in Nodal supplemented media) fold change relative to the Day 0 hPSC population for each biological replicate. The p-values were calculated using two-sided paired t-test. (F–H) siRNA mediated inhibition of CER1 increases the level of pSMAD1 detected in an interior band of the hPSC colonies when treated with BMP4 and Nodal. The experiments described in panels F through H were repeated twice. (F) CER1 expression controls for the 2 experiments in panels G and H showing a change in the levels of CER1 transcripts detected in the presence of a CER1 siRNA or a nontargeting siRNA. (G) Average radial trends of pSMAD1 for CER1 siRNA (45 colonies) and nontargeting siRNA (37 colonies) conditions shown as line plots. SDs shown in black. The p-values were calculated using Mann-Whitney U test. *p < 0.0001. (H) Representative immunofluorescent images of observed pSMAD1 staining for the condition when the colonies were treated with a CER1 siRNA versus a nontargeting siRNA. (I) Model of involvement of Nodal in the contribution to the pool of BMP signalling antagonists that govern the RD response observed in the BMP signalling pathway. BMP4 activates itself and its inhibitors like Noggin. In addition to Nodal signalling activating in the experiments because of the Nodal ligands present in the induction medium, BMP4 can also activate Nodal through Wnt, or Nodal can be induced because of a community effect in dense cultures. Nodal in turn can activate downstream targets like CER1 that are BMP antagonists, which contribute to a pool of BMP antagonists ‘BMPi’ that together antagonize BMP signalling. Underlying numerical data for this figure can be found in https://osf.io/zrvxj/. BMP4, bone morphogenetic protein 4; CER1, Cerberus; hPSC, human pluripotent stem cell; OSF, open science framework; pSMAD1, phosphorylated SMAD1; RD, reaction-diffusion; SB, SB431542 (Nodal signalling antagonist); siRNA, small interfering RNA.
Fig 6
Fig 6. Preneurulation-like fates arise in a manner consistent with PI.
(A) Representative immunofluorescence images of 500 μm diameter colonies stained for SOX2 and GATA3 after different doses (6.25 ng/ml, 12.5 ng/ml, 25 ng/ml, and 50 ng/ml) and times of BMP4 treatment. Scale bar represents 200 μm. (B) Mean expression levels of SOX2 and GATA 3 represented as heat maps. Darker shades represent higher expression levels, and lighter shades represent lower levels of expression (for detailed data see S17 Fig). (Ci–ii) Model of GATA3 patterning. (i) Overview of (B) in which GATA3 is expressed as a function of BMP4 dose and induction time. (ii) Fate patterning of GATA3 consistent with PI. ‘T’ indicates the presumptive threshold of fate switch to GATA3. (D) Treatment of geometrically confined hPSC colonies of 3 mm diameter with 200 ng/ml of BMP4 and SB for 48 h results in multiple peaks of GATA3 expressing regions consistent with RD hypothesis. (i) Representative stitched images of 3 mm diameter hPSC colonies differentiated with 200 ng/ml of BMP4 for 48 h. Scale bar represents 1 mm. (ii) Zoomed section outlined by the white square in (i). White arrows indicate regions of high GATA3 and low SOX2 expression indicative of PI-mediated fate patterning due to presumptive localized pSMAD1 expression (please see S22 Fig). The experiment was repeated 3 times. Additional images shown in S25 Fig. (E) Overall model of pSMAD1 signalling organization governed by a reaction-diffusion–like network that contains BMP, Nodal, and BMP antagonists like Noggin, and CER1, and the fate patterning due to the signalling gradient arises in a manner consistent with PI. Underlying numerical data for this figure can be found in https://osf.io/zrvxj/. BMP4, bone morphogenetic protein 4; CER1, Cerberus; GATA3, GATA binding factor 3; hPSC, human pluripotent stem cell; PI, positional information; pSMAD1, phosphorylated SMAD1; RD, reaction-diffusion; SB, SB431542 (Nodal signalling antagonist); SOX2, SRY-box transcription factor 2.
Fig 7
Fig 7. Preneurulation-like platform can give rise to fates associated with the differentiating ectoderm.
(A) Overview of the experimental setup. Geometrically confined hPSC colonies were treated with SB and BMP4 for 24 h and then treated with one of the following conditions: SB and Noggin for 72 h and subsequently stained for PAX6; SB and CHIR99021 (CHIR) for 48 h and stained for SOX10; SB and BMP4 for 48 h and stained for DLX5 and TROMA1. (B) Expression of NP marker (PAX6) in colonies differentiated with BMP4 for 24 h and SB + Noggin for 72 h. (i) Quantified expression observed for PAX6 observed in the treated and control conditions. The number of colonies were 76 for control and 606 for treated. (ii) Immunofluorescent images of representative colonies from panel B(i) stained for PAX6, and (iii) the spatial profile of PAX6 observed in the condition of SB + NOG in panel B(i) represented as a line plot. SDs shown in grey, and 95% confidence intervals shown in black. (C) Expression of NC marker (SOX10) in colonies differentiated with BMP4 for 24 h and SB + CHIR for 48 h. (i) Quantified expression observed for SOX10 observed in the treated and control conditions. The number of colonies were 286 for control and 493 for treated. (ii) Immunofluorescent images of representative colonies stained for SOX10 and (iii) the spatial profile of SOX10 observed in the condition of SB + CHIR in panel C(i) represented as a line plot. SDs shown in grey, and 95% confidence intervals shown in black. (D) Expression of NNE markers (DLX5 and TROMA1) in colonies differentiated with BMP4 for 24 h and SB + BMP4 for 48 h. (i) Quantified expression observed for DLX5 and TROMA1 observed in the treated and control conditions. The number of colonies were 163 for control and 376 for treated. (ii) Immunofluorescent images of representative colonies stained for DLX5 and TROMA1 and (iii) the spatial profile of DLX5 and TROMA1 observed in the condition of SB + BMP4 in panel D(i) represented as a line plot. SDs shown in grey, and 95% confidence intervals shown in black. For panels B(i), C(i), and D(i), each data point represents an identified colony (as per the analysis pipeline explained in the Materials and methods), and bars represent mean ± SD. The data were pooled from 2 experiments, and the p-values were measured using Mann-Whitney U test. Please see S26 Fig for associated DAPI images. Underlying numerical data for this figure can be found in https://osf.io/zrvxj/. BMP4, bone morphogenetic protein 4; DLX5, Distal-Less Homeobox 5; hPSC, human pluripotent stem cell; NC, neural crest; NNE, NN ectoderm; NOG, Noggin; NP, neural plate; PAX6,; SB, SB431542 (Nodal signalling antagonist); SOX10, SRY-box transcription factor 10; TROMA1, cytokeratin-8 antibody clone.
Fig 8
Fig 8. Mechanism of Nodal-dependent fate patterning in the geometrically confined hPSC colonies.
(A) Overall proposed model of Nodal-mediated fate patterning regulation in geometrically confined hPSC colonies. (i) Model overview for organization of pSMAD1: An RD network in BMP signalling that comprises BMP ligands, Nodal (via BMP-Wnt-Nodal axis), and BMP antagonists organizes the pSMAD1 gradient within the geometrically confined hPSC colonies. (ii–iii) pSMAD1 organization in the presence of Nodal. (ii) BMP antagonists downstream of Nodal signalling (like CER1, GDF3, etc.) can contribute to the organization of the pSMAD1 gradient resulting in enhanced inhibitor activity. (iii) The presence of BMP antagonists in the Nodal pathway down-regulates pSMAD1 levels enforcing a sharp gradient from the colony periphery. Green region signifies region of active Nodal where down-regulation of BMP signalling is more pronounced. Dashed black line represents gradient that would arise in the absence of BMP antagonists in the Nodal pathway. Purple line represents gradient established due to pronounced inhibition of BMP signalling. (iv–v) pSMAD1 organization in the absence of Nodal. (iv) In the absence of Nodal signalling the overall level of BMP inhibitors is reduced because of removal of CER1, GDF3, and reduction in FST levels. (v) The established gradient is more gradual relative to when Nodal signalling is active. Dashed black line represents gradient that would arise in the absence of BMP antagonists in the Nodal pathway. Purple line represents gradient established independent of BMP antagonists downstream of Nodal signalling. (B) Fate patterning mediated by pSMAD1 signalling gradient. (i) Fate patterning in response to the pSMAD1 signalling gradient is consistent with PI. (ii) In the presence of Nodal signalling the fate patterning gives rise to BRA—a gastrulation-associated fate. (iii) In the absence of Nodal signalling the fate patterning gives rise to GATA3—a preneurulation-associated fate. BMP, bone morphogenetic protein; BMPi, bone morphogenetic protein inhibitors; BRA, Brachyury; CER1, Cerberus; FST, Follistatin; GATA3, GATA binding protein 3; GDF3, growth differentiation factor 3; hPSC, human pluripotent stem cell; pSMAD1, phosphorylated SMAD1; RD, reaction-diffusion.

References

    1. Hertig AT, Rock J, Adams EC. A description of 34 human ova within the first 17 days of development. Am J Anat. 1956;98(3):435–93. - PubMed
    1. Tam PPL, Loebel DAF. Gene function in mouse embryogenesis: get set for gastrulation. Nat Rev Genet. 2007;8(5):368–81. 10.1038/nrg2084 - DOI - PubMed
    1. Tam PPL, Loebel DAF, Tanaka SS. Building the mouse gastrula: signals, asymmetry and lineages. Curr Opin Genet Dev. 2006. August;16(4):419–25. 10.1016/j.gde.2006.06.008 - DOI - PubMed
    1. Rossant J, Tam PPL. Emerging Asymmetry and Embryonic Patterning in Early Mouse Development. Dev Cell. 2004;7:155–64. 10.1016/j.devcel.2004.07.012 - DOI - PubMed
    1. Nikolopoulou E, Galea GL, Rolo A, Greene NDE, Copp AJ. Neural tube closure: cellular, molecular and biomechanical mechanisms. Development. 2017;144(4):552–66. 10.1242/dev.145904 - DOI - PMC - PubMed

Publication types

MeSH terms