. 2019 Nov;575(7784):688-692.
doi: 10.1038/s41586-019-1705-2. Epub 2019 Oct 21.

The CoQ oxidoreductase FSP1 acts parallel to GPX4 to inhibit ferroptosis

Affiliations

The CoQ oxidoreductase FSP1 acts parallel to GPX4 to inhibit ferroptosis

Kirill Bersuker et al. Nature. 2019 Nov.

Abstract

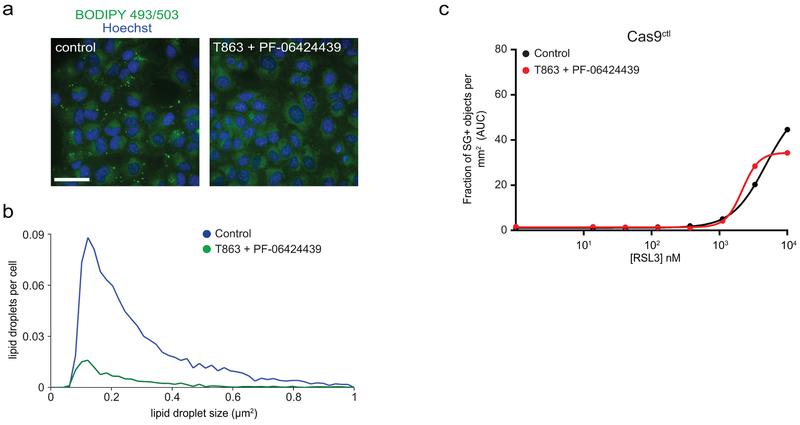
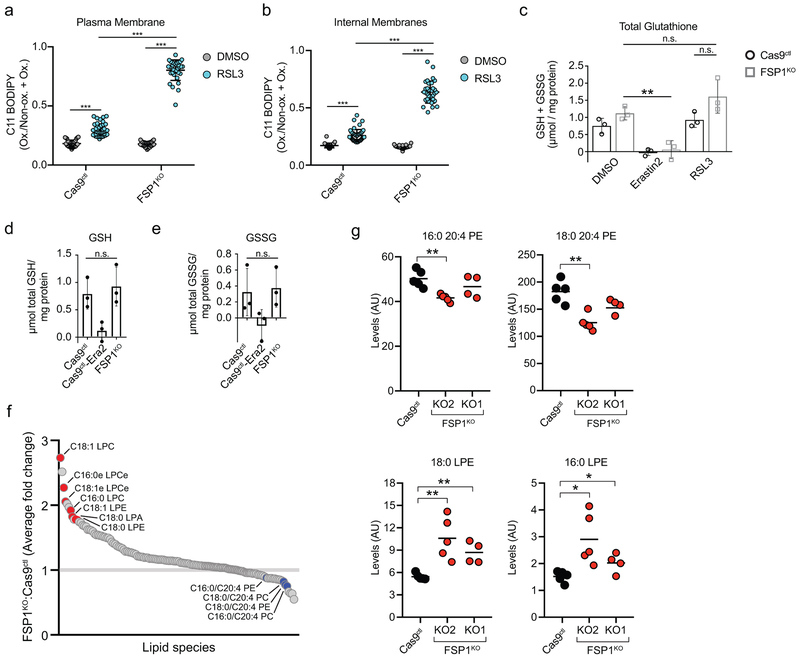
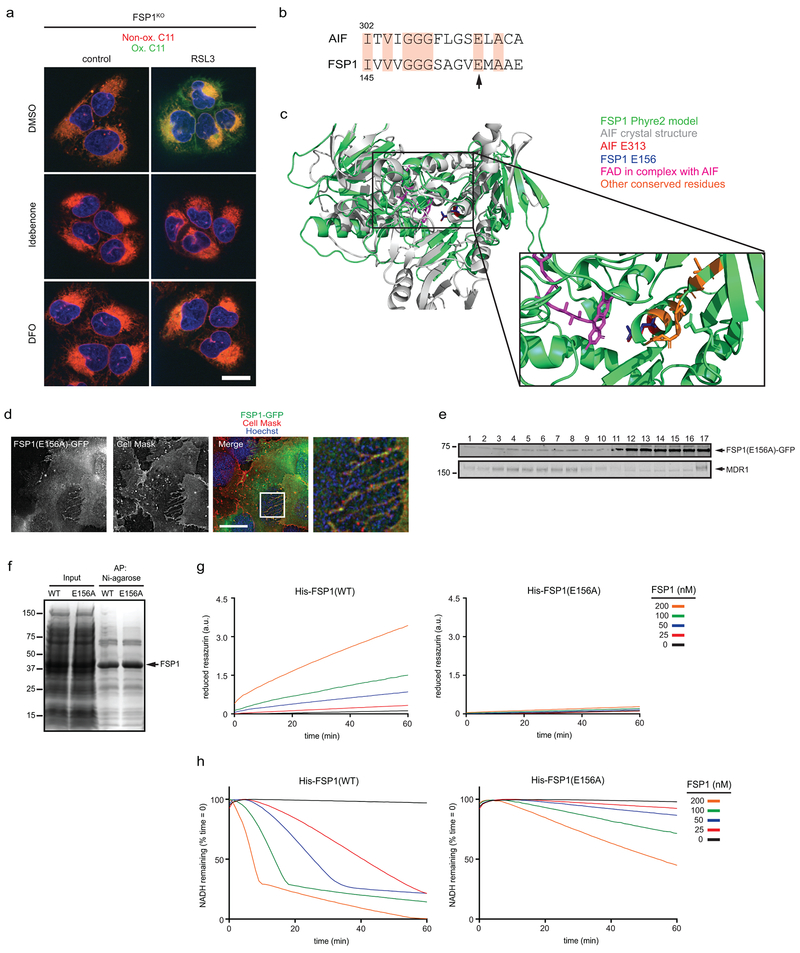
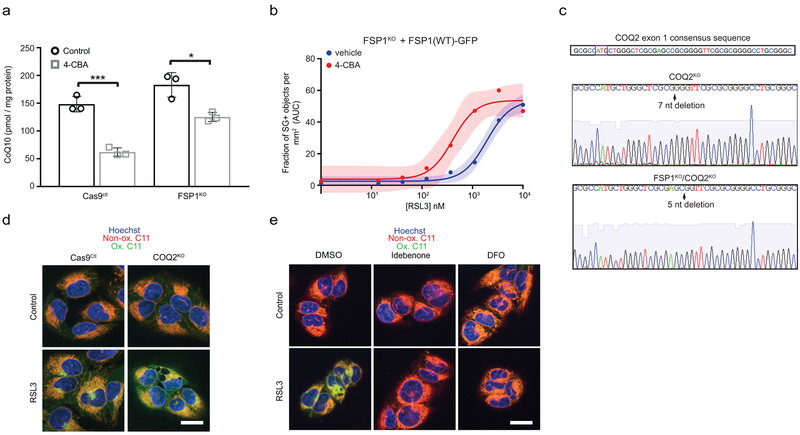
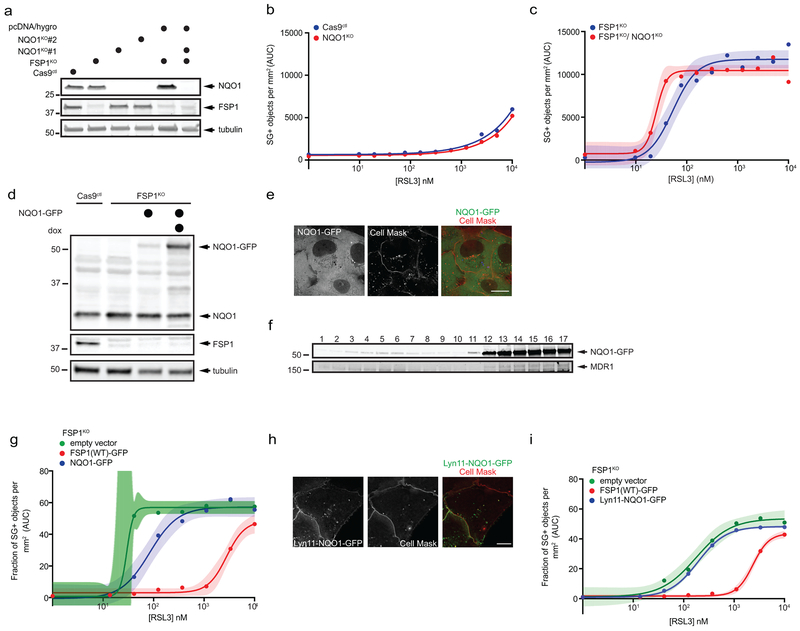
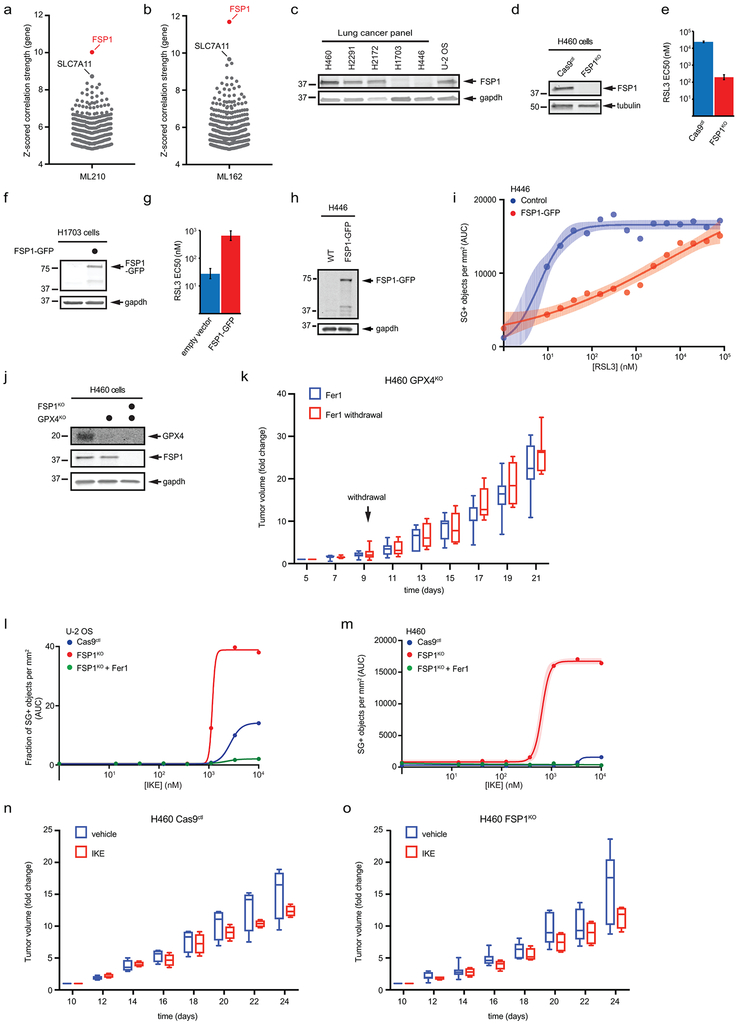
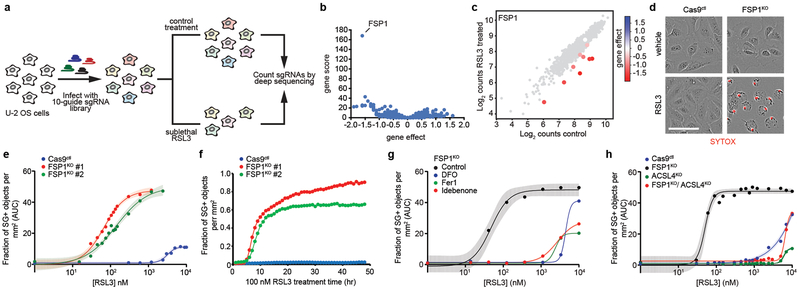
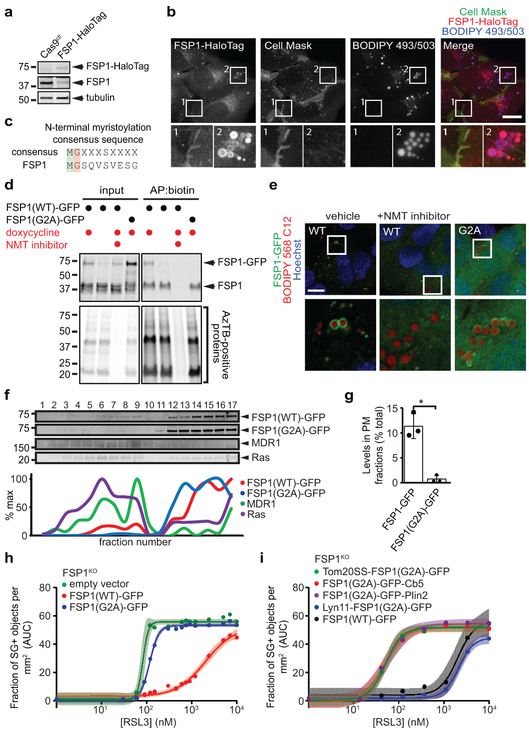
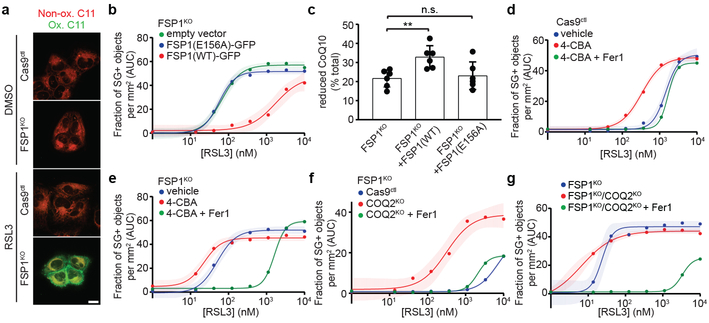
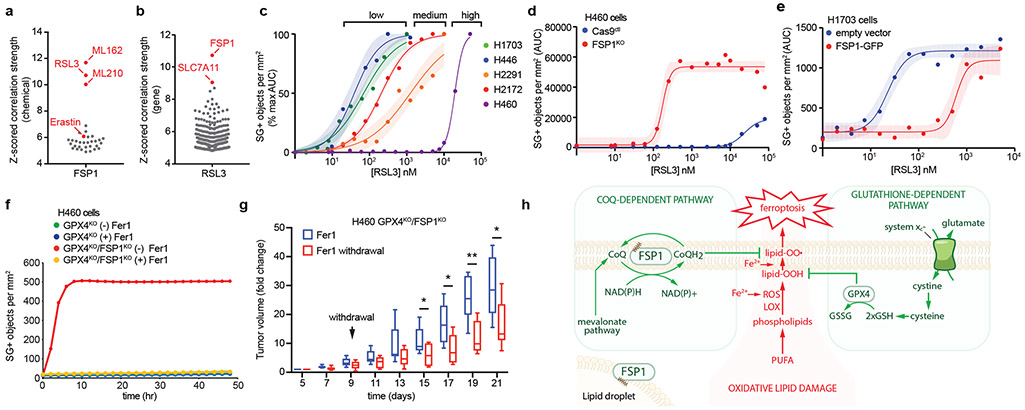
Ferroptosis is a form of regulated cell death that is caused by the iron-dependent peroxidation of lipids1,2. The glutathione-dependent lipid hydroperoxidase glutathione peroxidase 4 (GPX4) prevents ferroptosis by converting lipid hydroperoxides into non-toxic lipid alcohols3,4. Ferroptosis has previously been implicated in the cell death that underlies several degenerative conditions2, and induction of ferroptosis by the inhibition of GPX4 has emerged as a therapeutic strategy to trigger cancer cell death5. However, sensitivity to GPX4 inhibitors varies greatly across cancer cell lines6, which suggests that additional factors govern resistance to ferroptosis. Here, using a synthetic lethal CRISPR-Cas9 screen, we identify ferroptosis suppressor protein 1 (FSP1) (previously known as apoptosis-inducing factor mitochondrial 2 (AIFM2)) as a potent ferroptosis-resistance factor. Our data indicate that myristoylation recruits FSP1 to the plasma membrane where it functions as an oxidoreductase that reduces coenzyme Q10 (CoQ) (also known as ubiquinone-10), which acts as a lipophilic radical-trapping antioxidant that halts the propagation of lipid peroxides. We further find that FSP1 expression positively correlates with ferroptosis resistance across hundreds of cancer cell lines, and that FSP1 mediates resistance to ferroptosis in lung cancer cells in culture and in mouse tumour xenografts. Thus, our data identify FSP1 as a key component of a non-mitochondrial CoQ antioxidant system that acts in parallel to the canonical glutathione-based GPX4 pathway. These findings define a ferroptosis suppression pathway and indicate that pharmacological inhibition of FSP1 may provide an effective strategy to sensitize cancer cells to ferroptosis-inducing chemotherapeutic agents.


Figures

Extended Data Fig. 1.
Extended Data Fig. 1.. Synthetic lethal screen coverage and validation.
a, Distribution of counts across all sgRNA elements from the CRISPR/Cas9 screen. b, Western blot of control and FSP1KO cells. c,d, Western blot analysis (c) and dose response of RSL3-induced death (d) of FSP1KO cells expressing doxycycline-inducible, untagged FSP1. e, Time-lapse analysis of cell death of FSP1KO cells expressing inducible, untagged FSP1. f, Flow cytometric analysis of caspase 3/7 activity in FSP1KO cells expressing inducible, untagged FSP1 treated with doxycycline for 48 hr. For a positive control, non-induced cells were treated with 50 μM etoposide for 24 hr prior to analysis. g, Western blot analysis of lysates from control cells treated with 10 μM Nutlin-3 for 48 hr. h, Dose response of ML162 and Erastin2-induced cell death. i,j, Dose response of rotenone-induced death of control (i) and FSP1KO (j) cells. k,l, Dose response of hydrogen peroxide-induced death of control (k) and FSP1KO (l) cells. m, Dose response of RSL3-induced cell death in the presence of inhibitors of apoptosis (ZVAD(OMe)-FMK: 10 μM) and necroptosis (necrostatin-1: 1 μM). n, Western blot analysis of lysates from ACSL4KO and FSP1KO/ACSL4KO cells. o, Schematic of domains present in AIF and FSP1. For figures d,i-m, shading indicates 95% confidence intervals for the fitted curves and each data point is the average of 3 technical replicates. Figures are representative of two biological replicates except figures c-e and k,l, which show single experiments.
Extended Data Fig. 2.
Extended Data Fig. 2.. Subcellular distribution of FSP1.
a, Inducible FSP1-GFP cells were transiently transfected with Lyn11-mCherry-FRB for 24 hr, induced with doxycycline for 48 hr and fixed prior to imaging. b, FSP1-GFP cells were treated with 200 μM oleate for 24 hr to induce LDs and treated with 100 μM AutoDOT to label LDs prior to imaging. c, Line intensity plots showing colocalization between FSP1-HaloTag and organelle markers. d-f, Confocal and TIRF microscopy of FSP1-HaloTag (d), and inducible FSP1(WT)-GFP (e) and FSP1(G2A)-GFP (f) cells. g, FSP1-HaloTag cells were transiently transfected with BFP-Sec61 for 48 hr prior to imaging to label the endoplasmic reticulum. h, FSP1-HaloTag cells were incubated with 100 nM MitoTracker Green FM to label mitochondria. i, Plasma membrane subdomains from control cells were enriched by OptiPrep gradient centrifugation. Endo., endogenous FSP1. Western blot is representative of two biological replicates. Images are representative of at least n = 10 imaged cells. Image scale bars = 10 μm.
Extended Data Fig. 3.
Extended Data Fig. 3.. Myristoylation and lipid droplet localization of FSP1.
a, Schematic showing the procedure for metabolic labeling of cells with the myristate-alkyne YnMyr and conjugation of YnMyr-labeled proteins with TAMRA-biotin using click chemistry. b, Analysis of FSP1 myristoylation in LD-enriched buoyant fractions by streptavidin enrichment of YnMyr-labeled proteins, click chemistry and SDS-PAGE. Cells were treated with 200 μM oleate to induce LDs and with 100 μM YnMyr or 100 μM myristate for 24 hr. c, FSP1-GFP was induced with doxycycline for 24 hr and cells were incubated with 100 μM YnMyr for an additional 24 hr to label proteins in the presence or absence of 75 μM emetine. YnMyr-labeled proteins were affinity-purified and analyzed by click chemistry and SDS-PAGE. d, LD-enriched buoyant fractions from cells expressing inducible FSP1-GFP were isolated by sucrose gradient fractionation and analyzed by western blot. Endo., endogenous FSP1. e, Inducible FSP1-GFP cells were treated with 200 μM oleate in the presence or absence of 10 μM NMT inhibitor, fixed, and stained with anti-PLIN2 antibody prior to imaging. Images are representative of at least n = 10 imaged cells. Scale bar = 10 μm. f, Western blot analysis of FSP1KO cells induced for 48 hr with doxycycline to express the indicated proteins. All figures are representative of two biological replicates.
Extended Data Fig. 4.
Extended Data Fig. 4.. Targeting of FSP1 to subcellular compartments.
a, Western blot analysis of FSP1KO cells induced for 48 hr with doxycycline to express the indicated proteins. b, Live cell microscopy of cells expressing the indicated FSP1(G2A)-GFP constructs, incubated with 100 nM Mitotracker Orange to label mitochondria, 1 μM BODIPY 558/568 C12 to label LDs or 5 μg/mL Cell Mask to label the plasma membrane. To label the endoplasmic reticulum, cells were transiently transfected with BFP-Sec61 48 hr prior to imaging. Images are representative of at least n = 10 imaged cells. Line intensity plots show colocalization between FSP1 and organelle markers. Scale bar = 10 μm. c, Plasma membrane subdomains from FSP1KO cells expressing inducible Lyn11-FSP1(G2A)-GFP were enriched by OptiPrep gradient centrifugation. The densitometry plot indicates the distribution of overexpressed and endogenous proteins. Figures are representative of two biological replicates except figure c, which shows a single experiment.
Extended Data Fig. 5.
Extended Data Fig. 5.. Lipid droplets are not required for inhibition of ferroptosis by FSP1.
a, Control cells were treated with inhibitors of DGAT1 (20 μM T863) and DGAT2 (10 μM PF-06424439) for 48 hr, stained with 1 μM BODIPY 493/503 and imaged by fluorescence microscopy. The image is representative of n = 50 imaged fields. Scale bar = 10 μm. b, The size and number of LDs were quantified from cells (n > 5000) in panel (a). c, Dose response of RSL3-induced cell death of control cells pretreated for 48 hr with 20 μM T863 and 10 μM PF-06424439 prior to addition of RSL3. Each data point is the average of 3 technical replicates. All figures are representative of two biological replicates.
Extended Data Fig. 6.
Extended Data Fig. 6.. Analysis of lipid peroxidation, glutathione and lipid levels in FSP1KO cells.
a,b, Ratio of oxidized to total BODIPY 581/591 C11 from images in figure 3a, at the plasma membrane (b) or at internal membranes (c). Each data point represents an individual cell quantified in one of two biological replicates. For (a), Cas9ctl DMSO, n = 34; Cas9ctl RSL3, n = 45; FSP1KO DMSO, n = 30; FSP1KO RSL3, n = 33; ***P < 0.001 by one-way ANOVA. For (b), Cas9ctl DMSO, n = 33; Cas9ctl RSL3, n = 45; FSP1KO DMSO, n = 30; FSP1KO RSL3, n = 33; ***P < 0.001 by one-way ANOVA. Error bars show mean ± SD. c, Total intracellular glutathione (GSH + GSSG) levels in control and FSP1KO were determined following treatment with 250 nM RSL3 or 1 μM Erastin2. The graph shows mean ± SD of n = 3 biological replicates. n.s., FSP1KO DMSO versus RSL3, P = 0.7278; n.s., FSP1KO RSL3 versus Cas9ctl RSL3, P = 0.1522, **P = 0.0072 by one-way ANOVA. d,e, GSH and GSSG levels in control and FSP1KO were measured. Where indicated, cells were treated with 1 μM Erastin2. The graph shows mean ± SD of n = 3 biological replicates. n.s., GSH P = 0.6269; n.s., GSSG P = 0.8284 by two-tailed t-test. f, The plot shows the average of the fold change in lipids measured in two FSP1KO cell lines, generated using sgRNA 1 and sgRNA 2, relative to control cells. Cas9ctl, n = 5; KO1, n = 4; KO2, n = 5 biological replicates (Supplemental Table 3). g, Levels of select lipid species in biological replicates of control and FSP1KO cells measured in (f). The average values are indicated. 16:0 20:4 PE, **P = 0.0017; 18:0 20:4 PE, **P = 0.0011; 18:0 LPE, KO2 **P = 0.0036, KO1 **P = 0.0019; 16:0 LPE, KO2 *P = 0.0133, KO1 *P = 0.0335 by two-tailed t-test.
Extended Data Fig. 7.
Extended Data Fig. 7.. Analysis of the FSP1 oxidoreductase mutant.
a. FSP1KO cells were treated with 250 nM RSL3 and 10 μM idebenone or 50 μM DFO for 75 min, labeled with BODIPY 581/591 C11 and fixed prior to imaging. Ox. = oxidized; Non-ox. = non-oxidized. Images are representative of at least n = 10 cells imaged for each treatment condition. Scale bar = 20 μm. b, Sequence alignment showing residues conserved between AIF and FSP1. The arrow points to E313 in AIF (aligns to E156 in FSP1) that functions in FAD binding. c, Structural alignment between the crystal structure of mouse AIF (PDB 1GV4) and the Phyre2-generated model of FSP1. d, Live cell microscopy of FSP1KO cells expressing inducible FSP1(E156A)-GFP labeled with 5 μg/mL Cell Mask. The image is representative of at least n = 10 imaged cells. Scale bar = 10 μm. e, Plasma membrane subdomains from FSP1KO cells expressing FSP1(E156A)-GFP were enriched by OptiPrep gradient centrifugation. f, SDS-PAGE and Coomassie brilliant blue stain of recombinant His-FSP1(WT) and His-FSP1(E156A) purified with Ni-NTA agarose beads. g, Reduction of resazurin by recombinant FSP1 in the presence of NADH. h, Oxidation of NADH by recombinant FSP1 in the presence of coenzyme Q1. Figures g,h are representative of two biological replicates, and figure e shows a single experiment.
Extended Data Fig. 8.
Extended Data Fig. 8.. Lipid peroxidation in CoQ-depleted cells.
a, Total CoQ levels in control and FSP1KO cells treated for 48 hr with 3 mM 4-CBA. The graph shows mean ± SD of n = 3 biological replicates. ***P = 0.0007; *P = 0.0132 by two-tailed t-test. b, Dose response of RSL3-induced death of inducible FSP1-GFP cells pretreated for 48 hr with 3 mM 4-CBA and doxycycline prior to addition of RSL3. Shading indicates 95% confidence intervals for the fitted curves and each data point is the average of 3 technical replicates. The figure is representative of two biological replicates. c, Genomic sequencing of the COQ2 gene in COQ2KO and FSP1KO/COQ2KO cells. The ATG start codon is boxed in the COQ2 consensus sequence. d, Control and COQ2KO cells treated with 250 nM RSL3 for 3 hr were labeled with BODIPY 581/591 C11 and fixed prior to imaging. Ox. = oxidized; Non-ox. = non-oxidized. e, COQ2KO cells were treated with 250 nM RSL3 and 10 μM idebenone or 50 μM DFO for 3 hr, labeled with BODIPY 581/591 C11 and fixed prior to imaging. Ox. = oxidized; Non-ox. = non-oxidized. For figures d,e, images are representative of at least n = 10 cells imaged for each treatment condition. Image scale bars = 20 μm.
Extended Data Fig. 9.
Extended Data Fig. 9.. Role of NQO1 in ferroptosis resistance.
a, Western blot analysis of lysates from NQO1KO and NQO1KO/FSP1KO cells. b, Dose response of RSL3-induced death of control and NQO1KO cells. c, Dose response of RSL3-induced death of FSP1KO and NQO1KO/FSP1KO cells. Cells in (b,c) were generated using NQO1 sgRNA 1. d, Western blot analysis of lysates of FSP1KO cells expressing doxycycline-inducible NQO1-GFP. e, Live cell microscopy of inducible NQO1-GFP cells labeled with 5 μg/mL Cell Mask. f, Plasma membrane subdomains from FSP1KO cells expressing NQO1-GFP were enriched by OptiPrep gradient centrifugation. g, Dose response of RSL3-induced death of FSP1KO cells expressing the indicated inducible constructs. h, Live cell microscopy of FSP1KO cells expressing inducible Lyn11-NQO1-GFP cells labeled with 5 μg/mL Cell Mask. i, Dose response of RSL3-induced death of FSP1KO expressing the indicated inducible constructs. For figures b,c,g,i, shading indicates 95% confidence intervals for the fitted curves and each data point is the average of 3 technical replicates. Figures are representative of two biological replicates except figures f,I, which show the results of single experiments. For figures e,h, the images are representative of at least n = 10 imaged cells. Image scale bars = 10 μm.
Extended Data Fig. 10.
Extended Data Fig. 10.. The role of FSP1 in cancer.
a,b, High expression of FSP1 is correlated with resistance to the GPX4 inhibitors ML210 (a) and ML162 (b) in non-hematopoietic cancer cells. Plotted data was mined from the CTRP database that contains correlation coefficients between gene expression and drug sensitivity for 907 cancer cell lines treated with 545 compounds. Plotted values are z-scored Pearson’s correlation coefficients. c, Western blot of FSP1 expression in a panel of lung cancer lines. d, Western blot of lysates from control and FSP1KO H460 cells. e, EC50 RSL3 dose for the indicated H460 cell lines was calculated from the results in Fig. 1d. Bars indicate 95% confidence intervals. f, Western blot of lysates from control and H1703 cells. g, EC50 RSL3 dose for the indicated H1703 cell lines was calculated from the results in Fig. 1e. Bars indicate 95% confidence intervals. h, Western blot analysis of H446 cells expressing doxycycline-inducible FSP1-GFP. i, Dose response of RSL3-induced death of control and FSP1-GFP H446 cells. j, Western blot of lysates from GPX4KO and GPX4KO/FSP1KO H460 cells. k, GPX4KO H460 tumor xenografts cells were initiated in immune-deficient SCID mice (n = 16). Following 5 days of daily Fer1 injections (2 mg/kg) to allow lines to develop tumors, one set of mice (n = 8) continued to receive daily Fer1 injections and a second set (n = 8) received vehicle injections for the remaining 17 days. The distribution of fold changes in sizes of individual tumors during the treatment is shown. GPX4KO (−) Fer1, n = 7; GPX4KO (+) Fer1, n = 7. l, Dose response of IKE-induced death of control and FSP1KO U-2 OS cells. m, Dose response of IKE-induced death of control and FSP1KO H460 cells. n,o, Control (n) and FSP1KO (o) H460 tumor xenografts were initiated in immune-deficient SCID mice (n = 16). After 10 days, each group of mice (n = 8) was injected daily with 40 mg/kg IKE or vehicle. The distribution of fold changes in sizes of individual tumors during the treatment is shown. Cas9KO (−) IKE, n = 4; Cas9KO (+) IKE, n = 4; FSP1KO (−) IKE, n = 7; FSP1KO (+) IKE, n = 4. For figures k,n,o box plots show median, 25th and 75th percentiles, minima and maxima of the distributions. Figures are representative of two biological replicates expect figures l,m, which show the results of single experiments. For figures i,l,m, shading indicates 95% confidence intervals for the fitted curves and each data point is the average of 3 technical replicates.
Fig. 1.
Fig. 1.. A synthetic lethal CRISPR/Cas9 screen identifies FSP1 as a ferroptosis resistance factor.
a, Schematic of the CRISPR/Cas9 screening strategy. b, Gene effect and gene score calculated for individual genes analyzed in the CRISPR/Cas9 screen. c, Cloud plot indicating count numbers corresponding to FSP1 (color scale) and control (gray) sgRNAs. The gene effect of individual FSP1 sgRNAs is indicated by the heat map. d, Live cell imaging of control and FSP1KO cells incubated with SYTOX Green (SG+) and treated with 100 nM RSL3 for 48 hr. Scale bar = 75 μm. e, Dose response of RSL3-induced cell death of control and FSP1KO cells. f, Time-lapse cell death analysis of cells treated with 100 nM RSL3 over 48 hr. g, Dose response of RSL3-induced cell death in the presence of inhibitors of ferroptosis (Fer1: 1 μM, DFO: 100 μM, Idebenone: 10 μM), h, Dose response analysis of RSL3-induced cell death of the indicated cell lines. ACSL4KO and ACLS4KO/FSP1KO lines shown were generated using ACSL4 sgRNA #1. For figures e,g,h, shading indicates 95% confidence intervals for the fitted curves and each data point is the average of 3 technical replicates. Panels are representative of 2 biological replicates, except for figures b,c, which were derived from a single screen.
Fig. 2.
Fig. 2.. Myristoylation-dependent recruitment of FSP1 to the plasma membrane promotes ferroptosis resistance.
a, Western blot of lysates from FSP1-HaloTag genomic knock-in cells. b, FSP1-HaloTag subcellular distribution by live cell microscopy. Cells were incubated with 100 nM JF549 to label FSP1-HaloTag, 5 μg/mL Cell Mask to label the plasma membrane and 1 μg/mL BODIPY 493/503 to label LDs. c, Consensus myristoylation sequence in FSP1. d, Analysis of FSP1-GFP myristoylation in whole cell lysates of the indicated cell lines treated for 24 hr with doxycycline to induce FSP1-GFP expression. Where indicated, 10 μM NMT inhibitor was added for 24 hr to inhibit myristoylation. e, Live cell microscopy of inducible FSP1-GFP cell lines treated with 200 μM oleate and 1 μM BODIPY 558/568 C12. Where indicated, cells were treated concurrently with 10 μM NMT inhibitor. f, Subcellular fractionation of organelles from cells expressing FSP1-GFP using OptiPrep gradient centrifugation. The densitometry plot shows the distribution of the indicated overexpressed and endogenous proteins. g, Quantification of FSP1-GFP levels in fractions 1-10 in (f) The graph shows mean ± SD of n = 3 biological replicates. *P = 0.0124 by two-tailed t-test. h, Dose response of RSL3-induced death of FSP1KO cells pretreated with doxycycline for 48 hr to induce expression of the indicated FSP1-GFP proteins. i, Dose response of RSL3-induced death of FSP1KO cells expressing the indicated inducible FSP1(G2A)-GFP constructs. For figures h,i, shading indicates 95% confidence intervals for the fitted curves and each data point is the average of 3 technical replicates. All figures are representative of two biological replicates. Images are representative of at least n = 10 imaged cells. Image scale bars = 10 μm.
Fig. 3.
Fig. 3.. FSP1 suppresses lipid peroxidation by reducing CoQ.
a, Control and FSP1KO cells treated with 250 nM RSL3 for 75 min were labeled with BODIPY 581/591 C11 and fixed prior to imaging. Ox. = oxidized; Non-ox. = non-oxidized. Images are representative of at least 30 cells imaged for each treatment condition. Scale bar = 20 μm. b, Dose response of RSL3-induced cell death of FSP1KO cells expressing the indicated inducible FSP1-GFP constructs. c, Reduced to oxidized CoQ ratio in FSP1KO and FSP1KO cells expressing the indicated FSP1-GFP constructs. Data represent mean ± SD of n = 6 biological replicates. **P = 0.0178; n.s., P > 0.99 by one-way ANOVA. d,e, Dose response of RSL3-induced death of control (d) and FSP1KO (e) cells pretreated for 24 hr with 3 mM 4-CBA. f,g, Dose response of RSL3-induced cell death of COQ2KO (f) and FSP1KO/COQ2KO (g) cells. For figures b,d-g, shading indicates 95% confidence intervals for the fitted curves and each data point is the average of 3 technical replicates. All figures are representative of two biological replicates.
Fig. 4.
Fig. 4.. FSP1 mediates ferroptosis resistance in lung cancer.
a,b, High expression of FSP1 is correlated with resistance to GPX4 inhibitors in non-hematopoietic cancer cells. Plotted data was mined from the CTRP database that contains correlation coefficients between gene expression and drug sensitivity for 907 cancer cell lines treated with 545 compounds. (a) shows the correlation between FSP1 expression and resistance to individual compounds and (b) shows the correlation between expression levels of individual genes and resistance to RSL3. Plotted values are z-scored Pearson’s correlation coefficients. c, Dose response of RSL3-induced cell death of the indicated cell lines. d, Dose response of RSL3-induced cell death of control and FSP1KO H460 cells. e, Dose response of RSL3-induced cell death of FSP1-GFP H1703 cells. f, Time lapse analysis of cell death of GPX4KO and GPX4KO/FSP1KO H460 cells in the presence and absence of 1 μM Fer1. g, GPX4KO/FSP1KO H460 tumor xenografts cells were initiated in immune-deficient SCID mice (n = 16). Following 5 days of daily Fer1 injections (2 mg/kg) to allow the cell lines to develop tumors, one set of mice (n = 8) continued to receive daily Fer1 injections and a second set (n = 8) received vehicle injections for the remaining 17 days. The distribution of fold changes in sizes of individual tumors during the treatment is shown. GPX4KO/FSP1KO (−) Fer1, n = 7); GPX4KO/FSP1KO (+) Fer1, n = 8. Box plots indicate median, 25th and 75th percentiles, minima and maxima of the distributions. Day 15, *P = 0.0397; Day 17, *P = 0.0187; Day 18, **P = 0.0025; Day 21, *P = 0.0327 by two-tailed t-test. h, Model illustrating the mechanism by which FSP1 suppresses ferroptosis. For figures c-e, shading indicates 95% confidence intervals for the fitted curves and each data point is the average of 3 technical replicates. Figures c-f are representative of two biological replicates.

Comment in

Similar articles

Cited by

References

    1. Dixon SJ et al. Ferroptosis: an iron-dependent form of nonapoptotic cell death. Cell 149, 1060–1072 (2012). - PMC - PubMed
    1. Stockwell BR et al. Ferroptosis: A regulated cell death nexus linking metabolism, redox biology, and disease. Cell 171, 273–285 (2017). - PMC - PubMed
    1. Yang WS et al. Regulation of ferroptotic cancer cell death by GPX4. Cell 156, 317–331 (2014). - PMC - PubMed
    1. Ingold I et al. Selenium Utilization by GPX4 Is Required to Prevent Hydroperoxide-Induced Ferroptosis. Cell 172, 409–422.e21 (2018). - PubMed
    1. Dixon SJ & Stockwell BR The hallmarks of ferroptosis. Annu. Rev. Cancer Biol 3, 35–54 (2019).

Publication types

Substances