. 2019 Oct 19;11(10):2525.
doi: 10.3390/nu11102525.

Vitamins D and E Stimulate the PI3K-AKT Signalling Pathway in Insulin-Resistant SK-N-SH Neuronal Cells

Affiliations

Vitamins D and E Stimulate the PI3K-AKT Signalling Pathway in Insulin-Resistant SK-N-SH Neuronal Cells

Amirah Salwani Zaulkffali et al. Nutrients. .

Abstract

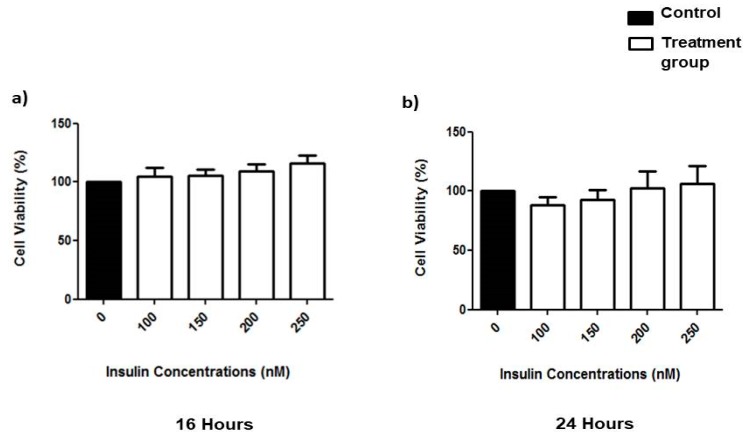
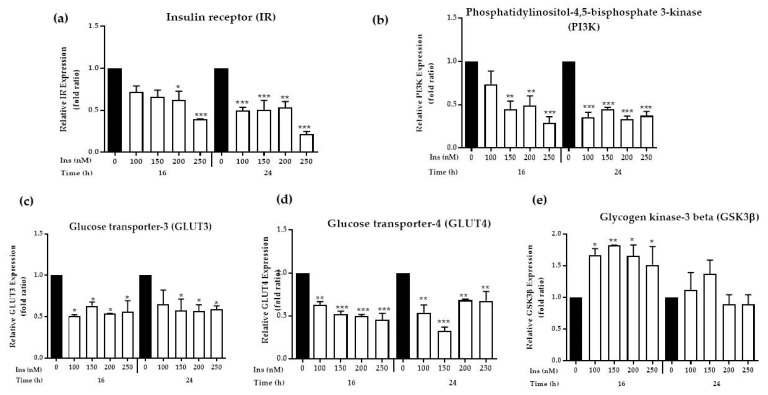
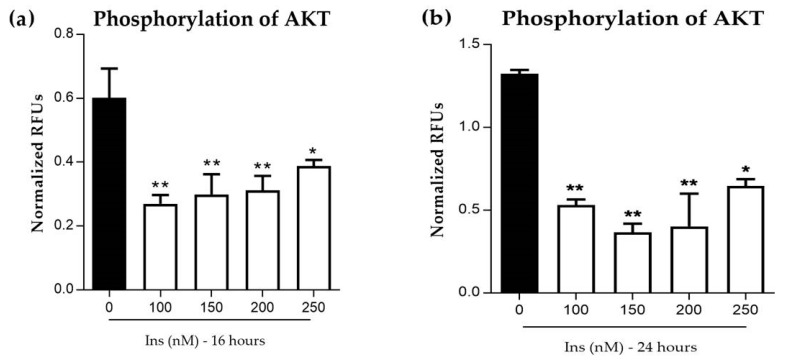
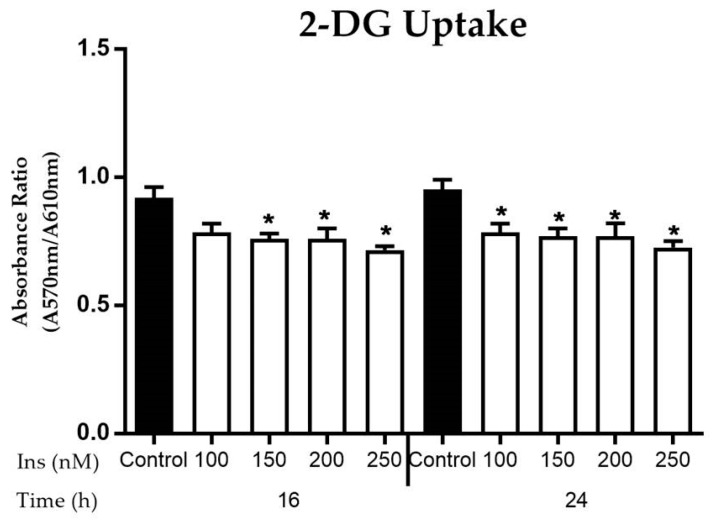
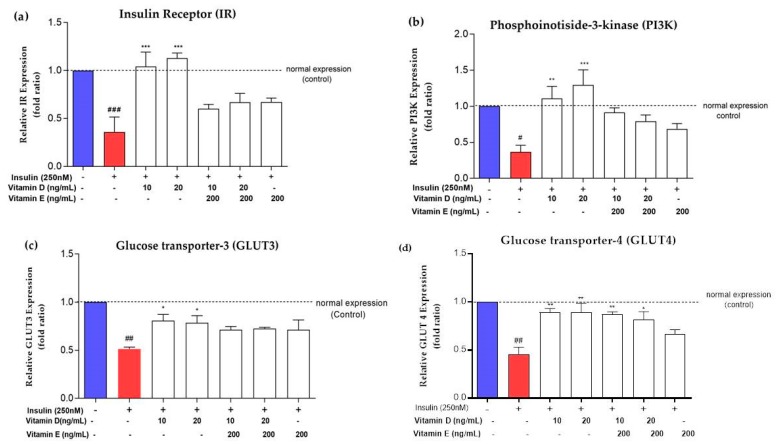
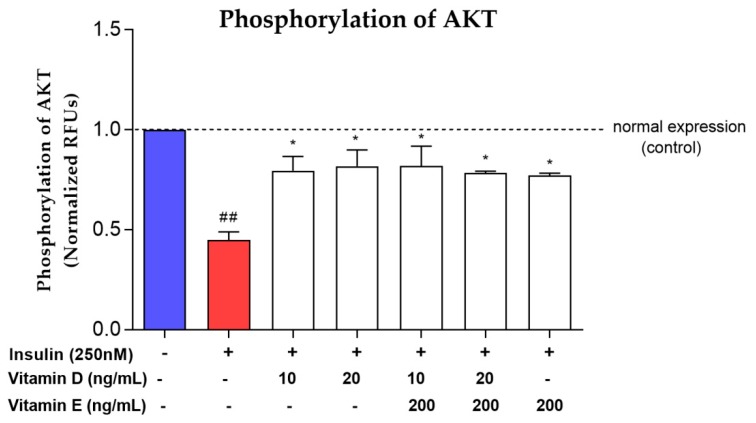
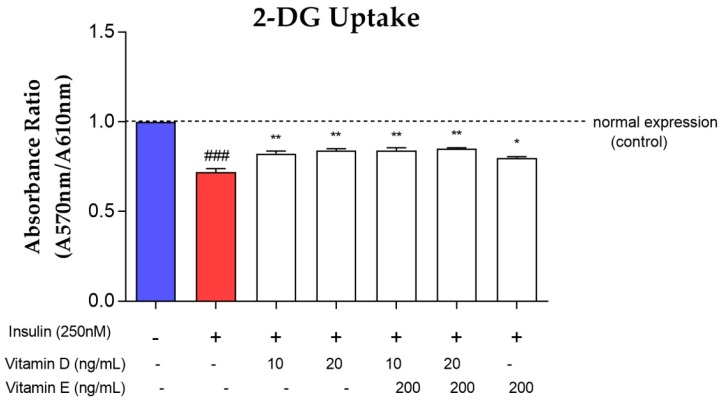
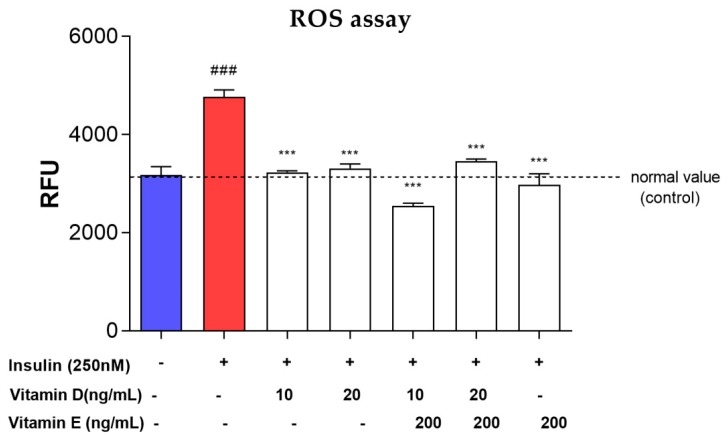
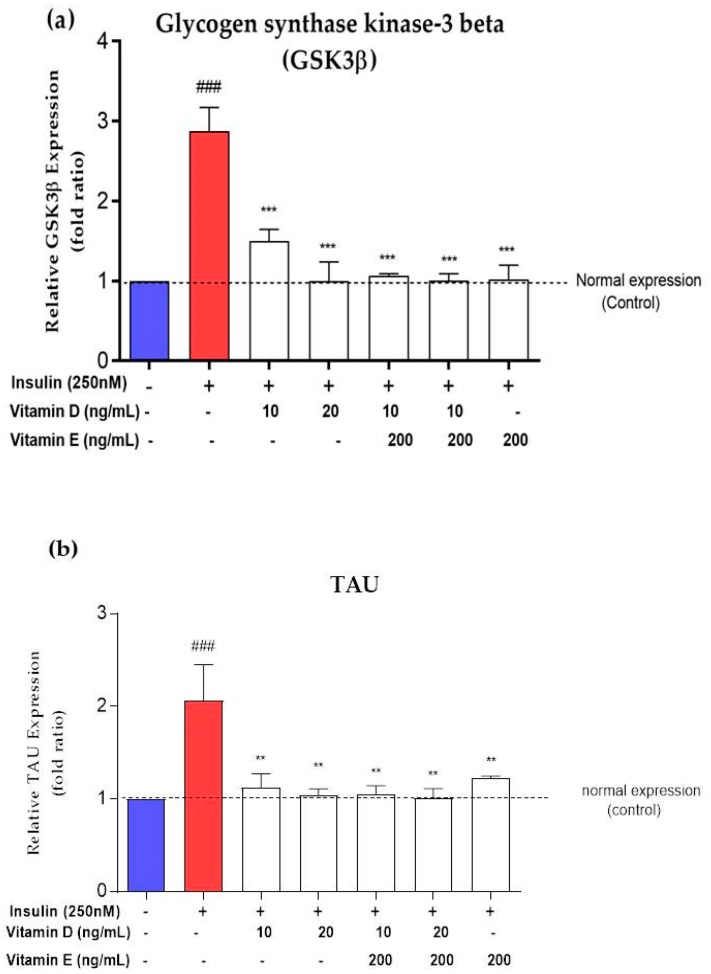
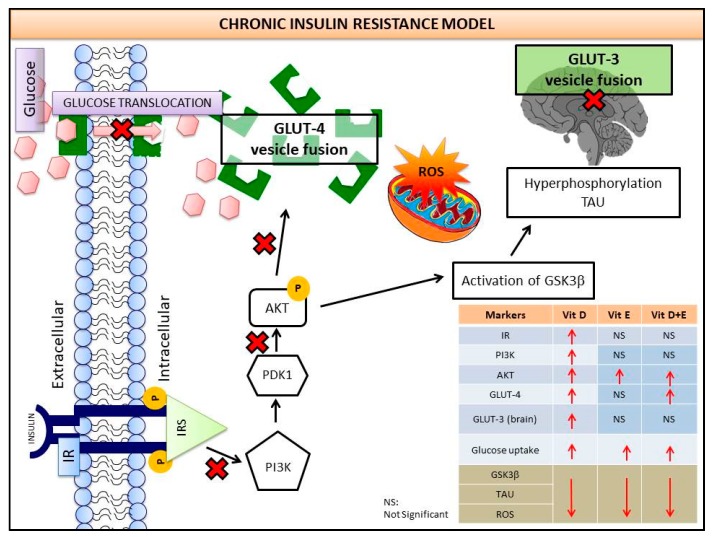
This study investigated the effects of vitamins D and E on an insulin-resistant model and hypothesized that this treatment would reverse the effects of Alzheimer's disease (AD) and improves insulin signalling. An insulin-resistant model was induced in SK-N-SH neuronal cells with a treatment of 250 nM insulin and re-challenged with 100 nM at two different incubation time (16 h and 24 h). The effects of vitamin D (10 and 20 ng/mL), vitamin E in the form of tocotrienol-rich fraction (TRF) (200 ng/mL) and the combination of vitamins D and E on insulin signalling markers (IR, PI3K, GLUT3, GLUT4, and p-AKT), glucose uptake and AD markers (GSK3β and TAU) were determined using quantitative real-time polymerase chain reaction (qRT-PCR) and enzyme-linked immunosorbent assay (ELISA). The results demonstrated an improvement of the insulin signalling pathway upon treatment with vitamin D alone, with significant increases in IR, PI3K, GLUT3, GLUT4 expression levels, as well as AKT phosphorylation and glucose uptake, while GSK3β and TAU expression levels was decreased significantly. On the contrary, vitamin E alone, increased p-AKT, reduced the ROS as well as GSK3β and TAU but had no effect on the insulin signalling expression levels. The combination of vitamins D and E only showed significant increase in GLUT4, p-AKT, reduced ROS as well as GSK3β and TAU. Thus, the universal role of vitamin D, E alone and in combinations could be the potential nutritional agents in restoring the sensitivity of neuronal cells towards insulin and delaying the pathophysiological progression of AD.

Keywords: SK-N-SH neuronal cells; glucose uptake; insulin resistance; vitamin D; vitamin E.


Conflict of interest statement

The authors declare no conflict of interest.

Figures

Figure 1
Figure 1
Effects of prolonged insulin induction on cell viability with different concentrations (100–250 nM) in SK-N-SH cell line incubated for (a) 16 and (b) 24 h, respectively. Cell viability was measured with an MTT assay. Data were expressed as mean ± SEM of three independent experiments.
Figure 2
Figure 2
Effects of prolonged insulin induction on insulin signal transduction cascade in SK-N-SH cells line. Serum deprived cells were incubated in the absence (control) or presence of insulin for 16 and 24 h, and challenged with 100 nM insulin for 30 minutes. Total RNAs were prepared and subjected to reverse transcriptase. The resulting cDNAs were used to perform Real-time PCR as described in Section 2.5 using specific primers for (a) IR; (b) PI3K; (c) GLUT3; (d) GLUT4 and (e) GSK3β. GAPDH was used to normalize the expression level. Data were expressed as mean ± SEM of three independent experiments. Significant values were expressed as * p < 0.05, ** p < 0.01 and *** p < 0.001 compared to the negative control group.
Figure 3
Figure 3
Effects of prolonged insulin induction with 100–250 nM concentrations on protein kinase B (AKT) phosphorylation. (a) A relative (p)-AKT phosphorylation was measured using Phospho-AKT Immunoassay ELISA at 16 h of exposure with insulin; while (b) at 24 h and both were re-challenged with 30 min induction. Relative p-AKT levels were normalized to total AKT and are shown as fold increase over control (0 nM of insulin). All data were expressed as mean ± SEM of three independent experiments. Significant values were expressed as * p < 0.05 and ** p < 0.01 compared to the negative control group.
Figure 4
Figure 4
Effects of insulin exposure at 150–250 nM concentrations on 2-D-Glucose (2-DG) uptake after incubation at 16 and 24 h. The cells were subjected to prolonged exposure at 16 and 24 h with re-challenged for 30 min. The induced groups were compared with the control group (0 nM of insulin). Results were expressed as mean ± SEM of three independent experiments. Significant values were expressed as * p < 0.05 compared to the negative control group.
Figure 5
Figure 5
Gene expression levels of (a) IR (b) PI3K (c) GLUT3 and (d) GLUT4 after treatment with vitamins D and E at different concentrations. Red bar represents the expression level upon induction with 250 nM insulin for 16 h. White bar represents the expression level treated with vitamins D and E for 24 h after induced with 250 nM insulin. Relative expression of IR, PI3K, GLUT3, and GLUT4 were normalized with GAPDH. Data were expressed as mean ± SEM of three independent experiments. Significant values were expressed as * p < 0.05, ** p < 0.01, *** p < 0.001 compared to the negative control group and # p < 0.05, ## p < 0.01, ### p < 0.001 compared to the control group.
Figure 6
Figure 6
AKT phosphorylation level in insulin-resistant cells upon treatment with various concentrations of vitamins D and E. Red bar represents AKT phosphorylation level upon induction with 250 nM insulin for 16 h. White bar represents AKT phosphorylation level upon treated with vitamins D and E for 24 h after induced with 250 nM insulin. Relative p-AKT phosphorylation levels were normalized to total AKT and were expressed as fold increase over control. Data were expressed as mean ± SEM of three independent experiments. Significant values were expressed as * p < 0.05 compared to the negative control group and ## p < 0.01 compared to the control group.
Figure 7
Figure 7
2-DG uptake level in insulin-resistant cells upon treatment with various concentrations of vitamins D and E. Red bar represents the 2-DG uptake level upon induction with 250 nM insulin for 16 h. White bar represents the 2-DG uptake level upon treatment with vitamins D and E for 24 h after induced with 250 nM insulin. Data were expressed as mean ± SEM of three independent experiments. Significant values were expressed as * p < 0.05, ** p < 0.01 compared to the negative control group and ### p < 0.001 compared to the control group.
Figure 8
Figure 8
Reactive Oxygen Species (ROS) production level in insulin resistance model to determine the antioxidant potential. Red bar represents the ROS production level upon induction with 250 nM insulin for 16 h. White bar represents the ROS production level after treated with vitamin D and E for 24 h after induced with 250 nM insulin. Data were expressed as mean ± SEM of three independent experiments. Significant values were expressed as *** p < 0.001 compared to the negative control group and ### p < 0.001 compared to the control group.
Figure 9
Figure 9
(a) GSK3β and (b) TAU expressions level in insulin-resistant cells upon treatment with various concentrations of vitamins D and E. Red bar represents expression level upon induction with 250 nM insulin for 16 h. White bar represents expression level treated with vitamins D and E for 24 h after induced with 250 nM insulin. Relative GSK3β and TAU expressions were normalized to GAPDH. Data were expressed as mean ± SEM of three independent experiments. Significant values were expressed as ** p < 0.01, *** p < 0.001 compared to the negative control group and ### p < 0.001 compared to the control group.
Figure 10
Figure 10
Continuous impaired insulin signalling causes the activation of AD markers (GSK3β and TAU genes), thus increasing the amyloid beta aggregations leading to AD. Current study reports the role of vitamin D, E and the combinations of vitamins D and E in restoring insulin signalling to normal physiological condition by downregulating GSK3β and TAU genes, eventually reducing the risk of AD.

References

    1. Ott A., Stolk R.P., Hofman A., van Harskamp F., Grobbee D.E., Breteler M.M. Association of Diabetes Mellitus and Dementia: The Rotterdam Study. Diabetologia. 1996;39:1392–1397. doi: 10.1007/s001250050588. - DOI - PubMed
    1. De la Monte S.M., Wands J.R. Alzheimer’s Disease Is Type 3 Diabetes—Evidence Reviewed. J. Diabetes Sci. Technol. 2008;2:1101–1113. doi: 10.1177/193229680800200619. - DOI - PMC - PubMed
    1. De la Monte S.M. Brain Insulin Resistance and Deficiency as Therapeutic Targets in Alzheimer’s Disease. Curr. Alzheimer Res. 2012;9:35–66. doi: 10.2174/156720512799015037. - DOI - PMC - PubMed
    1. Stanley M., Macauley S.L., Holtzman D.M. Changes in Insulin and Insulin Signaling in Alzheimer’s Disease: Cause or Consequence? J. Exp. Med. 2016;213:1375–1385. doi: 10.1084/jem.20160493. - DOI - PMC - PubMed
    1. Talbot K., Wang H.-Y., Kazi H., Han L.-Y., Bakshi K.P., Stucky A., Fuino R.L., Kawaguchi K.R., Samoyedny A.J., Wilson R.S., et al. Demonstrated Brain Insulin Resistance in Alzheimer’s Disease Patients Is Associated with IGF-1 Resistance, IRS-1 Dysregulation, and Cognitive Decline. J. Clin. Investig. 2012;122:1316–1338. doi: 10.1172/JCI59903. - DOI - PMC - PubMed

MeSH terms