. 2019 Oct 18;8(10):1271.
doi: 10.3390/cells8101271.

ATM Regulated PTEN Degradation Is XIAP E3 Ubiquitin Ligase Mediated in p85α Deficient Cancer Cells and Influence Platinum Sensitivity

Affiliations

ATM Regulated PTEN Degradation Is XIAP E3 Ubiquitin Ligase Mediated in p85α Deficient Cancer Cells and Influence Platinum Sensitivity

Reem Ali et al. Cells. .

Abstract

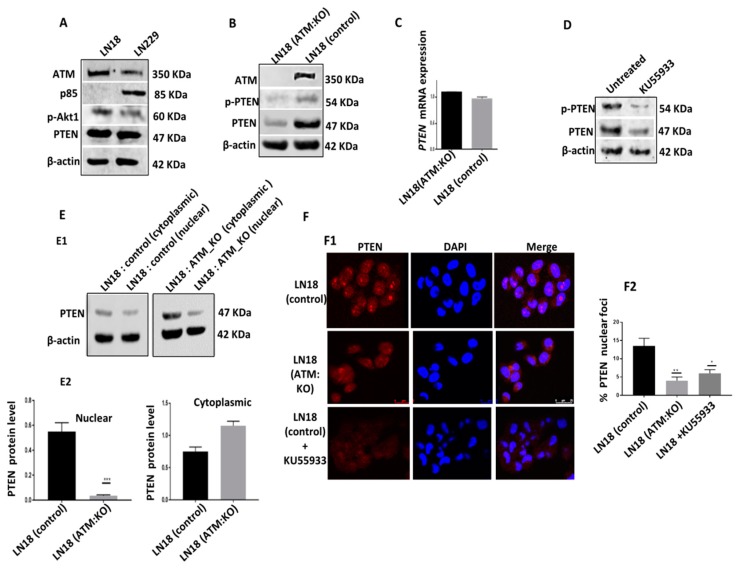
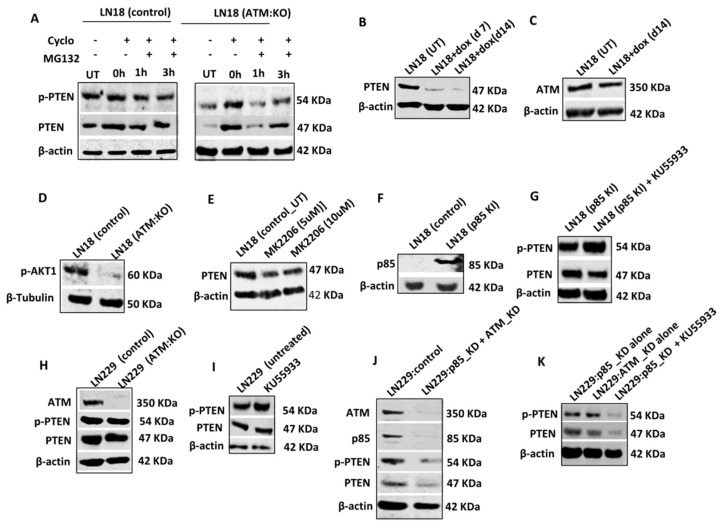
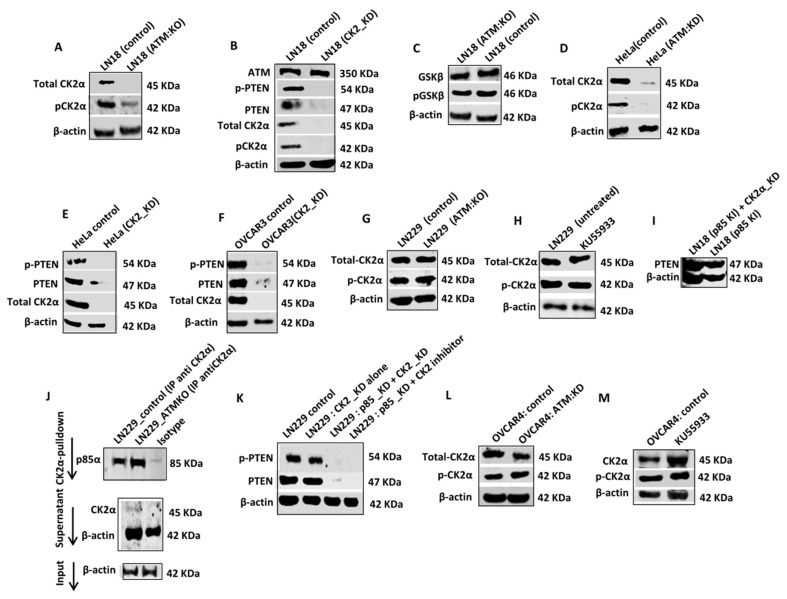
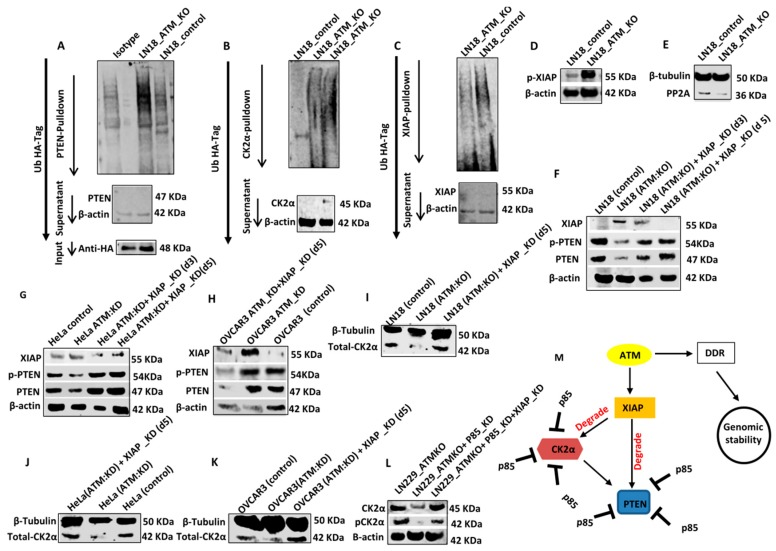
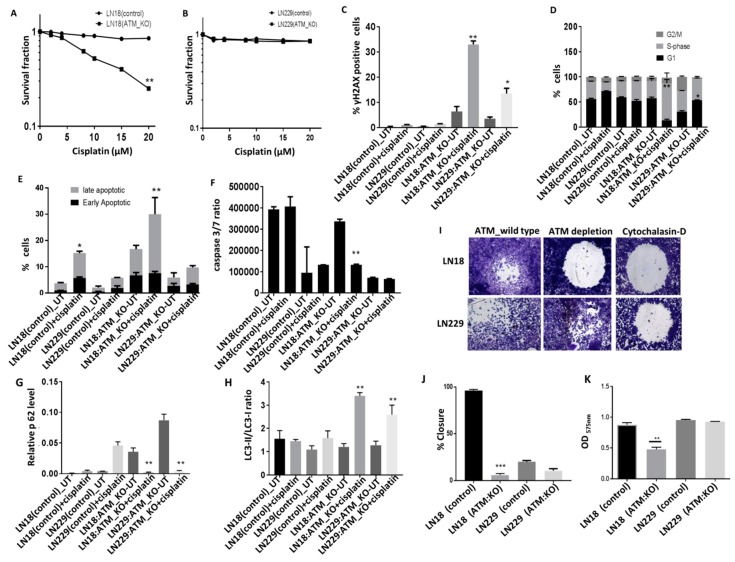
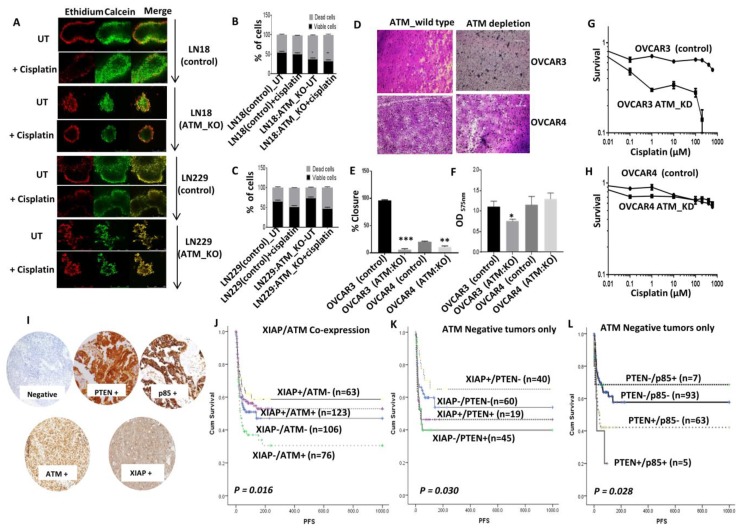
Ataxia-telegiectasia mutated (ATM), phosphatase and tensin homolog (PTEN), and p85α are key tumour suppressors. Whether ATM regulates PTEN expression and influence platinum sensitivity is unknown. We generated ATM knockdowns (KD) and CRISPR knock outs (KO) in glioblastoma (LN18, LN229) and ovarian cancer cells (OVCAR3, OVCAR4). Doxycycline inducible PTEN expression was generated in LN18 and LN229 cells. Transient KD of p85α, CK2, and XIAP was accomplished using siRNAs. Stable p85α knock-in was isolated in LN18 cells. Molecular biology assays included proteasome activity assays, PCR, flow cytometry analysis (cell cycle, double strand break accumulation, apoptosis), immunofluorescence, co-immunoprecipitation, clonogenic, invasion, migration, and 3D neurosphere assays. The clinicopathological significance of ATM, PTEN, p85α, and XIAP (X-linked inhibitor of apoptosis protein) was evaluated in 525 human ovarian cancers using immunohistochemistry. ATM regulated PTEN is p85α dependant. ATM also controls CK2α level which in turn phosphorylates and stabilizes PTEN. In addition, p85α physically interacts with CK2α and protects CK2α from ATM regulated degradation. ATM deficiency resulted in accumulation of XIAP/p-XIAP levels which ubiquitinated PTEN and CK2α thereby directing them to degradation. ATM depletion in the context of p85α deficiency impaired cancer cell migration and invasion reduced 3D-neurosphere formation and increased toxicity to cisplatin chemotherapy. Increased sensitivity to platinum was associated with DNA double strand breaks accumulation, cell cycle arrest, and induction of autophagy. In ovarian cancer patients, ATM, PTEN, p85α, and XIAP protein levels predicted better progression free survival after platinum therapy. We unravel a previously unknown function of ATM in the regulation of PTEN throμgh XIAP mediated proteasome degradation.

Keywords: ATM; CK2α; PTEN; XIAP; cisplatin; ovarian cancers; p85α.


Conflict of interest statement

The authors declare no conflict of interest.

Figures

Figure 1
Figure 1
Low PTEN protein level in ATM deficient cells. (A) ATM, PTEN, p-AKT1 and p85α levels in LN18 and LN229 cells. (B) LN18 ATM_KO was generated by CRISPR-cas9 and levels of total PTEN and P-PTEN (Ser380/Thr382/383) were assessed by western blotting. (C) Relative PTEN mRNA expression was assessed by RT-PCR. (D) LN18 control cells were treated with ATM inhibitor KU55933 for 24 h lysates were immunoblotted for PTEN and p-PTEN. (E) Nuclear and cytoplasmic fractionation of LN18 control and ATM KO cells. (F) Representative photomicrograph images showing PTEN translocation (100×). The data are representative of 3 independent experiments. Where appropriate, quantification is summarized in Supplementary Figure S1.
Figure 2
Figure 2
Proteasome mediated PTEN degradation in ATM deficient cells. (A) Protein stability assay in LN18 control and ATM KO cells. (B) Levels of PTEN and p-PTEN and p85α in Hela ATM SilenciX cells. (C) Levels of PTEN and p-PTEN in Hela control cells treated with 10 µM KU55933. (D) PTEN and p85α levels in OVCAR3 and OVCAR4 ovarian cell lines. (E) PTEN and p-PTEN levels in ATM depleted OVCAR3 cells. (F) PTEN and p-PTEN levels in OVCAR3 were treated with 10 µM of KU55933. (G) Generation of doxycycline inducible PTEN knock downs. (H) ATM level in PTEN Knock downs. (I) p-AKT1 levels in LN18 control and ATM KO cells. (J) MK2206 pan AKT inhibitor did not affect PTEN levels in LN18 cells. (K) p85α overexpression in LN18 control cells (LN18 p85α KI). (L) PTEN and p-PTEN levels in LN18 p85α KI cells treated with 10 µM of KU55933. (M) PTEN and p-PTEN levels in LN229 ATM KO cells. (N) Levels of PTEN, P-PTEN in LN229 cells treated with 10 µM KU55933. (O) PTEN and p-PTEN levels in LN229 cells were transfected with p85 SiRNA and ATM SiRNA. (P) p85 knock down alone or ATM SiRNA alone did not affect PTEN and p-PTEN levels while p85 knock down and KU55933 leads to PTEN and p-PTEN degradation. (Q) PTEN and p-PTEN levels in OVCAR4 cells transfected with ATM SiRNA. (R) Levels of PTEN and p-PTEN in OVCAR4 treated with 10 µM of KU55933. (S) OVCAR4 cells were transfected with P85 SiRNA alone or ATM SiRNA alone or P85 and ATM SiRNA simultaneously, or p85 SiRNA and 10 µM KU55933. Levels of PTEN and p-PTEN were analysed by western blot. All the data are representative of 3 or more independent experiments. Where appropriate, quantification is summarized in Supplementary Figure S2.
Figure 3
Figure 3
Role of CK2α in ATM mediated PTEN degradation. (A) CK2α, p-CK2α levels in LN18 control and LN18 ATM KO cells. (B) CK2α, p-CK2α levels in LN18 untreated and KU55933 treated cells. (C) CK2α, p-CK2α, PTEN, p-PTEN and ATM levels in LN18 cells were transfected with CK2α SiRNA. (D) PTEN, p-PTEN levels in LN18 cells treated with CK2α inhibitor. (E) Levels of GSK3β and p-GSK3β in LN18 control and ATM KO cells. (F) Levels of CK2α, P-CK2α in Hela control and Hela ATM KO. (G) CK2α and p-CK2α levels in Hela control cells treated with KU55933. (H) PTEN, p-PTEN and CK2α levels in Hela control cells transfected with CK2α SiRNA. (I) Levels of PTEN, p-PTEN in Hela cells treated with CK2α inhibitor. (J) PTEN, p-PTEN and CK2α levels in OVCAR3 cells transfected with CK2α SiRNA. (K) PTEN, p-PTEN and CK2α levels in OVCAR3 cells treated with CK2α inhibitor. (L) CK2α and p-CK2α levels in LN229 ATM KO cells. (M) CK2α and p-CK2α levels in LN229 cells treated with KU55933 (10 µM). (N) p85 coimmunoprecipitated with CK2α protein. (O) PTEN and p-PTEN levels in LN229 cells transfected with p85 SiRNA alone or CK2α SiRNA alone or P85 and CK2α SiRNA simultaneously. (P) OVCAR4 cells were transfected with ATM SiRNA. Levels of CK2α, p-CK2α were analysed by western blot on day 3. (Q) CK2α and p-CK2α levels in OVCAR4 cells treated with KU55933 (10µM). (R) PTEN, p-PTEN and p85α levels in OVCAR4 cells transfected with p85 SiRNA alone or CK2α SiRNA alone or P85α and CK2α SiRNA simultaneously. (S) PTEN level in LN18 p85KI transfected with CK2 SiRNA. All figures are representative of 3 independent experiments. Where appropriate, quantification is summarized in Supplementary Figure S3.
Figure 4
Figure 4
XIAP E3-Ubiquitin ligase and ATM mediated PTEN degradation. (A) PTEN IP was blotted on SDS-PAGE gel against HA antibody. (B) CK2 IP was blotted on SDS-PAGE against HA antibody. (C) XIAP IP was blotted on SDS-PAGE against HA antibody. (D) p-XIAP levels in LN18, LN229 control, and ATM KO. (E) Levels of PP2A by western blot in LN18 and LN229 control and ATM_KO (F). LN18 ATM KO cells were transfected with XIAP SiRNA. Levels of PTEN, p-PTEN and XIAP were analysed by western blot on day3 and day5. (G) Hela ATM _KD cells were transfected with XIAP SiRNA. Levels of PTEN, p-PTEN and XIAP were analysed by western blot on day3 and day5. (H) Levels of PTEN, p-PTEN and XIAP in OVCAR3 cells transfected with ATM SiRNA alone or ATM SiRNA and XIAP SiRNA Simultaneously. (I) LN18 ATM KO was transfected with XIAP SiRNA. On day5 levels of CK2α were analysed. (J) Hela ATM _KD cells were transfected with XIAP SiRNA. On day5 levels of CK2α were analysed. (K) OVCAR3 cells were transfected with ATM SiRNA and XIAP SiRNA simultaneously. On day5 levels of CK2α were analysed. (L) LN229 ATM KO cells were transfected with p85 SiRNA alone or p85 SiRNA and XIAP SiRNA simultaneously. Levels of CK2α and p-CK2α were analysed on day5. All data are representative of 3 independent experiments. Where appropriate, quantification is summarized in Supplementary Figure S4. (M) Proposed model for ATM regulated PTEN degradation.
Figure 5
Figure 5
ATM depletion and platinum sensitivity. (A) Cisplatin sensitivity in LN18 control and ATM KO cells. (B) Cisplatin sensitivity in LN229 control and ATM KO cells. (C) LN18 control, LN229 control, LN18 ATM KO and LN229 ATM KO were treated with cisplatin for 48 h and γH2AX levels were analysed by flow cytometry. (D) Cell cycle analysis by flow cytometry for LN18, LN229 control and ATM KO cells treated with cisplatin. (E) Annexin V analysis by flow cytometry in LN18, LN229 control and ATM KO cells treated with cisplatin. (F) caspase 3/7 ratio by chemiluminescence detection in LN18, LN229 control and ATM KO cells treated with cisplatin. (G) p62 protein levels by western blotting in LN18, LN229 control and ATM KO cells treated with cisplatin. (H) LC3I and II protein levels by western blotting in LN18, LN229 control and ATM KO cells treated with cisplatin. (I) Representative photomicrographic images for migration assay for LN18and LN229 control and ATM KO cells. CytochalasinD (migration inhibitor 1.5 µM) was used as a negative control. (J) percentage closure quantification by imageJ software. (K) Invasion assay in LN18, LN229 control, and ATM KO cells. * p value < 0.05, ** p value < 0.01, *** p value < 0.001.
Figure 6
Figure 6
Clinicopathological significance of ATM, PTEN, p85α, and XIAP in ovarian cancers. (A) Representative photo micrographic images of LN18, LN229 cells control and ATM KO cells 3D-neurospheres treated with Cisplatin (40 µM). (B) Quantification of viable/dead cells by flow cytometry in LN18 control and ATM KO cells. (C) Quantification of viable/dead cells by flow cytometry in LN229 control and ATM KO. (D) Representative figure for Invasion assay in OVCAR3 and OVCAR4 control and ATM_KD. (E) Percentage closure quantification by imageJ software. (F) Invasion quantification in OVCAR3 and OVCAR4 control and ATM_KD. (G) Cisplatin sensitivity in OVCAR3 ATM_KD cells. (H) Cisplatin sensitivity in OVCAR4 ATM_KD cells. (I) Immunohistochemical expression in ovarian carcinoma TMA cores: Negative control, high PTEN, high P85, high ATM and high XIAP (200× magnification). Kaplan-Meier curve for PFS ovarian cancers of (J) XIAP and ATM co-expression. (K) XIAP and PTEN co-expression in ATM negative tumors. (L) PTEN and p85 co-expression in ATM negative tumours. * p value < 0.05, ** p value < 0.01, *** p value < 0.001.

References

    1. Tsibulak I., Zeimet A.G., Marth C. Hopes and failures in front-line ovarian cancer therapy. Crit. Rev. Oncol. Hematol. 2019;143:14–19. doi: 10.1016/j.critrevonc.2019.08.002. - DOI - PubMed
    1. Zyl B.V., Tang D., Bowden N.A. Biomarkers of platinum resistance in ovarian cancer: What can we use to improve treatment. Endocr. Relat. Cancer. 2018;25:R303–R318. - PubMed
    1. Dasari S., Tchounwou P.B. Cisplatin in cancer therapy: Molecular mechanisms of action. Eur. J. Pharmacol. 2014;740:364–378. doi: 10.1016/j.ejphar.2014.07.025. - DOI - PMC - PubMed
    1. Worby C.A., Dixon J.E. Pten. Annu. Rev. Biochem. 2014;83:641–669. doi: 10.1146/annurev-biochem-082411-113907. - DOI - PubMed
    1. Bassi C., Ho J., Dowling R.J.O., Gorrini C., Miller S.J., Mak T.W., Neel B.G., Raught B., Stambolic V. Nuclear PTEN controls DNA repair and sensitivity to genotoxic stress. Science. 2013;341:395–399. doi: 10.1126/science.1236188. - DOI - PMC - PubMed

MeSH terms