. 2020 Apr 2:41:63-80.
doi: 10.1146/annurev-publhealth-040119-094423. Epub 2019 Oct 21.

Sick Individuals and Sick (Microbial) Populations: Challenges in Epidemiology and the Microbiome

Affiliations

Sick Individuals and Sick (Microbial) Populations: Challenges in Epidemiology and the Microbiome

Audrey Renson et al. Annu Rev Public Health. .

Abstract

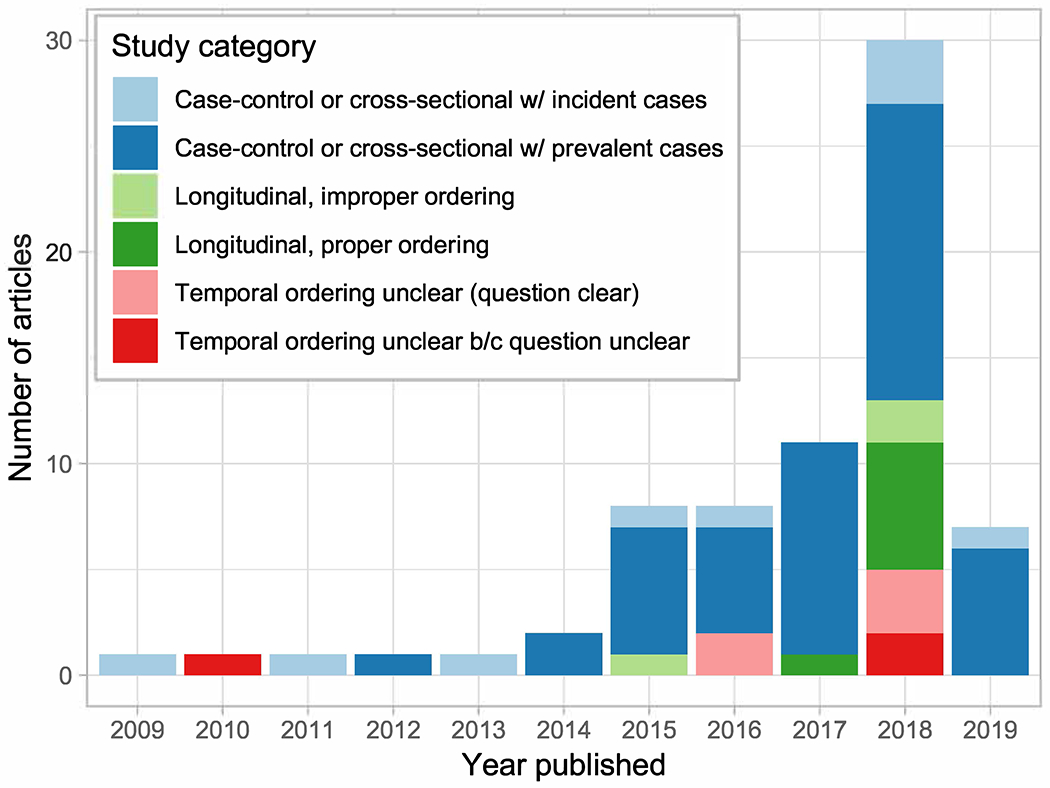
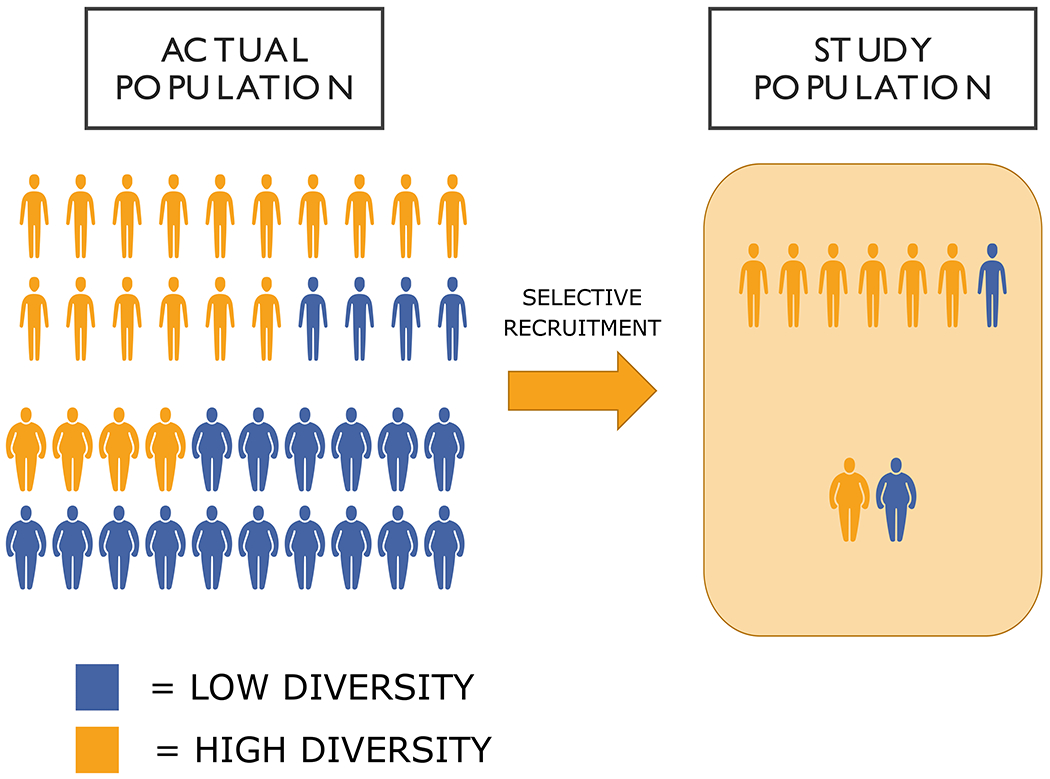
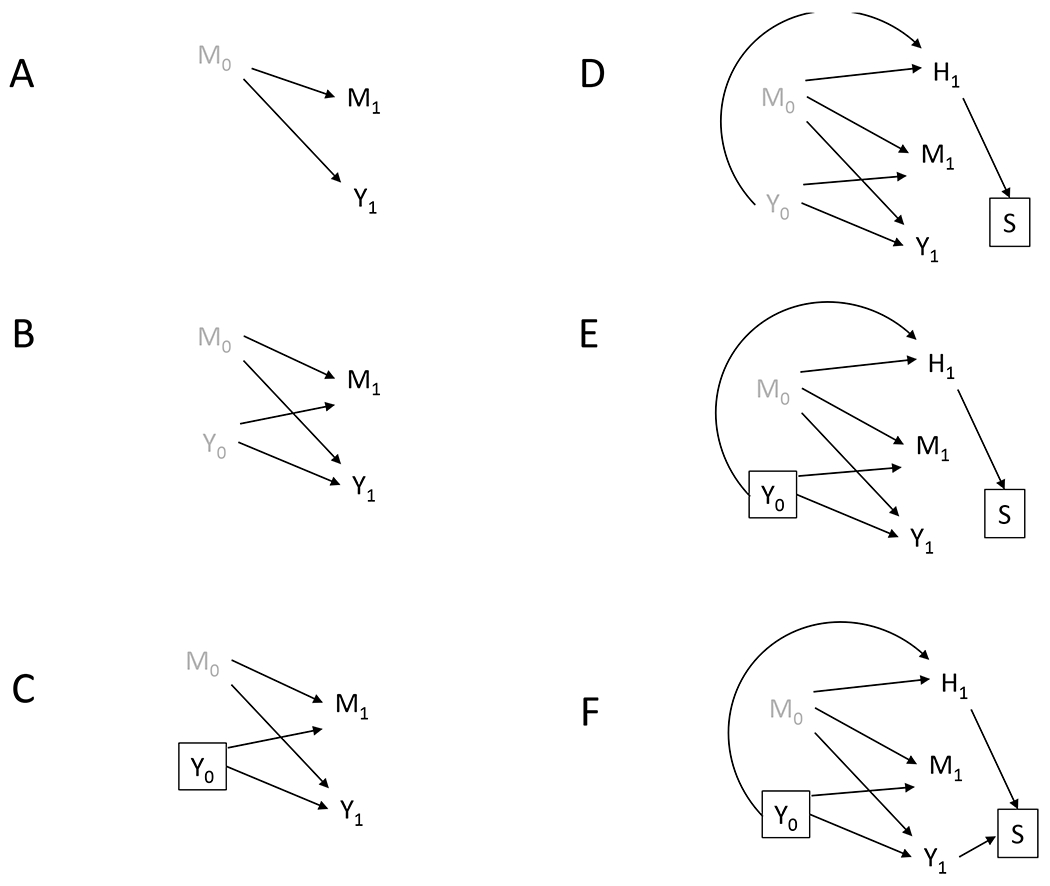
The human microbiome represents a new frontier in understanding the biology of human health. While epidemiology in this area is still in its infancy, its scope will likely expand dramatically over the coming years. To rise to the challenge, we argue that epidemiology should capitalize on its population perspective as a critical complement to molecular microbiome research, allowing for the illumination of contextual mechanisms that may vary more across populations rather than among individuals. We first briefly review current research on social context and the gut microbiome, focusing specifically on socioeconomic status (SES) and race/ethnicity. Next, we reflect on the current state of microbiome epidemiology through the lens of one specific area, the association of the gut microbiome and metabolic disorders. We identify key methodological shortcomings of current epidemiological research in this area, including extensive selection bias, the use of noncompositionally robust measures, and a lack of attention to social factors as confounders or effect modifiers.

Keywords: SES; epidemiology; metabolic; microbiome; microbiota; race/ethnicity; social.


Figures

Figure 1.
Figure 1.
Study design and temporal ordering issues in the 16S microbiome literature on cardiometabolic phenotypes, 2009-2019 (n=71).
Figure 2:
Figure 2:
Implications of selection on SES for obesity-microbiome associations. On the left, the actual population is 30% obese. While the obese population is more likely to have low microbiome diversity, some fraction of obese, likely those of higher SES, will still will have relatively high diversity levels. In a self-selected study sample, which tends to be healthier and higher SES, this can minimize differences between lean and obese individuals on diversity measures. In the actual population, while 80% of lean individuals and 20% of obese individuals will have high diversity, the select study population would be 85% and 50% respectively, thus underestimating the association between obesity and diversity.
Figure 3.
Figure 3.
Directed acyclic graphs illustrating common study design issues present in cardiometabolic microbiome human subjects literature. Nodes represent variables (black=measured, grey=unmeasured) and the arrows represent causal relationships. A square around a node means the analysis is conditional on that variable in some way, whether by adjusting for it, restricting on it, or other means. Subscripts indicate time points. (A) A cross-sectional study where microbiome (M1) and disease outcome (Y1) are measured concurrenty. M1 is unlikely to affect simulatenous disease (Y1), but is meant as a proxy for previous microbiome, M0. (B) A cross-sectional study where prevalent cases are analyzed. Y1 can now be a marker for previous disease, Y0, which can affect M1. (C) A cross-sectional study where incident cases are anlyzed. Y1 is now no longer a marker for previous disease and confounding by Y0 is controlled. (D) A cross-sectional study where prevalent cases are analyzed and participants are selected (S) according to health variables (H1). Selection bias exists due to conditioning on a (descendent of a) collider, S. (E) A cross-sectional study where incident cases are analyzed and participants are selected (S) according to health variables (H1). Selection bias in (D) is alleviated because a non-collider (Y0) on the collider path present in (D) is controlled. (F) A case control study where incident cases are analyzed and participants are selected (S) according to health variables (H1). Selection bias exists due to conditioning on a collider, S.

References

    1. Aatsinki A-K, Uusitupa H-M, Munukka E, Pesonen H, Rintala A, et al. 2018. Gut Microbiota Composition in Mid-Pregnancy Is Associated with Gestational Weight Gain but Not Prepregnancy Body Mass Index. Journal of Women’s Health 27:1293–301 - PMC - PubMed
    1. Aitchison J 1986. The Statistical of Analysis of Compositional Data. Chapman Hall, London
    1. Al-Obaide M, Singh R, Datta P, Rewers-Felkins K, Salguero M, et al. 2017. Gut Microbiota-Dependent Trimethylamine-N-oxide and Serum Biomarkers in Patients with T2DM and Advanced CKD. Journal of Clinical Medicine 6:86- - PMC - PubMed
    1. Allen AP, Dinan TG, Clarke G, Cryan JF. 2017. A psychology of the human brain–gut–microbiome axis. Social and personality psychology compass 11 - PMC - PubMed
    1. Angelakis E, Armougom F, Carrière F, Bachar D, Laugier R, et al. 2015. A metagenomic investigation of the duodenal microbiota reveals links with obesity. PLoS ONE 10:1–15 - PMC - PubMed

Publication types