. 2019 Dec 2;218(12):4127-4140.
doi: 10.1083/jcb.201904098. Epub 2019 Oct 21.

Stress granules regulate stress-induced paraspeckle assembly

Affiliations

Stress granules regulate stress-induced paraspeckle assembly

Haiyan An et al. J Cell Biol. .

Abstract

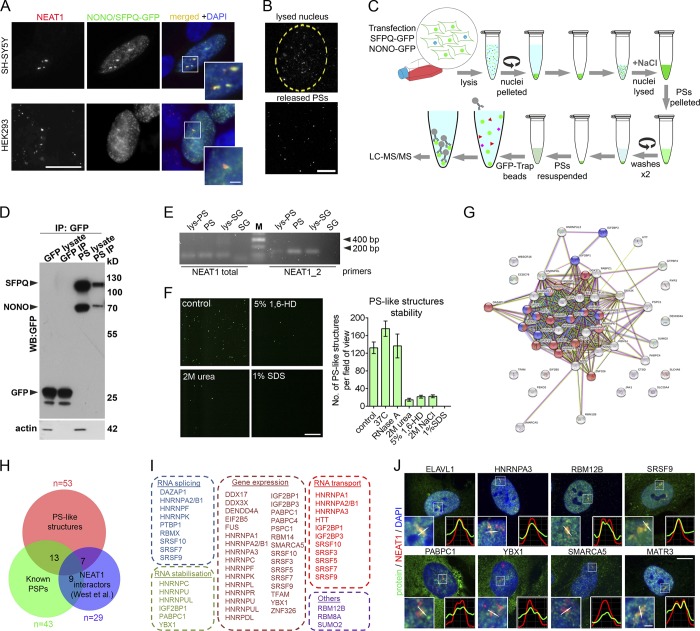
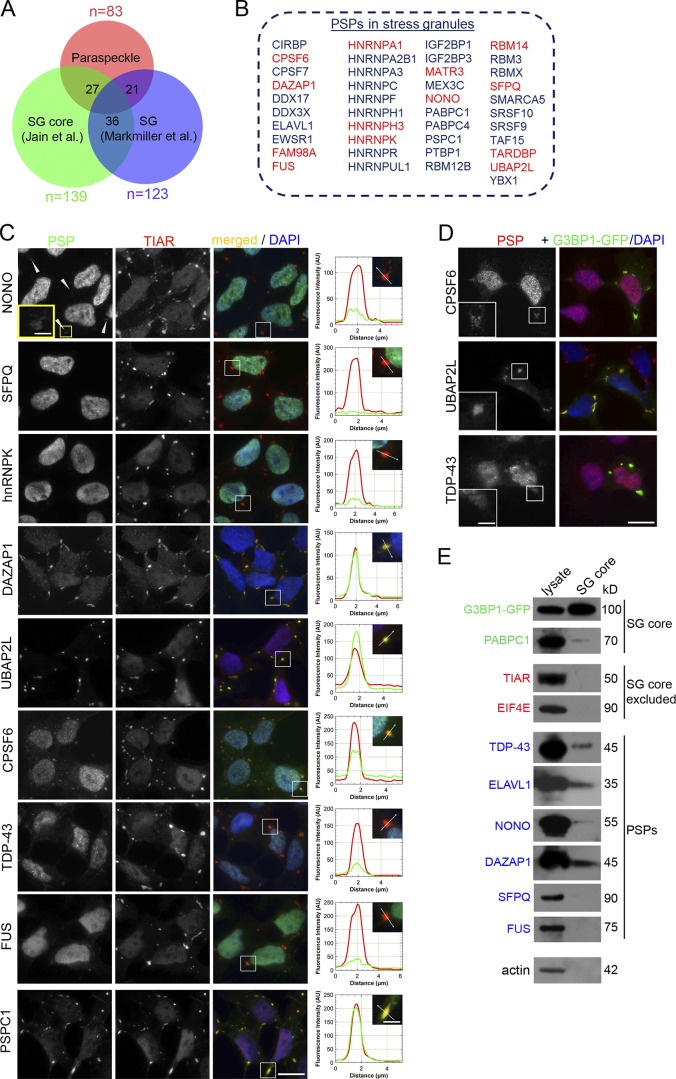
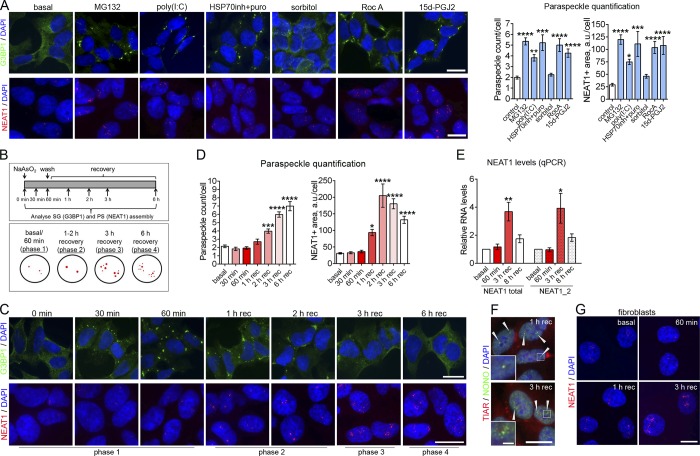
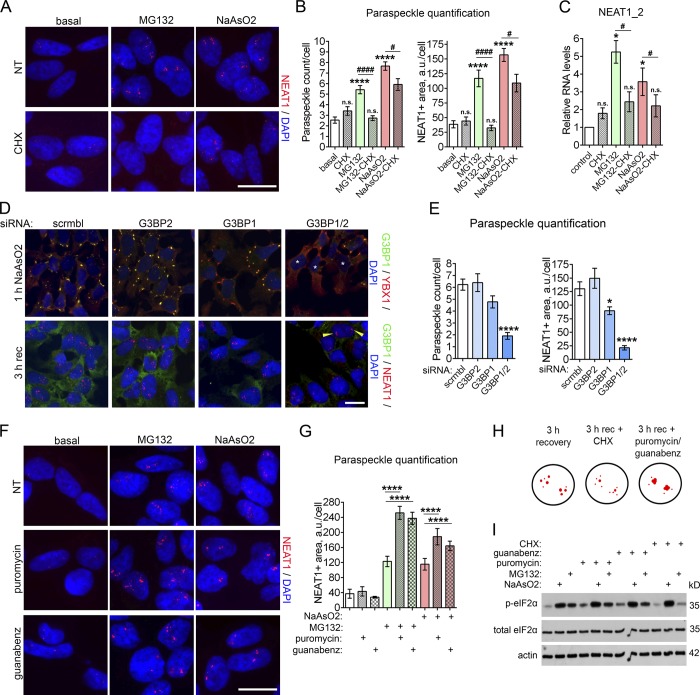
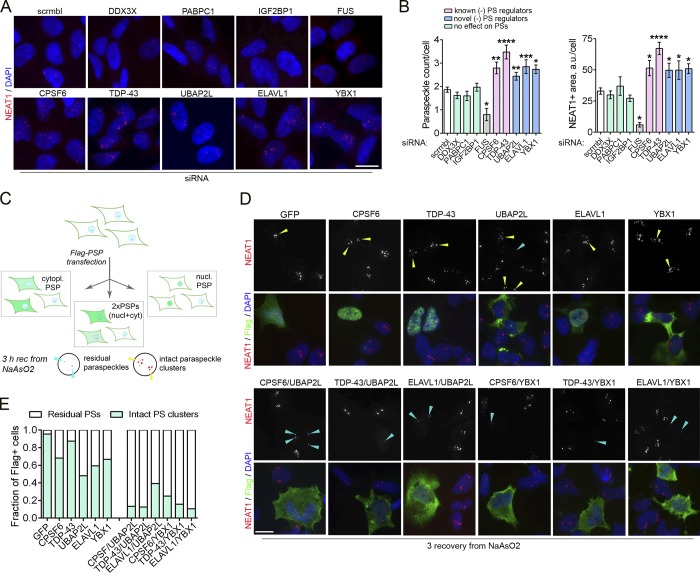
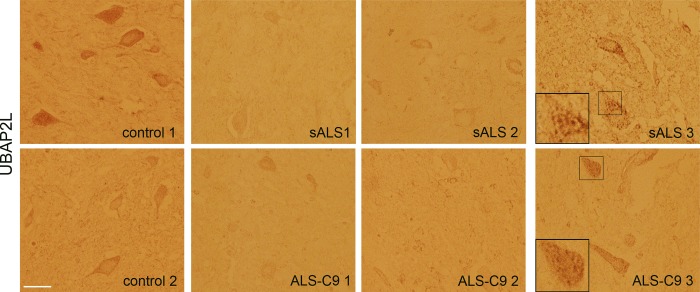
Eukaryotic cells contain a variety of RNA-protein macrocomplexes termed RNP granules. Different types of granules share multiple protein components; however, the crosstalk between spatially separated granules remains unaddressed. Paraspeckles and stress granules (SGs) are prototypical RNP granules localized exclusively in the nucleus and cytoplasm, respectively. Both granules are implicated in human diseases, such as amyotrophic lateral sclerosis. We characterized the composition of affinity-purified paraspeckle-like structures and found a significant overlap between the proteomes of paraspeckles and SGs. We further show that paraspeckle hyperassembly is typical for cells subjected to SG-inducing stresses. Using chemical and genetic disruption of SGs, we demonstrate that formation of microscopically visible SGs is required to trigger and maintain stress-induced paraspeckle assembly. Mechanistically, SGs may sequester negative regulators of paraspeckle formation, such as UBAP2L, alleviating their inhibitory effect on paraspeckles. Our study reveals a novel function for SGs as positive regulators of nuclear RNP granule assembly and suggests a role for disturbed SG-paraspeckle crosstalk in human disease.


Figures

Figure 1.
Figure 1.
Purification and proteomic analysis of PS-like structures. (A) PS-like structures formed by coexpressed SFPQ-GFP and NONO-GFP in SH-SY5Y and HEK293 cells contain NEAT1 as revealed by RNA-FISH. Cells were analyzed 24 h after transfection. Scale bars: main image, 10 µm; inset, 2 µm. (B) PS-like structures during the lysis of purified nuclei. Nuclei of SFPQ/NONO-GFP-expressing HEK293 cells were purified and monitored under fluorescent microscope during lysis. Partially lysed nucleus (top, beginning of lysis) and released PS-like structures (bottom, 30 min of lysis) are shown. Scale bar, 20 µm. (C) Workflow used for affinity purification of PS-like structures. (D) Western blot analysis of GFP-Trap bead purified PS-like structures from cells expressing SFPQ/NONO-GFP using an anti-GFP antibody. Samples from cells expressing GFP alone and processed in parallel were used as a control. For lysate, 1/20 of immunoprecipitation (IP) fraction was loaded on gel. (E) Purified PS-like structures but not SG cores contain NEAT1 as revealed by RT-PCR. Lys-PS and lys-SG, total cell lysates of cells used for PS and SG isolation, respectively. (F) Stability of PS-like structures. PS-like structures in the nuclear lysate were treated as indicated for 1 h and imaged under fluorescent microscope (40× magnification). Representative images and quantification of the numbers of GFP-positive dots per field are shown (four to eight fields analyzed). 1,6-HD, 1,6 hexanediol. Error bars represent SEM. Scale bar, 20 µm. (G) STRING functional protein association for the proteome of PS-like structures. In the network, proteins in categories RNA splicing and RNA transport are shown in blue and red, respectively. (H) Overlap between the proteome of PS-like structures, known pool of PSPs (Naganuma et al., 2012; Mannen et al., 2016; Zhang and Carmichael, 2001) and the pool of NEAT1-interacting proteins previously identified by CHART-seq (West et al., 2014). Numbers within circles indicate the number of proteins common between the datasets. Also see Table S1. (I) Biological function enrichment analysis for proteins identified within PS-like structures (also see Table S1, PS-like structures). (J) Validation of proteins identified in the proteomic analysis. Colocalization of proteins and NEAT1 in human fibroblasts was studied using a combination of NEAT1 RNA-FISH and immunocytochemistry. Fibroblasts were treated with MG132 for 4 h to induce PS clusters. MATR3 was included as a positive control. Scale bars: main image, 10 µm; inset, 1 µm.
Figure 2.
Figure 2.
Multiple PSPs are recruited into SGs. (A) Overlap between PS and SG proteomes. The proteome of PSs (n = 83) comprises known PSPs and proteins recruited to PS-like structures identified in this study. SG proteomes were taken from Jain et al. (2016) and Markmiller et al. (2018). Also see Table S1. (B) List of PSPs recruited into SGs (appearing in SG proteome datasets in Jain et al. [2016] and Markmiller et al. [2018]). Core PSPs, i.e., those regulating NEAT1 levels and/or PS integrity, are given in red. (C) PSP recruitment into SGs. SH-SY5Y cells were treated with NaAsO2 for 1 h, and SGs were visualized using an anti-TIAR antibody. Intensity profiles for representative SGs are also shown. Arrowheads point to SGs weakly positive for NONO. Scale bars: main image, 10 µm; inset, 2 µm. (D) PSP recruitment into SGs formed by overexpressed G3BP1-GFP. SH-SY5Y cells expressing G3BP1-GFP were treated with NaAsO2 for 1 h. Scale bars: main image, 10 µm; inset, 2 µm. (E) Presence of PSPs in SG cores as analyzed by Western blot. SG cores were affinity purified from SH-SY5Y cells treated with NaAsO2 for 1 h.
Figure 3.
Figure 3.
PS hyperassembly is typical for cells subjected to a SG-inducing stress. (A) Effect of SG-inducing stressors on PS assembly. Cells were treated with indicated chemicals and analyzed for SG assembly (after 2 h) and for PS assembly (after 4 h). Cells were also transfected with poly(I:C) and analyzed for SG assembly after 6 h and for PS assembly after 8 h. SGs were visualized with anti-G3BP1 staining and PSs using NEAT1 RNA-FISH. 112–299 cells were included in analysis per condition. ***, P < 0.001; ****, P < 0.0001 (one-way ANOVA with Holm–Sidak’s test). (B) Timeline for SG and PS analysis during NaAsO2 treatment (top panel) and phases of PS assembly identified at these time points (bottom panel; NEAT1 signal is depicted in red). (C and D) Dynamics of SG and PS assembly in NaAsO2-treated cells. Representative images (C) and quantitation (D) are shown. SGs were visualized with anti-G3BP1 staining and PSs using NEAT1 RNA-FISH. In D, 87–235 cells were included into analysis per condition. *, P < 0.05; ***, P < 0.001; ****, P < 0.0001 (one-way ANOVA with Dunnett’s test). (E) NEAT1 levels during NaAsO2 stress as measured by qRT-PCR (n = 4). *, P < 0.05; **, P < 0.01 (Mann–Whitney U test). (F) Recruitment of a core PSP NONO into NaAsO2-induced PSs after 1 and 3 h of recovery (phases 2 and 3, respectively). Arrowheads indicate PS clusters. (G) PS assembly in human fibroblasts during the recovery from NaAsO2 stress. PSs were visualized using NEAT1 RNA-FISH. In A, C, F, and G, representative images are shown. Error bars represent SEM. Scale bars, 10 µm; inset in F, 2 µm.
Figure 4.
Figure 4.
SGs regulate PS assembly and dynamics. (A–C) Translational inhibitor CHX, which dissipates SGs (also see Fig. S2 A), impedes NEAT1 up-regulation and PS hyperassembly during stress in NaAsO2- and MG132-treated cells. Representative images (A), quantification of PS numbers/area (B), and NEAT1_2 levels (C) are shown. PSs were visualized using NEAT1 RNA-FISH, and NEAT1_2 levels were measured with qRT-PCR. Cells were pretreated with CHX for 1 h before NaAsO2 or MG132 addition to the medium. In B, 107–293 cells were included into analysis. #, P < 0.05; **** and ####, P < 0.0001 (one-way ANOVA with Tukey’s test). In C, n = 3; * and #, P < 0.05 (Mann–Whitney U test). n.s., nonsignificant. (D and E) Depletion of both G3BP proteins disrupts stress-induced PS hyperassembly. Simultaneous siRNA knockdown of G3BP1 and G3BP2 disrupts SG assembly (D, top panel) and reduces NaAsO2-induced PS hyperassembly (D, bottom panel; and E). Representative images (D) and quantification of PS numbers/area (E) are shown. Cells were transfected with respective siRNAs, and 72 h after transfection, treated with NaAsO2. PSs were visualized using NEAT1 RNA-FISH, and SGs using anti-YBX1 staining. Asterisks indicate cells devoid of SGs, and arrowheads indicate intact PS clusters. In E, 178–258 cells were included in the analysis. *, P < 0.05; ****, P < 0.0001 (one-way ANOVA with Tukey’s test). (F and G) Puromycin and guanabenz, which prolong SG presence during stress (also see Fig. S2 D), promote NEAT1 accumulation and impair PS dynamics in stressed cells. Representative images (F) and quantification of NEAT1-positive area (G) are shown. Puromycin or guanabenz was added to the cells simultaneously with MG132 or before recovery from NaAsO2. Cells were analyzed after 4 h of MG132 treatment or after 3 h of recovery from NaAsO2. In G, 67–204 cells were included in analysis per condition. ****, P < 0.0001 (one-way ANOVA with Tukey’s test). (H) Schematic representation of the effect of CHX and puromycin/guanabenz on PSs during recovery from NaAsO2 stress. (I) Levels of p-eIF2α in cells treated with NaAsO2 or MG132 and compounds affecting SG assembly/clearance. Cells were pretreated with CHX for 1 h before NaAsO2 or MG132 addition to the medium. Puromycin or guanabenz was added to the cells simultaneously with MG132 or before recovery from NaAsO2. Cells were analyzed after 4 h of MG132 treatment or after 3 h of recovery from NaAsO2. Note that CHX addition decreases p-eIF2α levels in MG132-treated cells. The experiment was repeated three times, and a representative Western blot is shown. Error bars represent SEM. Scale bars, 10 µm.
Figure 5.
Figure 5.
Overabundance of proteins acting as negative regulators of PS formation disrupts PS hyperassembly during stress. (A and B) Depletion of certain PSPs leads to increased PS numbers under basal conditions. Cells were transfected with a respective siRNA or scrambled (scrmbl) control RNA and analyzed 48 h after transfection. Representative images (A) and quantification of PS numbers/area (B) are shown. Also see Fig. S3 A. 68–264 cells were included in the analysis per condition. Cells depleted of FUS are known to lose PSs and were included as a negative control. *, P < 0.05; **, P < 0.01; ****, P < 0.0001 (one-way ANOVA with Dunnett’s test). Error bars represent SEM. Scale bar, 10 µm. (C–E) Increasing cellular levels of two negative regulators of PS formation simultaneously, by expression of Flag-tagged proteins disrupts PS hyperassembly during NaAsO2-induced stress. Experimental design is schematically shown in C. nucl, nuclear; cyt/cytopl, cytoplasmic. Cells were transfected with respective plasmids, left to express the proteins for 24 h, treated with NaAsO2, and allowed to recover (rec) for 3 h, followed by PS analysis using NEAT1 RNA-FISH. A predominantly cytoplasmic protein was coexpressed with a predominantly nuclear protein to be able to identify the coexpressing cells. GFP tagged with Flag was used as a control. Representative images (D) and quantification (E) are shown. In D, yellow arrowheads point to intact stress-induced PS clusters, and blue arrowheads, to residual PS clusters. Scale bar, 10 µm.
Figure 6.
Figure 6.
A negative regulator of PS assembly UBAP2L is depleted or aggregated in the spinal motor neurons of ALS patients. UBAP2L distribution in the spinal cord sections of control individuals and sALS and ALS-C9 patients was analyzed by immunohistochemistry. Representative images of motor neurons in the ventral horn are shown. Scale bar, 50 µm.

Comment in

References

    1. Adriaens C., Standaert L., Barra J., Latil M., Verfaillie A., Kalev P., Boeckx B., Wijnhoven P.W., Radaelli E., Vermi W., et al. . 2016. p53 induces formation of NEAT1 lncRNA-containing paraspeckles that modulate replication stress response and chemosensitivity. Nat. Med. 22:861–868. 10.1038/nm.4135 - DOI - PubMed
    1. An H., Skelt L., Notaro A., Highley J.R., Fox A.H., La Bella V., Buchman V.L., and Shelkovnikova T.A.. 2019. ALS-linked FUS mutations confer loss and gain of function in the nucleus by promoting excessive formation of dysfunctional paraspeckles. Acta Neuropathol. Commun. 7:7 10.1186/s40478-019-0658-x - DOI - PMC - PubMed
    1. An H., Williams N.G., and Shelkovnikova T.A.. 2018. NEAT1 and paraspeckles in neurodegenerative diseases: A missing lnc found? Noncoding RNA Res. 3:243–252. 10.1016/j.ncrna.2018.11.003 - DOI - PMC - PubMed
    1. Anderson P., and Kedersha N.. 2006. RNA granules. J. Cell Biol. 172:803–808. 10.1083/jcb.200512082 - DOI - PMC - PubMed
    1. Anderson P., Kedersha N., and Ivanov P.. 2015. Stress granules, P-bodies and cancer. Biochim. Biophys. Acta. 1849:861–870. 10.1016/j.bbagrm.2014.11.009 - DOI - PMC - PubMed

Publication types