. 2019 Dec 11;40(1):e00230-19.
doi: 10.1128/MCB.00230-19. Print 2019 Dec 11.

MacroH2A1 Regulation of Poly(ADP-Ribose) Synthesis and Stability Prevents Necrosis and Promotes DNA Repair

Affiliations

MacroH2A1 Regulation of Poly(ADP-Ribose) Synthesis and Stability Prevents Necrosis and Promotes DNA Repair

Penelope D Ruiz et al. Mol Cell Biol. .

Abstract

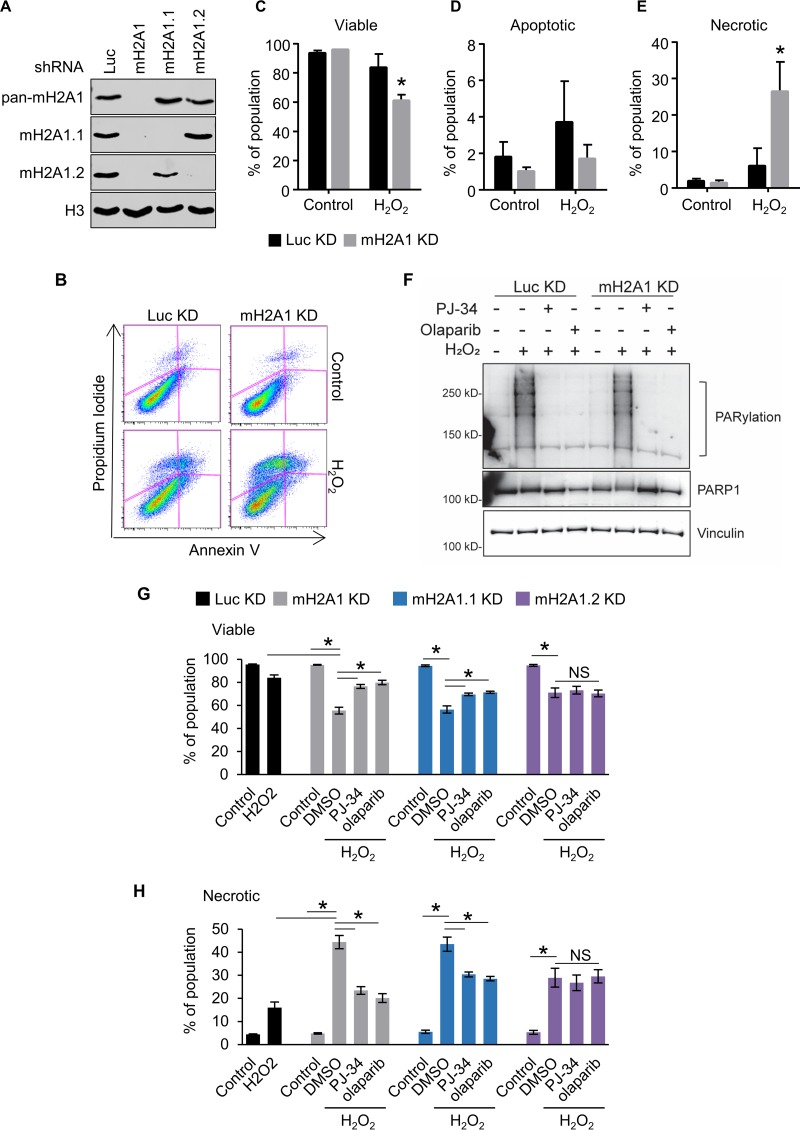
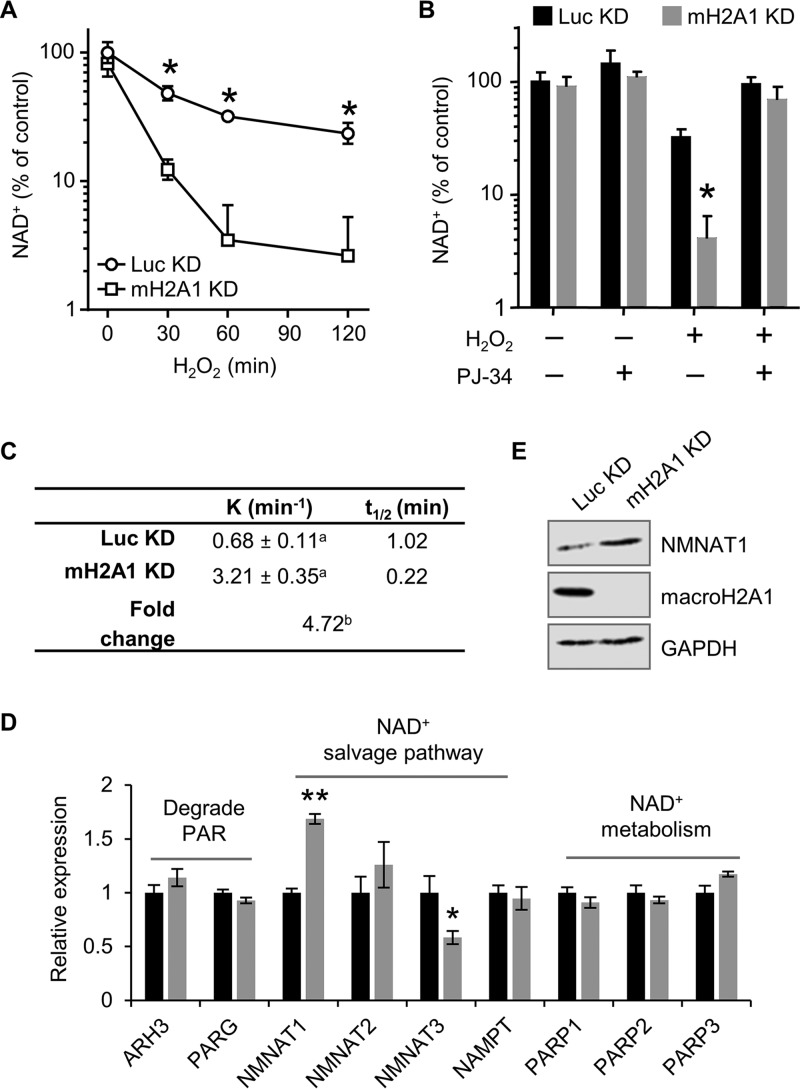
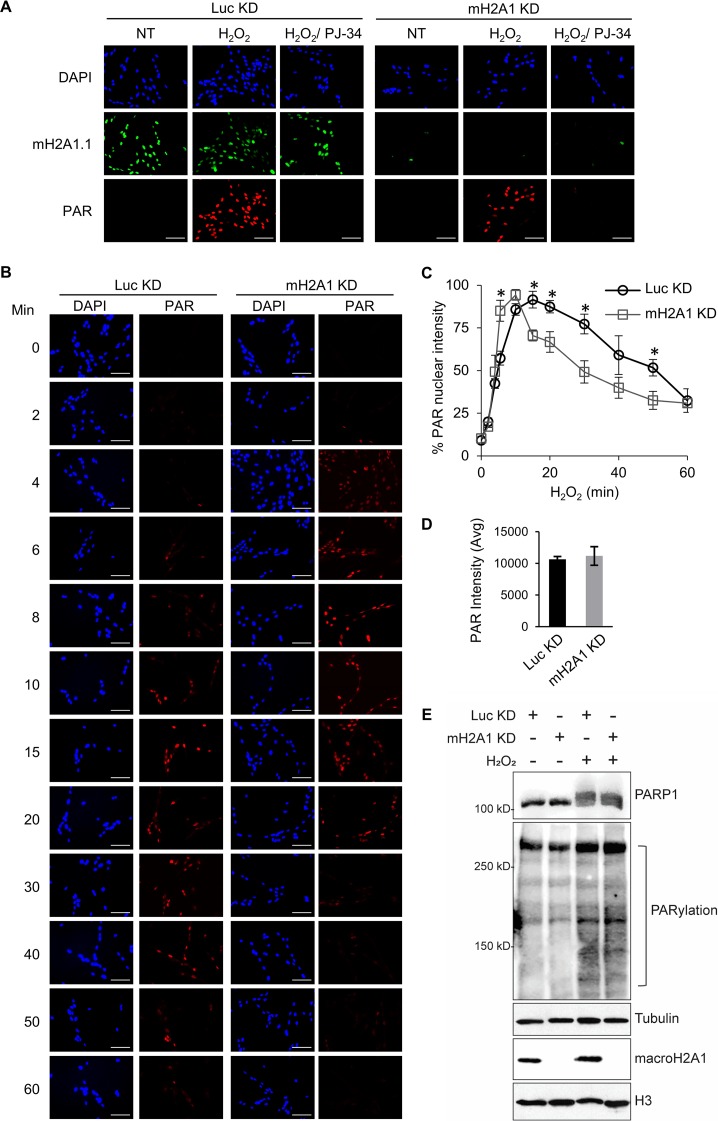
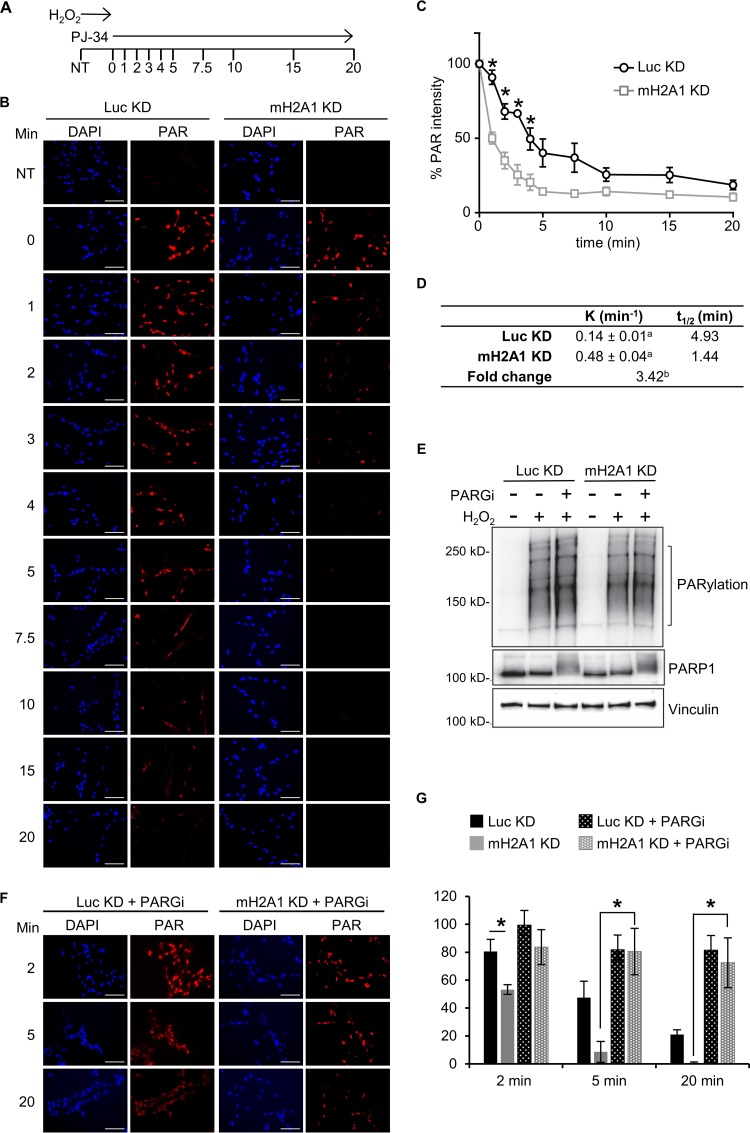
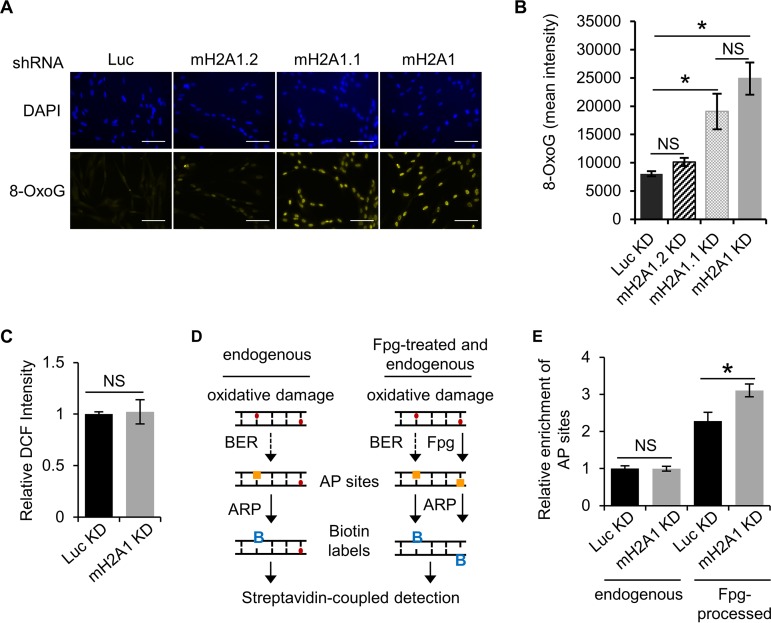
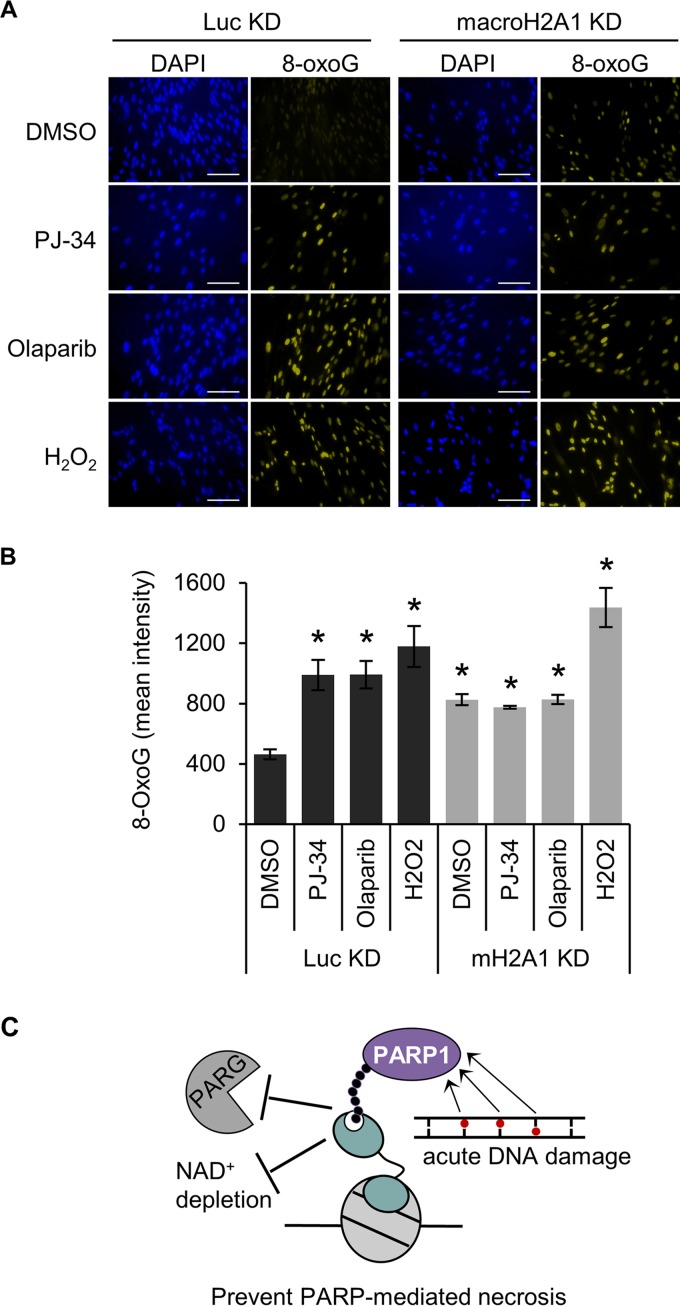
Through its ability to bind the ends of poly(ADP-ribose) (PAR) chains, the function of the histone variant macroH2A1.1, including its ability to regulate transcription, is coupled to PAR polymerases (PARPs). PARP1 also has a major role in DNA damage response (DDR) signaling, and our results show that macroH2A1 alters the kinetics of PAR accumulation following acute DNA damage by both suppressing PARP activity and simultaneously protecting PAR chains from degradation. In this way, we demonstrate that macroH2A1 prevents cellular NAD+ depletion, subsequently preventing necrotic cell death that would otherwise occur due to PARP overactivation. We also show that macroH2A1-dependent PAR stabilization promotes efficient repair of oxidative DNA damage. While the role of PAR in recruiting and regulating macrodomain-containing proteins has been established, our results demonstrate that, conversely, macrodomain-containing proteins, and specifically those containing macroH2A1, can regulate PARP1 function through a novel mechanism that promotes both survival and efficient repair during DNA damage response.

Keywords: DNA damage; PARP; chromatin; macroH2A1; necrosis.


Figures

FIG 1
FIG 1
MacroH2A1 protects against DNA damage-induced necrosis. (A) Immunoblots of acid-extracted histones for macroH2A1.1 (mH2A1.1), macroH2A1.2 (mH2A1.2), and H3 as a loading control in IMR90 cells expressing shRNA directed against either luciferase (Luc KD) as a control, both macroH2A1 isoforms (mH2A1 KD), macroH2A1.1 (mH2A1.1), or macroH2A1.2 (mH2A1.2). (B) Scatterplots depicting representative propidium iodide and annexin-V costaining flow cytometry analysis of IMR90 cells expressing shRNA against Luc or mH2A1 8 h following treatment with or without H2O2 (200 μM) for 90 min. (C, D, and E) Percentages of viable (C), apoptotic (D), and necrotic (E) cells. (F) Immunoblots of whole-cell extracts from IMR90 cells expressing shRNA against Luc or mH2A1 following treatment with 125 μM H2O2 for 15 min. Where indicated, the cells were pretreated with 10 μM PJ-34 or 1 μM olaparib. (G and H) Histograms showing percentages of viable (G) and necrotic (H) cells as measured by fluorescence-based CytoTox-Glo cytotoxicity assay 6 h after treatment. Where indicated, the cells were treated for 90 min with 200 μM H2O2 with or without 30 min pretreatment with 10 μM PJ-34 or 1 μM olaparib. *, P < 0.05; NS, not significant; Student's t test. The bars and error bars represent the means ± SEM of the results of three independent experiments.
FIG 2
FIG 2
MacroH2A1 prevents NAD+ depletion upon DNA damage. (A) Relative cellular NAD+ levels in IMR90 cells expressing shRNA against macroH2A1 (mH2A1 KD) or luciferase (Luc KD) as a control following 125 μM H2O2 treatment for the indicated times. (B) NAD+ levels relative to control for mH2A1 KD and Luc KD IMR90 cells treated for 2 h with 125 μM H2O2 and 10 μM PJ-34 where indicated. The bars and error bars represent the means and SEM of the results of at least three independent experiments. *, P < 0.05; Student's t test. (C) Rate constant (K) and half-life (t1/2) of NAD+ in response to 125 μM H2O2 in control (Luc KD) and macroH2A1-depleted (mH2A1 KD) cells. a, standard error of the rate constant; b, P < 0.0001 (F test). (D) Relative expression (RT-PCR) of enzymes involved in NAD+ synthesis and metabolism in Luc KD and mH2A1 KD cells for four biological replicates. The bars and error bars represent means ± SEM. *, P = 0.02; **, P = 0.0007; Student's t test. (E) Immunoblots of total cell lysates for NMNAT1, macroH2A1, and GAPDH from Luc KD and mH2A1 KD cells.
FIG 3
FIG 3
MacroH2A1 alters the kinetics of PAR accumulation upon oxidative DNA damage. (A) Immunofluorescence for PAR and macroH2A1 with DAPI counterstaining of IMR90 cells expressing shRNA against macroH2A1 (mH2A1 KD) or luciferase (Luc KD) as a control following treatment with 125 μM H2O2 for 15 min. Where indicated, the cells were pretreated with 10 μM PJ-34. Loss of PAR signal in the PJ-34-treated samples indicates that the PAR antibody is highly specific for PAR chains. (B) Immunofluorescence for PAR with DAPI counterstaining in mH2A1 KD or Luc KD IMR90 cells following treatment with 125 μM H2O2 for the indicated times. Scale bars, 100 μm. (C) PAR stability assay described in the legend to panel B for mH2A1 KD or Luc KD IMR90 cells. (D) Average total peak PAR intensities for the experiment described in the legend to panel B. (E) Immunoblots for total cell lysates and acid-extracted histones in control (Luc KD) or macroH2A1-depleted (mH2A1 KD) IMR90 cells for the indicated antibodies. Luc KD cells were treated with H2O2 for 10 min, whereas mH2A1 KD cells were treated for 15 min. (C and D) Means ± SEM of the results of three independent experiments are shown. *, P < 0.05; Student's t test.
FIG 4
FIG 4
MacroH2A1 regulates PAR stability. (A) Schematic of PAR stability experiment. Cells were treated with H2O2 for 12 min to allow peak levels of PAR to accumulate; 10 μM PJ-34 was then added to prevent further PAR synthesis. PAR levels were monitored over the indicated time points (minutes). NT, not treated with H2O2. (B) Representative immunofluorescence images for the PAR stability assay described in the legend to panel A for IMR90 cells expressing shRNA against macroH2A1 (mH2A1 KD) or luciferase (Luc KD) as a control. Scale bars, 100 μm. (C) Average relative intensities of PAR staining for three independent experiments as described in the legend to panel A. The symbols and error bars represent means ± SEM. *, P < 0.05; Student's t test. (D) Rate constant (K) of PAR degradation and half-life (t1/2) of PAR in control (Luc KD) and macroH2A1-depleted (mH2A1 KD) cells. a, standard error of the rate constant; b, P < 0.0001 (F test). (E) Immunoblots for total cell lysates in control (Luc KD) or macroH2A1-depleted (mH2A1 KD) IMR90 cells for the indicated antibodies. The cells were treated with H2O2 for 12 min, in addition to 0.1 μM PARG inhibitor (PARGi) PDD00017273 where indicated. (F) Representative immunofluorescence images for the PAR stability assay described in the legend to panel A for control (Luc KD) and mH2A1-depleted (mH2A1 KD) IMR90 cells treated with 0.1 μM PARGi. (G) Average relative intensities of PAR staining for three independent experiments as described in the legend to panel F. The bars and error bars represent means ± SEM. *, P < 0.05; Student's t test.
FIG 5
FIG 5
MacroH2A1 promotes repair of endogenous oxidative DNA damage. (A) Representative immunofluorescence images for 8-oxoG staining of IMR90 cells expressing shRNA against luciferase (Luc KD) as a control, both macroH2A1 isoforms (mH2A1 KD), macroH2A1.1 (mH2A1.1), or macroH2A1.2 (mH2A1.2). Scale bars, 100 μm. (B) Average mean intensities of 8-oxoG for three independent experiments as described in the legend to panel A. The bars and error bars represent means ± SEM. *, P < 0.05; Student's t test. NS, no significant difference. (C) ROS levels as measured by DCF fluorescence. The error bars show the standard errors of the mean across three biological replicates. (D) Schematic to detect oxidative DNA damage using an aldehyde-reactive probe (ARP) to biotin tag AP sites. Extracted genomic DNA was treated with Fpg to detect unprocessed sites of oxidative DNA damage. (E) Average relative enrichments of AP sites in Luc KD and mH2A KD IMR90 cells from DNA treated with Fpg or untreated. The error bars show the standard errors of the mean across three biological replicates. *, P < 0.05; Student's t test.
FIG 6
FIG 6
MacroH2A1 and PARP activities are epistatic for repair of oxidative DNA damage. (A) Representative immunofluorescence images for 8-oxoG staining of IMR90 cells expressing shRNA against macroH2A1 (mH2A1 KD) or luciferase (Luc KD) treated with DMSO, 10 μM PJ-34, or 1 μM olaparib for 3 days. Scale bars, 100 μm. (B) Average mean intensities of 8-oxoG for three independent experiments as described in the legend to panel A. The bars and error bars represent means ± SEM. *, P < 0.05 relative to Luc KD cells treated with DMSO; Student's t test. (C) Proposed model showing that macroH2A1.1-dependent stabilization of PAR chains by antagonizing PARG and inhibition of PARP1 activity prevents NAD+ depletion, prevents PARP-mediated necrosis, and increases the efficiency of PARP-mediated DNA repair.

Similar articles

Cited by

References

    1. Schreiber V, Dantzer F, Ame J-C, de Murcia G. 2006. Poly(ADP-ribose): novel functions for an old molecule. Nat Rev Mol Cell Biol 7:517–528. doi:10.1038/nrm1963. - DOI - PubMed
    1. Luo X, Kraus WL. 2012. On PAR with PARP: cellular stress signaling through poly(ADP-ribose) and PARP-1. Genes Dev 26:417–432. doi:10.1101/gad.183509.111. - DOI - PMC - PubMed
    1. Heeres J, Hergenrother P. 2007. Poly (ADP-ribose) makes a date with death. Curr Opin Chem Biol 11:644–653. doi:10.1016/j.cbpa.2007.08.038. - DOI - PubMed
    1. Kim MY, Zhang T, Kraus WL. 2005. Poly(ADP-ribosyl)ation by PARP-1: “PAR-laying” NAD+ into a nuclear signal. Genes Dev 9:1951–1967. - PubMed
    1. Krishnakumar R, Kraus WL. 2010. The PARP side of the nucleus: molecular actions, physiological outcomes, and clinical targets. Mol Cell 39:8–24. doi:10.1016/j.molcel.2010.06.017. - DOI - PMC - PubMed

Publication types

LinkOut - more resources