. 2019 Nov 5;116(45):22699-22709.
doi: 10.1073/pnas.1821218116. Epub 2019 Oct 21.

Combination anti-CTLA-4 plus anti-PD-1 checkpoint blockade utilizes cellular mechanisms partially distinct from monotherapies

Affiliations

Combination anti-CTLA-4 plus anti-PD-1 checkpoint blockade utilizes cellular mechanisms partially distinct from monotherapies

Spencer C Wei et al. Proc Natl Acad Sci U S A. .

Abstract

Immune checkpoint blockade therapy targets T cell-negative costimulatory molecules such as cytotoxic T lymphocyte antigen-4 (CTLA-4) and programmed cell death-1 (PD-1). Combination anti-CTLA-4 and anti-PD-1 blockade therapy has enhanced efficacy, but it remains unclear through what mechanisms such effects are mediated. A critical question is whether combination therapy targets and modulates the same T cell populations as monotherapies. Using a mass cytometry-based systems approach, we comprehensively profiled the response of T cell populations to monotherapy and combination anti-CTLA-4 plus anti-PD-1 therapy in syngeneic murine tumors and clinical samples. Most effects of monotherapies were additive in the context of combination therapy; however, multiple combination therapy-specific effects were observed. Highly phenotypically exhausted cluster of differentiation 8 (CD8) T cells expand in frequency following anti-PD-1 monotherapy but not combination therapy, while activated terminally differentiated effector CD8 T cells expand only following combination therapy. Combination therapy also led to further increased frequency of T helper type 1 (Th1)-like CD4 effector T cells even though anti-PD-1 monotherapy is not sufficient to do so. Mass cytometry analyses of peripheral blood from melanoma patients treated with immune checkpoint blockade therapies similarly revealed mostly additive effects on the frequencies of T cell subsets along with unique modulation of terminally differentiated effector CD8 T cells by combination ipilimumab plus nivolumab therapy. Together, these findings indicate that dual blockade of CTLA-4 and PD-1 therapy is sufficient to induce unique cellular responses compared with either monotherapy.

Keywords: CTLA-4; PD-1; T cell; immune checkpoint blockade; mass cytometry.


Conflict of interest statement

Competing interest statement: S.C.W. is currently an employee of Spotlight Therapeutics. J.P.A. is a cofounder of Jounce and Neon Therapeutics. J.P.A. has ownership interest in Jounce Therapeutics, Neon Therapeutics, Forty Seven, ImaginAb, Marker Therapeutics, Tvardi, Constellation, BioAtla, Polaris, and Apricity; is a scientific advisory board member/consultant for Jounce, BioAtla, Neon, Amgen, Forty Seven, ImaginAb, Marker Therapeutics, Apricity, Polaris, Oncolytics, and Pieris; and has received royalties from intellectual property licensed to BMS and Merck. M.C.A. reports travel support and honoraria from Merck unrelated to the current work. J.A.W. is a paid speaker for Imedex, Dava Oncology, Omniprex, Illumina, Gilead, MedImmune, and Bristol Meyers Squibb. J.A.W. is a consultant/advisory board member for Roche-Genentech, Novartis, Astra-Zeneca, Glaxo Smith Klein, Bristol Meyers Squibb, Merck, and Microbiome DX. J.A.W. also receives clinical trial support from Glaxo Smith Klein, Roche-Genentech, Bristol Meyers Squibb, and Novartis. J.A.W. is a clinical and scientific advisor at Microbiome DX and a consultant at Biothera Pharma, Merck Sharp, and Dohme. J.A.W. is an inventor on a US patent application submitted by The University of Texas MD Anderson Cancer Center that covers methods to enhance checkpoint blockade therapy by the microbiome. Reviewer R.A. holds patents on programmed cell death-1–targeted cancer therapies.

Figures

Fig. 1.
Fig. 1.
Combination anti–CTLA-4 plus anti–PD-1 therapy differentially affects MC38 tumor-infiltrating T cell populations. (A) MC38 tumor volumes 13 d after tumor inoculation are displayed from mice treated with control, monotherapy, or combination anti–CTLA-4 plus anti–PD-1 therapy. (B) T cell frequency as a percentage of total MC38 tumor-infiltrating CD45+ cells. (C) Heat map of MC38 tumor-infiltrating T cell metaclusters displaying expression values of individual parameters normalized to the maximum mean value across metaclusters. (D) Relative frequency of CD8 T cell metaclusters. (E) Relative frequency of CD4 effector T cell metaclusters. (F) Relative frequency of Treg metaclusters. (G) Mean intensity of CTLA-4 of Treg metaclusters. Each data point reflects the mean intensity of the individual clusters associated with the metaclusters. Data are pooled from 3 biological replicate cohorts and are displayed on a per mouse basis. Mean and SD are displayed. *P < 0.05, 2-tailed t test with Welch’s correction. (See also SI Appendix, Fig. S1.)
Fig. 2.
Fig. 2.
Correlative relationships between MC38 tumor growth and T cell subset frequency. (A) Relative frequency of denoted MC38 tumor-infiltrating T cell metaclusters plotted as a function of final tumor volume on day 13 postinoculation. Data from all treatment groups are displayed together. Data are pooled from the 3 biological replicate cohorts analyzed in Fig. 1 and are displayed on a per mouse basis. Data points are color-coded by treatment: control (blue), anti–CTLA-4 (red), anti–PD-1 (green), and combination (purple). n.s., not significant. (B) Relative frequency of Th1-like CD4 effector cells (metacluster 2) plotted as a function of final tumor volume. Data from all treatment groups are displayed together. (C) Relative frequency of regulatory T cells (metacluster 8) plotted as a function of final tumor volume. Data from all treatment groups are displayed together. (D) Frequency of IdU+ T cells is displayed for each MC38 tumor-infiltrating T cell metacluster on a per mouse basis. The mean and SD are displayed. Linear regression lines are displayed along with Spearman r and P values. (See also SI Appendix, Fig. S2.)
Fig. 3.
Fig. 3.
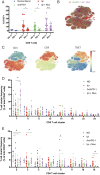
Mass cytometry analysis of peripheral blood from patients treated with checkpoint blockade reveals treatment-specific effects. (A) Frequency of Ki-67+ cells within PD-1 and PD-1+ fractions of CD8 T cells in peripheral blood from patients treated with checkpoint blockade therapies (anti–CTLA-4, ipilimumab [Ipi], anti–PD-1 monotherapy, and ipilimumab plus nivolumab [Ipi + Nivo]) and normal donors is displayed. *P < 0.05, 1-way ANOVA with Sidak’s multiple testing correction. n.s., not significant. (B) tSNE plot of T cells from peripheral blood from patients treated with checkpoint blockade therapies. The plot is color-coded by treatment. Equal numbers of events per treatment group are displayed. (C) tSNE plots of T cells from peripheral blood overlaid with the expression levels of CD4, CD8, and TBET as heat maps. (D) Frequency of CD8 T cell metaclusters identified in peripheral blood from normal donors and patients treated with monotherapy and combination checkpoint blockade therapy. *P < 0.05 Tukey’s 2-way ANOVA with multiple testing correction. The mean and SD are displayed for each frequency plot. ND, normal donor. (E) Frequency of CD4 effector T cell metaclusters identified in peripheral blood from normal donors and patients treated with monotherapy and combination checkpoint blockade therapy. *P < 0.05, Tukey’s 2-way ANOVA with multiple testing correction. (See also SI Appendix, Figs. S3 and S4.)
Fig. 4.
Fig. 4.
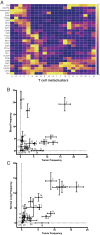
Specific subsets of phenotypically defined T cell populations within the TME are detectable in peripheral blood of treatment-naive patients. (A) Heat map of T cell metaclusters identified across matched human lung tumors, normal adjacent lung, and peripheral blood. Expression values of individual parameters are normalized to the maximum mean value across metaclusters. (B) Mean frequency of T cell metaclusters in blood plotted as a function of their respective frequencies in tumor tissue. Interpatient variability is displayed within each tissue as the SE. Metacluster clusters are annotated. (C) Mean frequency of T cell metaclusters in normal adjacent lung plotted as a function of their respective frequencies in tumor tissue. (See also SI Appendix, Fig. S5.)

References

    1. Pardoll D. M., The blockade of immune checkpoints in cancer immunotherapy. Nat. Rev. Cancer 12, 252–264 (2012). - PMC - PubMed
    1. Topalian S. L., Drake C. G., Pardoll D. M., Immune checkpoint blockade: A common denominator approach to cancer therapy. Cancer Cell 27, 450–461 (2015). - PMC - PubMed
    1. Sharma P., Allison J. P., The future of immune checkpoint therapy. Science 348, 56–61 (2015). - PubMed
    1. Tang J., Shalabi A., Hubbard-Lucey V. M., Comprehensive analysis of the clinical immuno-oncology landscape. Ann. Oncol. 29, 84–91 (2018). - PubMed
    1. Wei S. C., Duffy C. R., Allison J. P., Fundamental mechanisms of immune checkpoint blockade therapy. Cancer Discov. 8, 1069–1086 (2018). - PubMed

Publication types