. 2019 Oct 21;10(1):4788.
doi: 10.1038/s41467-019-12703-7.

A comprehensive study of metabolite genetics reveals strong pleiotropy and heterogeneity across time and context

Affiliations

A comprehensive study of metabolite genetics reveals strong pleiotropy and heterogeneity across time and context

Apolline Gallois et al. Nat Commun. .

Abstract

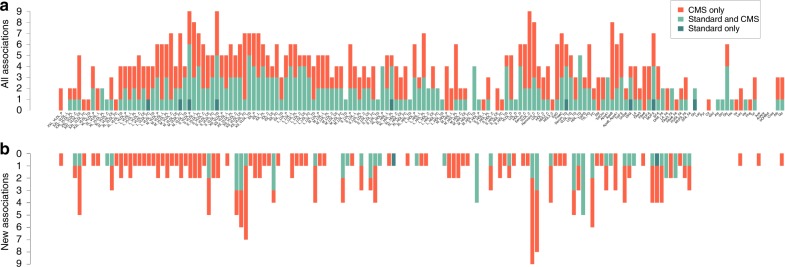
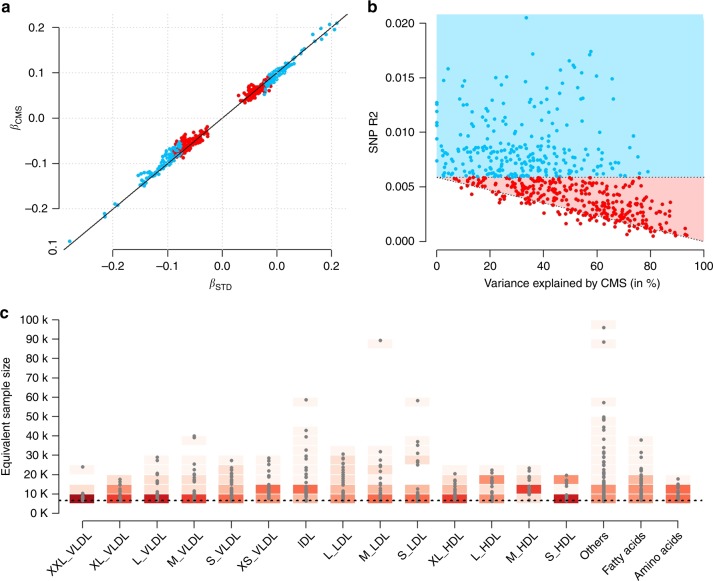
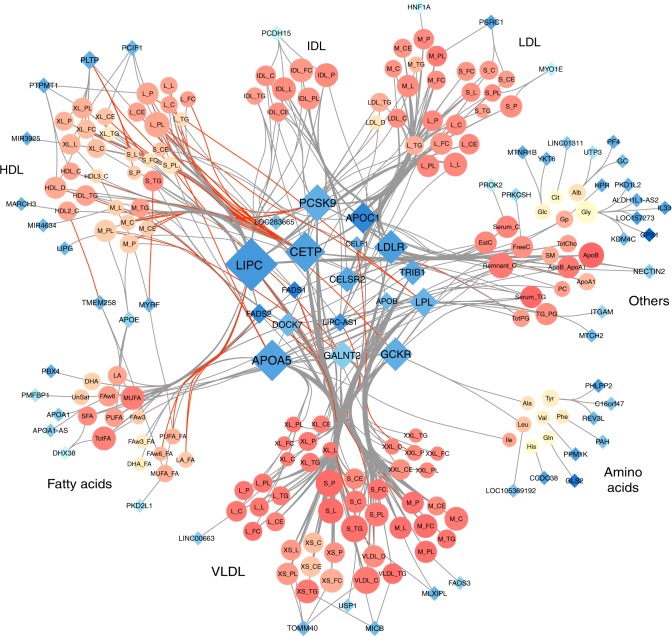
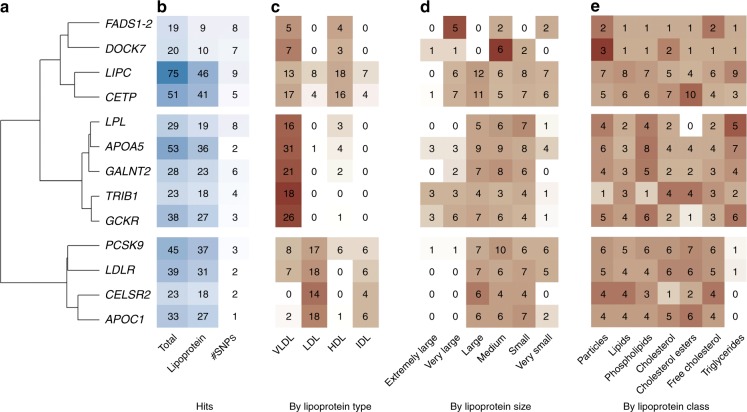
Genetic studies of metabolites have identified thousands of variants, many of which are associated with downstream metabolic and obesogenic disorders. However, these studies have relied on univariate analyses, reducing power and limiting context-specific understanding. Here we aim to provide an integrated perspective of the genetic basis of metabolites by leveraging the Finnish Metabolic Syndrome In Men (METSIM) cohort, a unique genetic resource which contains metabolic measurements, mostly lipids, across distinct time points as well as information on statin usage. We increase effective sample size by an average of two-fold by applying the Covariates for Multi-phenotype Studies (CMS) approach, identifying 588 significant SNP-metabolite associations, including 228 new associations. Our analysis pinpoints a small number of master metabolic regulator genes, balancing the relative proportion of dozens of metabolite levels. We further identify associations to changes in metabolic levels across time as well as genetic interactions with statin at both the master metabolic regulator and genome-wide level.


Conflict of interest statement

The authors declare no competing interests.

Figures

Fig. 1
Fig. 1
Region-metabolite associations. Distribution of the 588 significant associations (P < 1.28 × 10−9) identified in the 158 metabolites GWAS in the METSIM cohort. a Regions in dark green were significant for standard linear regression adjusted by confounding factors. Regions in red were significant for linear regression adjusted with confounding factors and covariates selected by CMS. Regions in light green were significant for both models. b Same plot including only the 228 new associations, not identified in previous metabolites GWAS
Fig. 2
Fig. 2
Overview of CMS results. Characterization of results from the CMS adjusted analysis among the 588 identified region-metabolite associations. For all panels, we used the most associated SNP per region. a The regression coefficient for each SNP estimated using standard linear regression (βSTD) and after adjustment for the covariates selected by CMS (βCMS). Associations significant at 1.28 × 10−9 with the standard test are indicated in blue, those only significant with CMS are indicated in red. b The outcome variance explained by the SNPs as a function of the variance explained by covariates selected by CMS for the corresponding associations. The blue and red areas correspond to the detectable SNP effect size for simple regression given the available sample size, and after explaining the residual outcome variance, respectively. c The gain in power achieved by CMS across the species analyzed, expressed as equivalent increase in sample size. The dash black line corresponds to the baseline sample size of 6623 individuals. The gradient of reds indicates the density
Fig. 3
Fig. 3
Network representation of the 588 region-metabolite associations identified in the 158 metabolites GWAS in METSIM. For each region we used the nearest gene of the most associated variant. Each node represents either a gene (blue diamonds, N = 70) or a metabolite (orange circles, N = 147). Each edge is an association between one gene and one metabolite. Node size is directly proportional to the number of other nodes associated with it. Red edges correspond to opposite effect of a gene on a metabolite, compared with the other metabolites associated with the same gene. Metabolites colors (orange shades) represents correlation strength between a given metabolite and all other metabolites. Genes colors (blue shades) represent strength of correlation between a given gene and associated metabolites, quantified as the average of r2 across all corresponding metabolites
Fig. 4
Fig. 4
Specificity of master regulators on lipoproteins. We performed a hierarchical clustering of the association between the 13 master regulators and the lipoprotein type (a). Further panels show the total number of associations, the number of associations with lipoprotein, and the total number of top associated SNP (b); the count of association hits by lipoprotein type (c), their size (d), and class (e). The background colors represent the relative proportion of association within each gene-item stratum, highlighting heterogeneity in the distribution of signal
Fig. 5
Fig. 5
Fine mapping of the LIPC region. The top panel indicates the posterior probability assessing the evidence that the SNP is causal for each of the 75 phenotypes and the local recombination rate. The middle panel contains genes from the UCSC hg19 annotation. The lower panel is a r²-based LD heatmap computed using PLINK1.9 on the METSIM data. The gradient of red is proportional to the r². For clarity, we represented the LD only for SNPs with a posterior probability > 0.01 for at least 1 phenotype
Fig. 6
Fig. 6
Change in genetic effect as a function of aging and exposure to statins. We derived for the top variant of each of the 13 core regulator genes we identified, a the interaction effect with statin, and b the effect on Δbf, the difference in the metabolite measurement between the two time points. In all association tests, the allele associated with an increase level of metabolite in the marginal test at baseline measurement was defined as the coded allele. Non-significant test are in pink, test nominally significant are in red, and test significant at 5 × 10−3 are in dark red. In agreement with the heritability analysis most of the coefficients for Δbf are negative, indicating an overall decrease of genetic effect. Two genes, APOC1 and TRIB1, show strong enrichment for interaction with statin
Fig. 7
Fig. 7
Heritability of metabolites in baseline and follow-up data. Heritability of studied metabolites, computed on individuals present in both baseline and follow-up data. We used bivariate restricted maximum likelihood (REML) and included 10 genetic PCs, age, and age² as fixed effects. Light colors stand for heritability in baseline data and dark colors stand for follow-up data

References

    1. Wishart DS, et al. HMDB 4.0: the human metabolome database for 2018. Nucleic Acids Res. 2018;46:D608–D617. doi: 10.1093/nar/gkx1089. - DOI - PMC - PubMed
    1. Assfalg M, et al. Evidence of different metabolic phenotypes in humans. Proc. Natl. Acad. Sci. USA. 2008;105:1420–1424. doi: 10.1073/pnas.0705685105. - DOI - PMC - PubMed
    1. Rauschert S, Uhl O, Koletzko B, Hellmuth C. Metabolomic biomarkers for obesity in humans: a short review. Ann. Nutr. Metab. 2014;64:314–324. doi: 10.1159/000365040. - DOI - PubMed
    1. Kastenmuller G, Raffler J, Gieger C, Suhre K. Genetics of human metabolism: an update. Hum. Mol. Genet. 2015;24:R93–R101. doi: 10.1093/hmg/ddv263. - DOI - PMC - PubMed
    1. Stumvoll M, Goldstein BJ, van Haeften TW. Type 2 diabetes: principles of pathogenesis and therapy. Lancet. 2005;365:1333–1346. doi: 10.1016/S0140-6736(05)61032-X. - DOI - PubMed

Publication types

MeSH terms