. 2019 Oct 21;9(1):15035.
doi: 10.1038/s41598-019-51337-z.

NMR-based metabolomics in pediatric drug resistant epilepsy - preliminary results

Affiliations

NMR-based metabolomics in pediatric drug resistant epilepsy - preliminary results

Łukasz Boguszewicz et al. Sci Rep. .

Abstract

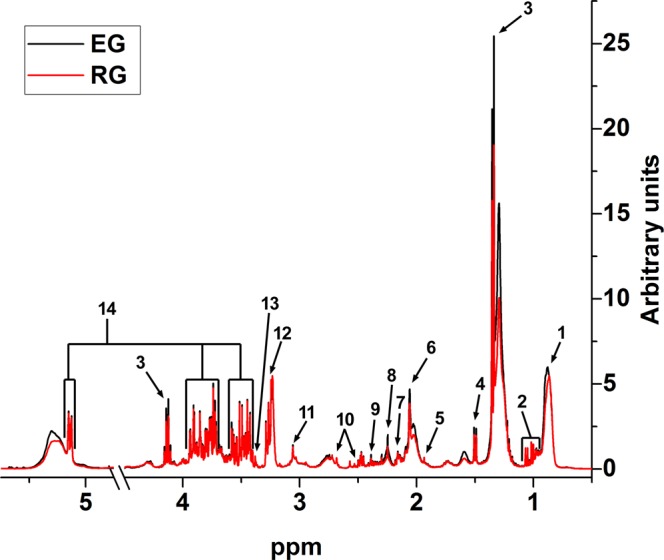
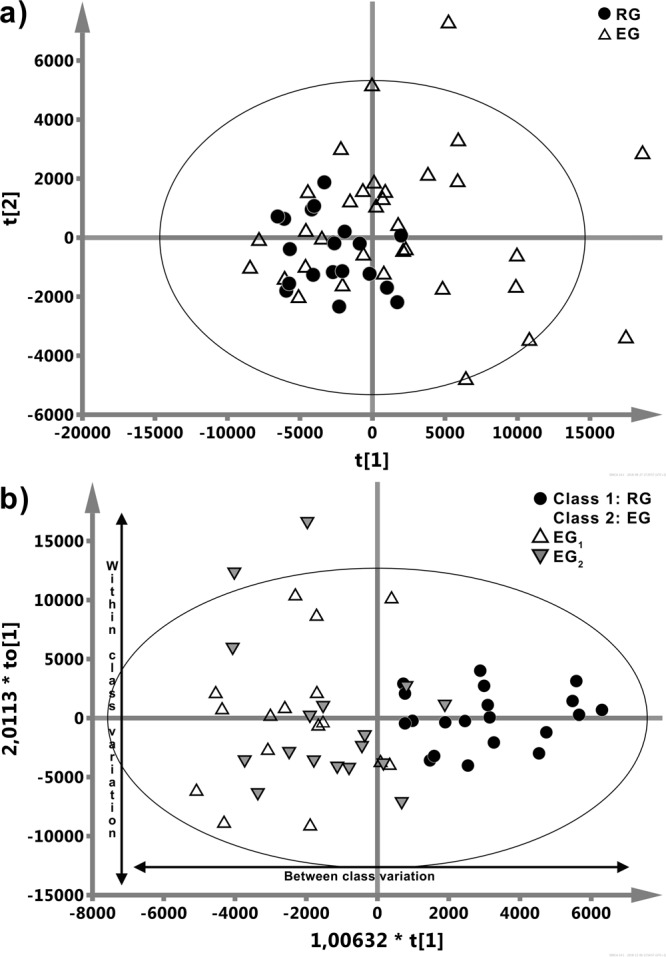
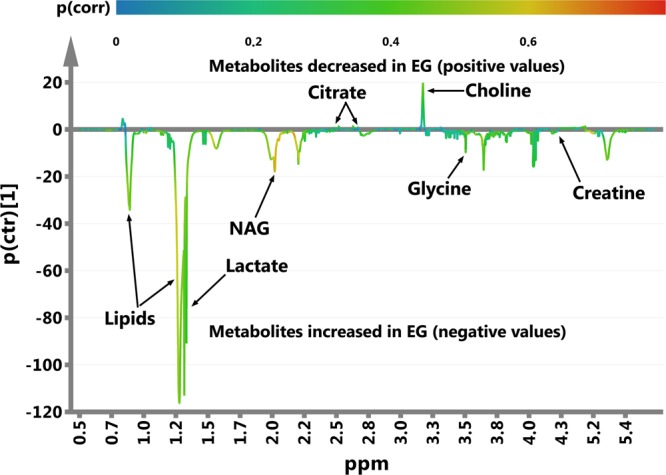
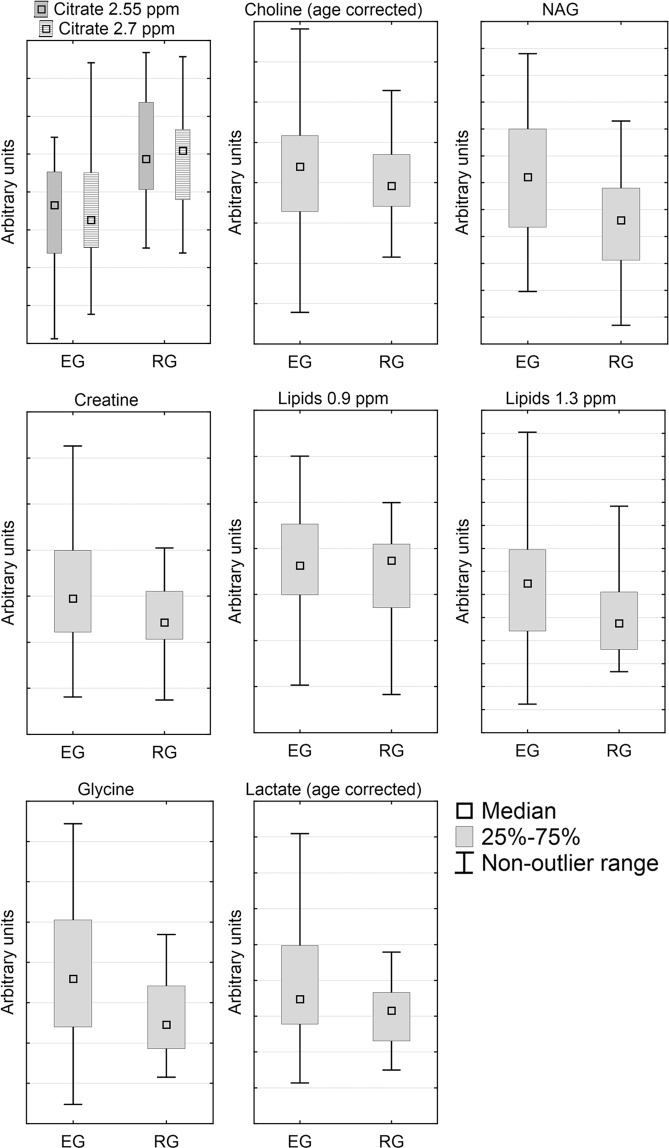
Epilepsy in children is the most frequent, heterogeneous and difficult to classify chronic neurologic condition with the etiology found in 35-40% of patients. Our aim is to detect the metabolic differences between the epileptic children and the children with no neurological abnormalities in order to define the metabolic background for therapy monitoring. The studied group included 28 epilepsy patients (median age 12 months) examined with a diagnostic protocol including EEG, videoEEG, 24-hour-EEG, tests for inborn errors of metabolism, chromosomal analysis and molecular study. The reference group consisted of 20 patients (median age 20 months) with no neurological symptoms, no development delay nor chronic diseases. 1H-NMR serum spectra were acquired on 400 MHz spectrometer and analyzed using multivariate and univariate approach with the application of correction for age variation. The epilepsy group was characterized by increased levels of serum N-acetyl-glycoproteins, lactate, creatine, glycine and lipids, whereas the levels of citrate were decreased as compared to the reference group. Choline, lactate, formate and dimethylsulfone were significantly correlated with age. NMR-based metabolomics could provide information on the dynamic metabolic processes in drug-resistant epilepsy yielding not only disease-specific biomarkers but also profound insights into the disease course, treatment effects or drug toxicity.


Conflict of interest statement

The authors declare no competing interests.

Figures

Figure 1
Figure 1
Mean 1H-CPMG spectra of serum samples obtained from the EG and RG groups. Main detected metabolites are indicated: 1, lipids; 2, BCAA (branched chain amino-acids: leucine, isoleucine and valine); 3, lactate; 4, alanine; 5, acetate; 6, N-acetyl-glycoprotein (NAG); 7, glutamine; 8, acetone; 9, pyruvate; 10, citrate; 11, creatinine; 12, choline; 13, methanol; 14, glucose.
Figure 2
Figure 2
(a) PCA analysis of 1 H CPMG NMR serum spectra shows clustering of the epileptic (EG, Δ) and non-epileptic (RG, •) children. (b) The R2X scaled (distances in the plot correspond with the explained variation) score plot obtained from the OPLS-DA analysis of 1 H CPMG NMR spectra of serum samples from the patients with epilepsy (EG1, Δ, EG2,▼) and the reference subjects without epilepsy (RG, •). The information about seizures in EG patients (EG1 and EG2) was not implemented into the OPLS-DA model and is used purely for a visual assessment of data clustering.
Figure 3
Figure 3
The OPLS-DA s-line plot indicating the metabolites that differentiate the epileptic, EG, and non-epileptic, RG, groups. The correlation of particular metabolites towards segregation between the EG and RG groups (p(corr)) is assessed according to the associated color bar.
Figure 4
Figure 4
The box plot representation of the relative changes in the significant metabolites identified by the OPLS-DA model as important to discriminate between EG and RG groups. For choline and lactate only the age corrected values are presented.
Figure 5
Figure 5
(a) Scatter plot of the LOO scores belonging to non-epileptic (RG, •) and epileptic (EG1, Δ, EG2,▼) children. (b) ROC plot for the leave-one-out (LOO) classification model; AUC equals 0.808 and 95%CI is (0.686, 0.931). The proposed threshold was 0.02, and the Youden’s index was 0.61.
Figure 6
Figure 6
The joint pathway analysis revealing the metabolic pathways altered in the EG group. 1 - glycine serine and threonine metabolism; 2 - citrate cycle (TCA cycle); 3 - glutathione metabolism; 4 - glyoxylate and dicarboxylate metabolism; 5 - cyanoamino acid metabolism.

References

    1. Fisher RS, et al. ILAE Official Report: A practical clinical definition of epilepsy. Epilepsia. 2014;55(4):475–82. doi: 10.1111/epi.12550. - DOI - PubMed
    1. Aaberg K, et al. Incidence and Prevalence of Childhood Epilepsy: A Nationwide Cohort Study. Pediatrics. 2017;139:e20163908. doi: 10.1542/peds.2016-3908. - DOI - PubMed
    1. Ramos-Lizana J, Aguilera-López P, Aguirre-Rodríguez J, Cassinello-García E. Response to sequential treatment schedules in childhood epilepsy. Seizure. 2009;18:620–624. doi: 10.1016/j.seizure.2009.07.001. - DOI - PubMed
    1. Pearl P. New treatment paradigms in neonatal metabolic epilepsies. J. Inherit. Metab. Dis. 2009;32:204–213. doi: 10.1007/s10545-009-1045-8. - DOI - PubMed
    1. Fisher RS, et al. Instruction manual for the ILAE 2017 operational classification of seizure types. Epilepsia. 2017;58:531–542. doi: 10.1111/epi.13671. - DOI - PubMed

Publication types