. 2020 Jan;16(1):69-76.
doi: 10.1038/s41589-019-0381-8. Epub 2019 Oct 21.

A dimerization-based fluorogenic dye-aptamer module for RNA imaging in live cells

Affiliations

A dimerization-based fluorogenic dye-aptamer module for RNA imaging in live cells

Farah Bouhedda et al. Nat Chem Biol. 2020 Jan.

Abstract

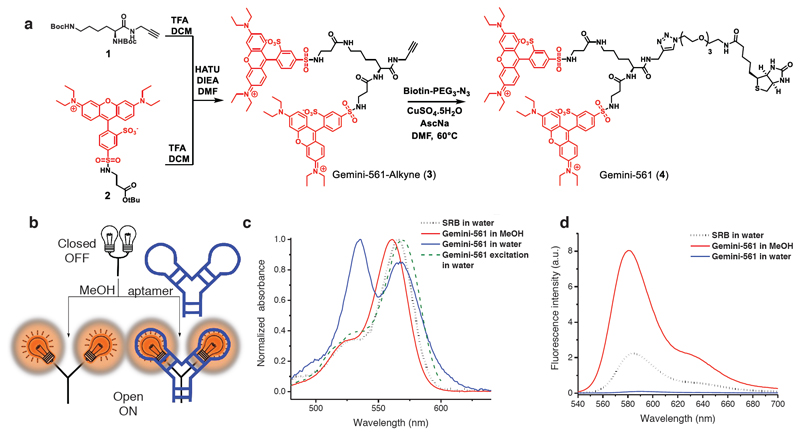
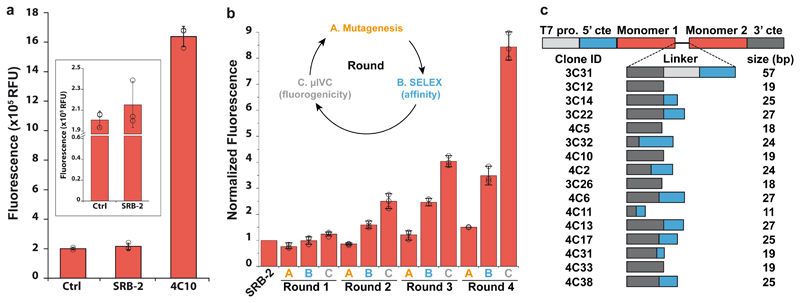
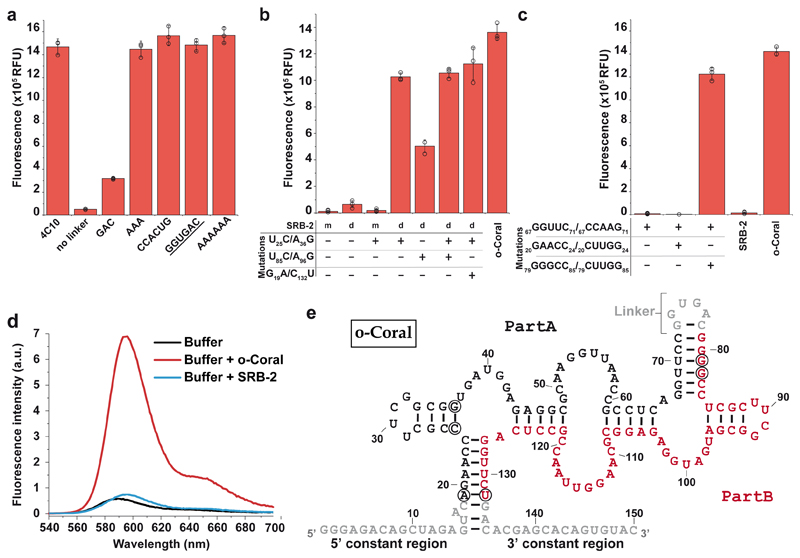
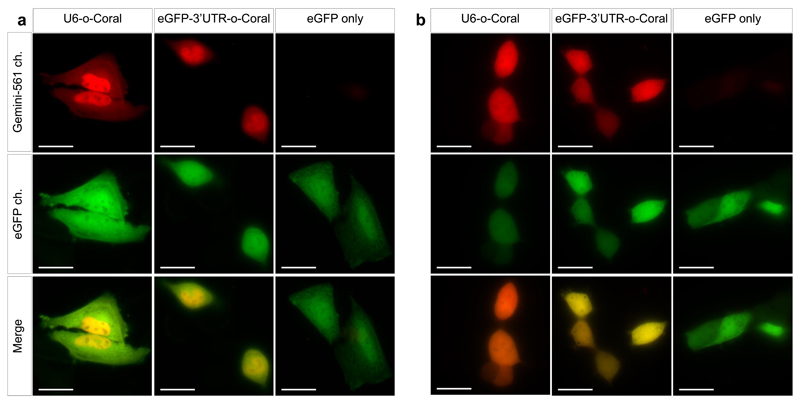
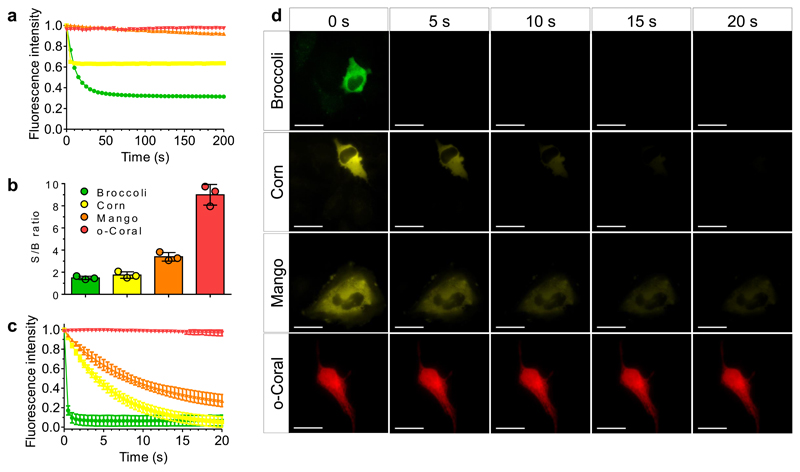
Live-cell imaging of RNA has remained a challenge because of the lack of naturally fluorescent RNAs. Recently developed RNA aptamers that can light-up small fluorogenic dyes could overcome this limitation, but they still suffer from poor brightness and photostability. Here, we propose the concept of a cell-permeable fluorogenic dimer of self-quenched sulforhodamine B dyes (Gemini-561) and the corresponding dimerized aptamer (o-Coral) that can drastically enhance performance of the current RNA imaging method. The improved brightness and photostability, together with high affinity of this complex, allowed direct fluorescence imaging in live mammalian cells of RNA polymerase III transcription products as well as messenger RNAs labeled with a single copy of the aptamer; that is, without tag multimerization. The developed fluorogenic module enables fast and sensitive detection of RNA inside live cells, while the proposed design concept opens the route to new generation of ultrabright RNA probes.


Conflict of interest statement

Competing Interests

F.B., K.T.F., M.C., A.K., M.R., the University of Strasbourg and the CNRS have filed a patent application covering the technology presented in this manuscript.

Figures

Figure 1
Figure 1. Design, synthesis and fluorogenicity of Gemini-561.
(a) Synthesis of Gemini-561. (b) Concept of fluorogenic response of Gemini-561 to environment (organic solvent) and aptamer. (c) Absorption and excitation spectra of Gemini-561 (200 nM) in water and methanol and SRB (200 nM) in water. Results were found identical in n = 3 independent experiments. (d) Fluorescence spectra of Gemini-561(200 nM) in water and methanol and SRB (200 nM) in water. Results were found similar in n = 3 independent experiments.
Figure 2
Figure 2. Isolation of Gemini-561 lighting-up aptamers by in vitro evolution.
(a) Gemini-561 activation capacity of the parental SRB-2 and the evolved 4C10 variant. 500 nM of RNAs were incubated with 50 nM of Gemini-561 and the fluorescence was measured at λ ex/em = 560/600 nm. The values are the mean of n = 3 independent experiments and the error bars correspond to ± 1 standard deviation. (b) Monitoring of the evolution process. For each round, the enriched library was transcribed in vitro in the presence of 100 nM of Gemini-561 and the fluorescence monitored. The fluorescence apparition rate was computed for each library and normalized to that of the parental SRB-2 aptamer. The inset schematizes the different steps (A, B and C) of an evolution round. The values are the mean of n = 3 independent experiments, each measurement being shown as an open circle. The error bars correspond to ± 1 standard deviation. (c) Schematic representation of genes coding for the 16 dimerized variants found among the 19 best aptamers at the end of the evolution process. For each variant, the width and the color of the box respectively inform on linker length (numerical value given on the right) and the nature of the sequence (light gray: T7 promoter, blue: 5'constant, dark grey: 3' constant). Red boxes correspond to SRB-2-derived core. The clone ID refers to the round of selection from which the clone was extracted (first number) and the clone number assigned during the final screening.
Figure 3
Figure 3. Characterization and engineering of the evolved molecule.
(a) Impact of linker size and sequence on the capacity of 4C10 aptamer to activate Gemini-561 fluorescence. 500 nM of RNAs were incubated with 50 nM of Gemini-561 and the fluorescence was measured at λ ex/em = 560/600 nm. The underlined sequence corresponds to o-Coral linker. (b) Contribution of the dimerization and the mutations to o-Coral functionality. SRB-2 aptamer was used as scaffold either in its monomeric (m) or dimeric (d) form containing o-Coral linker. Indicated mutations were then implemented and the different constructs tested as above. (c) Identification of interacting regions. A destabilized mutant (67GGUUC71/67CCAAG71) of o-Coral and two potential compensatory mutants (1: 67GGUUC71/67CCAAG71_20GAACC24/20CUUGG24 and 2: 67GGUUC71/67CCAAG71_79GGGCC85/79CUUGG85) were prepared and tested as above. The values (a-c) are the mean of n = 3 independent experiments, each measurement being shown as an open circle. The error bars correspond to ± 1 standard deviation. (d) Fluorescence emission spectra of Gemini-561 (200 nM) in absence and in the presence of RNA aptamers (600 nM). Excitation wavelength was 530 nm. Results were found similar in n = 3 independent experiments. (e) Model of secondary structure for o-Coral aptamer. This model was established based on enzymatic probing experiments (Supplementary Fig. 8) and mutagenesis experiments shown on c. SRB-2 derived sequences (Part A and B) are shown in black or red whereas the constant regions and the linker are shown in grey. Acquired mutations found to contribute to o-Coral function are circled in black.
Figure 4
Figure 4. Live-cell imaging of o-Coral expressed from pol. II and pol. III promoter.
Live cell imaging of HeLa (a) and HEK293T (b) cells expressing U6-o-Coral, the egfp mRNA eGFP-3’UTR-o-Coral, or eGFP only. Cells were incubated with Gemini-561 (200 nM) for 5 min before imaging. Hoechst was used to stain the nucleus (5 μg/mL). The images were acquired using a 500 ms exposure time. Gemini-561 in red (ex: 550 nm, em: 595±40 nm) and eGFP in green (ex: 470 nm, em: 531±40 nm). Results were found similar in n = 3 independent experiments. Scale bar is 30 μm.
Figure 5
Figure 5. Comparative analysis of photostability by fluorescence microscopy and spectroscopy.
(a) Photostability of G561/o-Coral (0.2 μM/1 μM) compared to Broccoli+DFHBI-1T (0.2 μM/1 μM), Corn+DFHO (0.2 μM/1 μM), Mango + TO1-Biotin (0.2 μM/1 μM). Each complex was excited at the same molar extinction coefficient value: 30,000 M-1 cm-1. Broccoli, Corn and Mango were excited using 488 nm laser (7.75 mW cm-2, 11 mW cm-2, 10 mW cm-2 respectively) and o-Coral was excited using 532 nm laser (7 mW cm-2). Fluorescence intensity was monitored at 507 nm for Broccoli, 545 nm for Corn, 535 nm for Mango and 596 nm for o-Coral. (b-d) Photostability and signal to background noise ratio measurement in live Hela cells. In vitro transcribed and purified aptamers were preincubated with respective fluorogenic dyes for 10 min in selection buffer to form complex. Complexes were microinjected in live HeLa cells using 5 μM dye and 20 μM aptamer concentration. Microinjection parameters: Pi=90 [hPa]; Ti=0.3 [s]; Pc=10 [hPa]. Consecutive images were acquired, each using a 500 ms exposure time. The excitation power was adjusted for the fluoromodules to absorb similar amount of photons. Broccoli (ex: 470 nm, em: 475±50 nm); Corn (ex: 470 nm, em: 531±40 nm); Mango (ex: 470 nm, em: 531±40 nm); Coral (ex: 550 nm, em: 595±40 nm). (b). Signal to background noise ratio of the first acquired image depicting the brightness of the system and the quality of obtain images. Signal to background noise ratios were calculated from fluorescence intensity values extracted from images using same region of interest from n = 3 independent injections. The value of each measurement is shown as a colored dot. The error bars correspond to ± 1 standard deviation. (c) Fluorescence intensity decay curves over the time. Data represent average values ± 1 standard deviation extracted from images from n = 3 independent experiments. (d) Representative micrographs taken during the experiment. Results were found similar in n = 3 independent experiments. Scale bar is 30μm.

References

    1. Levine JH, Lin Y, Elowitz MB. Functional roles of pulsing in genetic circuits. Science. 2013;342:1193–200. - PMC - PubMed
    1. Giepmans BN, Adams SR, Ellisman MH, Tsien RY. The fluorescent toolbox for assessing protein location and function. Science. 2006;312:217–24. - PubMed
    1. Xue L, Karpenko IA, Hiblot J, Johnsson K. Imaging and manipulating proteins in live cells through covalent labeling. Nat Chem Biol. 2015;11:917–23. - PubMed
    1. Dean KM, Palmer AE. Advances in fluorescence labeling strategies for dynamic cellular imaging. Nat Chem Biol. 2014;10:512–23. - PMC - PubMed
    1. Bertrand E, et al. Localization of ASH1 mRNA particles in living yeast. Mol Cell. 1998;2:437–45. - PubMed

Publication types