. 2019 Nov;25(11):1748-1752.
doi: 10.1038/s41591-019-0613-1. Epub 2019 Oct 21.

Pan-viral serology implicates enteroviruses in acute flaccid myelitis

Affiliations

Pan-viral serology implicates enteroviruses in acute flaccid myelitis

Ryan D Schubert et al. Nat Med. 2019 Nov.

Erratum in

  • Author Correction: Pan-viral serology implicates enteroviruses in acute flaccid myelitis.
    Schubert RD, Hawes IA, Ramachandran PS, Ramesh A, Crawford ED, Pak JE, Wu W, Cheung CK, O'Donovan BD, Tato CM, Lyden A, Tan M, Sit R, Sowa GM, Sample HA, Zorn KC, Banerji D, Khan LM, Bove R, Hauser SL, Gelfand AA, Johnson-Kerner BL, Nash K, Krishnamoorthy KS, Chitnis T, Ding JZ, McMillan HJ, Chiu CY, Briggs B, Glaser CA, Yen C, Chu V, Wadford DA, Dominguez SR, Ng TFF, Marine RL, Lopez AS, Nix WA, Soldatos A, Gorman MP, Benson L, Messacar K, Konopka-Anstadt JL, Oberste MS, DeRisi JL, Wilson MR. Schubert RD, et al. Nat Med. 2021 Oct;27(10):1849. doi: 10.1038/s41591-021-01429-z. Nat Med. 2021. PMID: 34548659 No abstract available.

Abstract

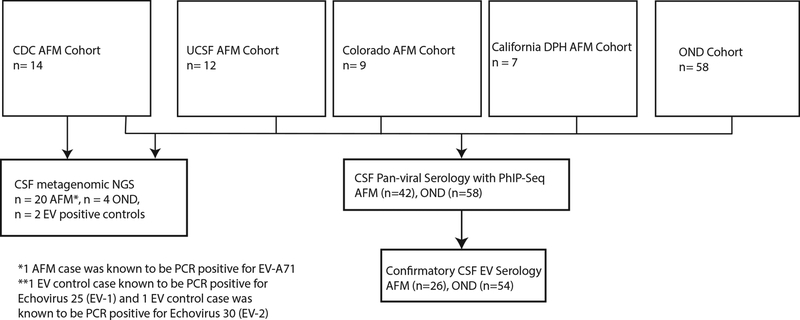
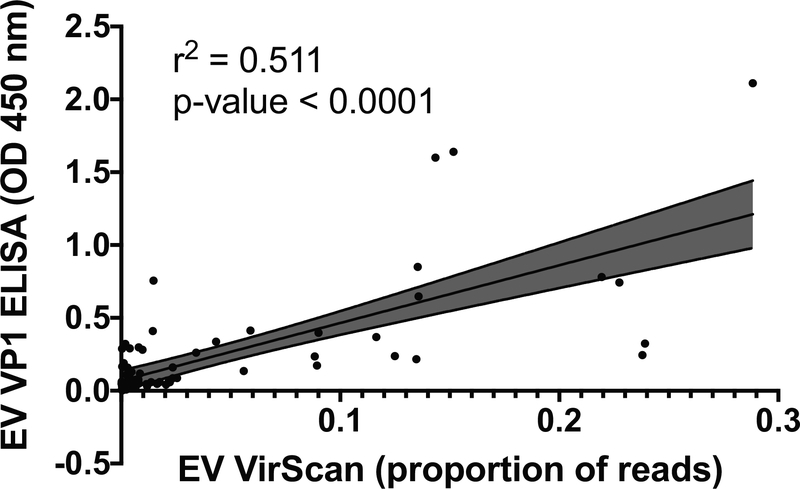
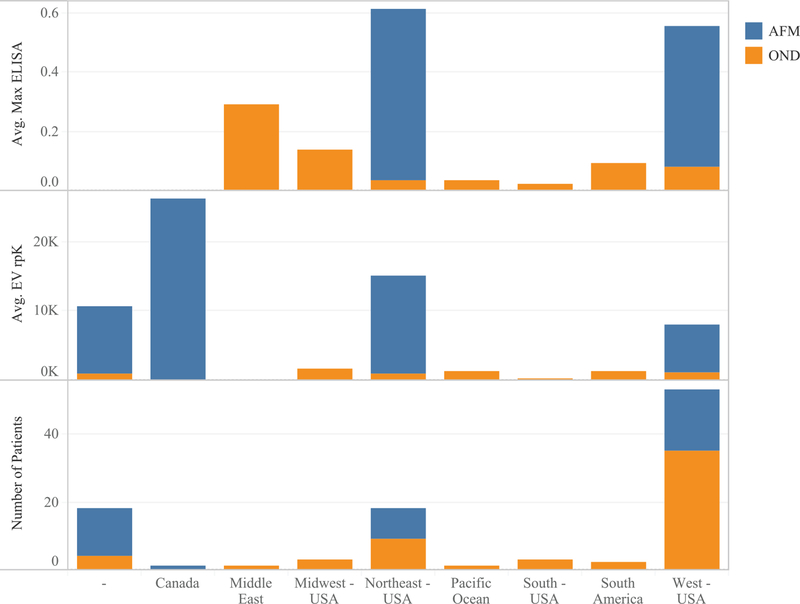
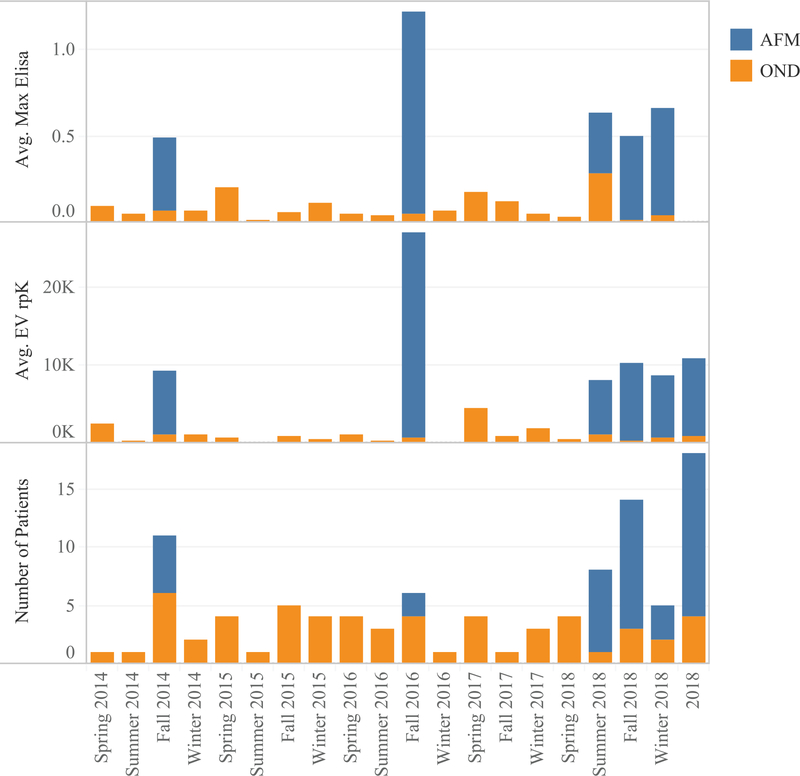
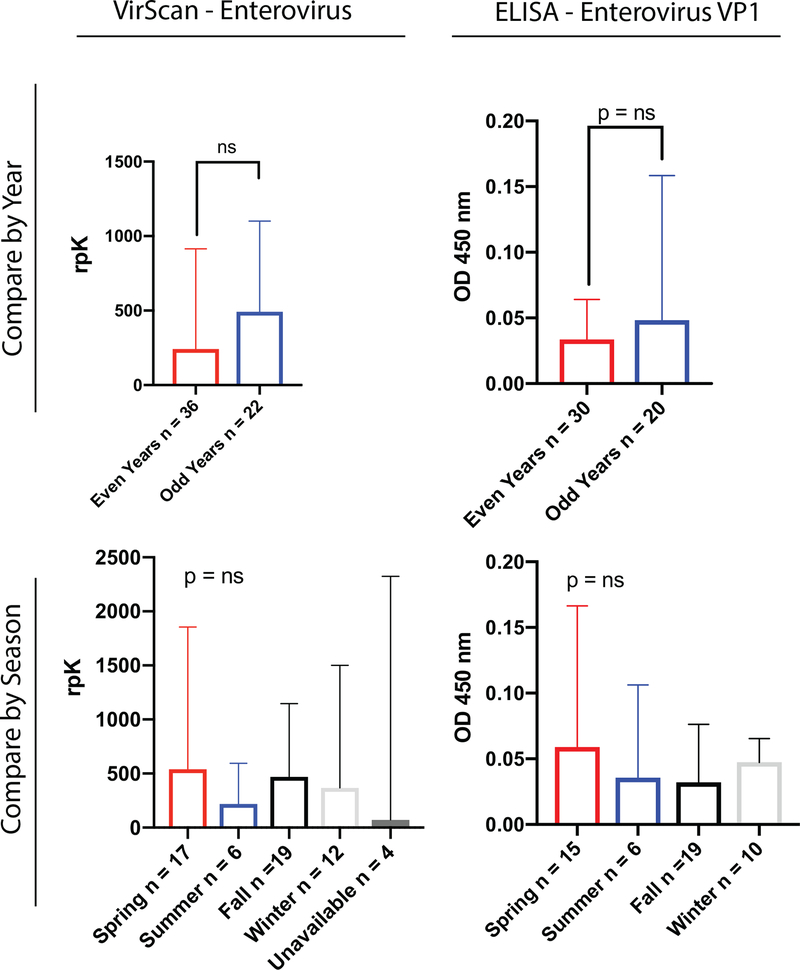
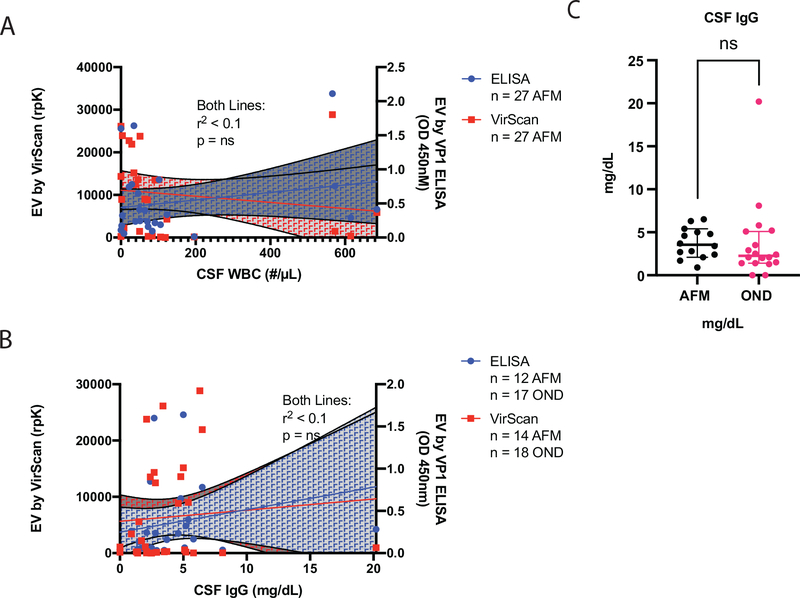
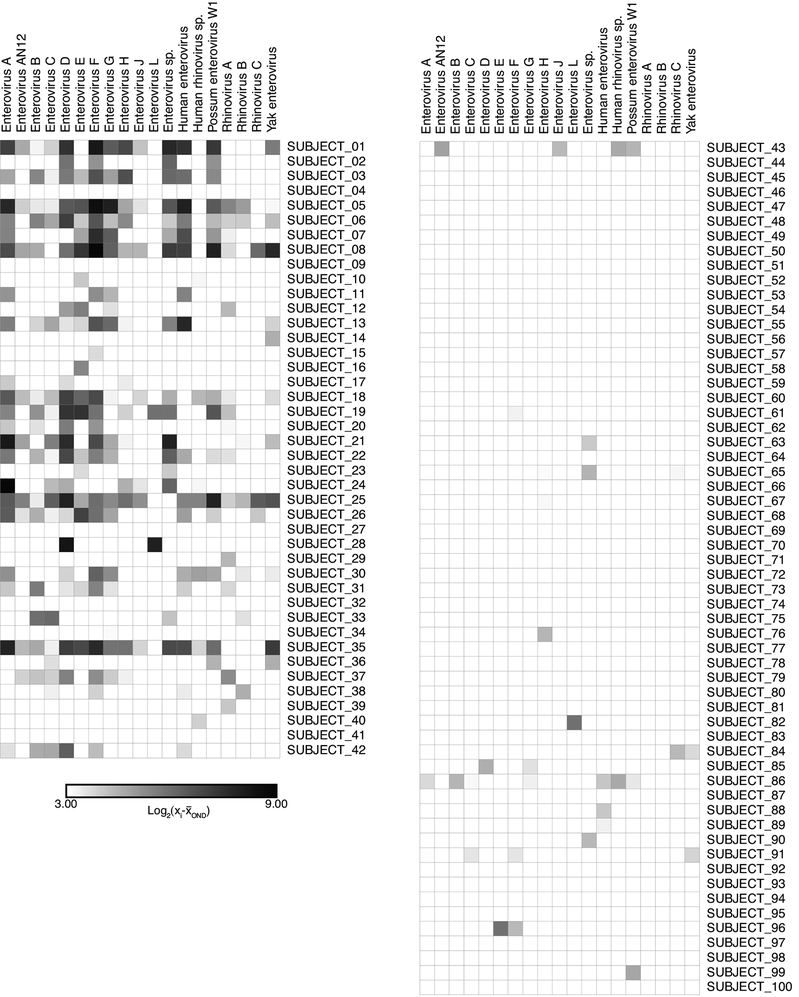
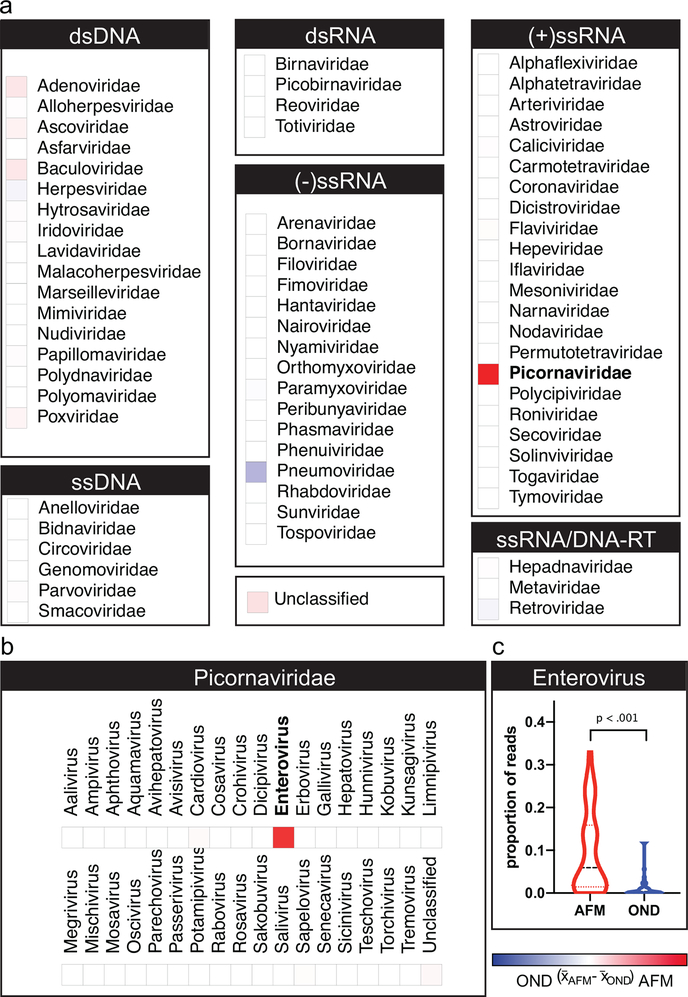
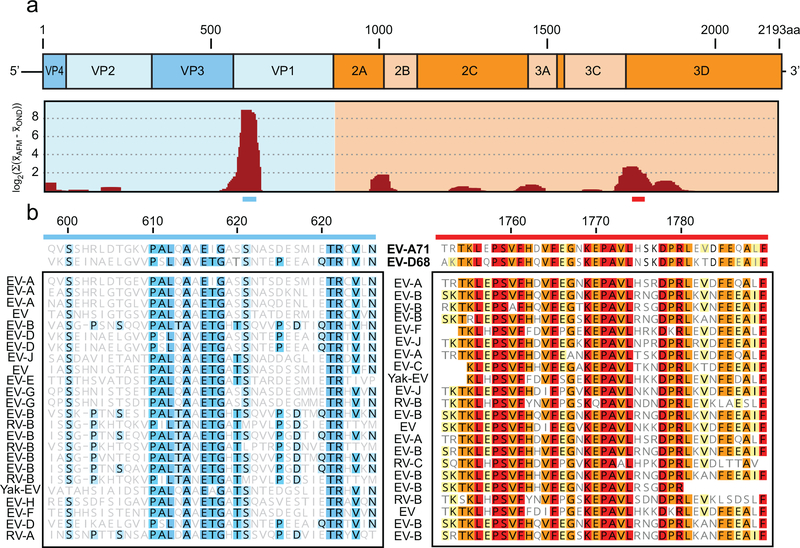
Since 2012, the United States of America has experienced a biennial spike in pediatric acute flaccid myelitis (AFM)1-6. Epidemiologic evidence suggests non-polio enteroviruses (EVs) are a potential etiology, yet EV RNA is rarely detected in cerebrospinal fluid (CSF)2. CSF from children with AFM (n = 42) and other pediatric neurologic disease controls (n = 58) were investigated for intrathecal antiviral antibodies, using a phage display library expressing 481,966 overlapping peptides derived from all known vertebrate and arboviruses (VirScan). Metagenomic next-generation sequencing (mNGS) of AFM CSF RNA (n = 20 cases) was also performed, both unbiased sequencing and with targeted enrichment for EVs. Using VirScan, the viral family significantly enriched by the CSF of AFM cases relative to controls was Picornaviridae, with the most enriched Picornaviridae peptides belonging to the genus Enterovirus (n = 29/42 cases versus 4/58 controls). EV VP1 ELISA confirmed this finding (n = 22/26 cases versus 7/50 controls). mNGS did not detect additional EV RNA. Despite rare detection of EV RNA, pan-viral serology frequently identified high levels of CSF EV-specific antibodies in AFM compared with controls, providing further evidence for a causal role of non-polio EVs in AFM.


Conflict of interest statement

Competing Interests Statement

The authors have no competing interests to declare.

Figures

Extended Data Fig. 1
Extended Data Fig. 1. Flow chart depicting patient enrollment by institution
mNGS with and without FLASH were performed on CSF samples acquired from the CDC (n=14 AFM, n=4 OND, n=2 EV positive controls) and UCSF AFM Cohort (n=6 AFM). Samples from all institutions were tested by VirScan. Due to limited sample, a subset of those tested by VirScan were tested by confirmatory ELISA.
Extended Data Fig. 2
Extended Data Fig. 2. Comparison of VirScan and ELISA
A comparison of the total amount of enterovirus signal generated by VirScan (x-axis) to the maximum OD generated by either EV-D68 or EV-A71 signal ELISA (greater of the two values shown) for all samples run (n = 26 AFM + 50 OND). The 95% confidence intervals are shaded in grey.
Extended Data Fig. 3
Extended Data Fig. 3. Geographic distribution of cases and controls
Geographic comparison of cases (blue) and controls (orange) with average EV signal by ELISA (top), average EV signal by VirScan (middle), and total number (bottom).
Extended Data Fig. 4
Extended Data Fig. 4. Season and year of cases and controls
Season and year comparison for cases (blue) and controls (orange) with average EV signal by ELISA (top), average EV signal by VirScan (middle), and total number (bottom).
Extended Data Fig. 5
Extended Data Fig. 5. Analysis of effect of year and season on enterovirus signal in the OND controls.
EV VirScan (left, n = 54) and EV VP1 ELISA (right, n = 50) for the OND control cohort by year (top) and season (bottom). Bar graphs depict heights as median values with error bars reflecting the interquartile range. Statistics for year were performed with the Mann-Whitney test and for seasons with the Kruskal-Wallis test.
Extended Data Fig. 6
Extended Data Fig. 6. CSF cell count and IgG concentration in cases and controls do not explain EV signal by VirScan or ELISA.
CSF enterovirus antibodies by VirScan a and ELISA are not correlated with the overall amount of CNS inflammation as measured by the CSF cell count (panel A) or CSF IgG (panel B) in a subset of patients. The 95% confidence intervals for each measurement are shaded in blue (ELISA) or red (Virscan). When comparing the concentration of IgG in a subset of AFM cases and OND controls, there was no difference in CSF IgG concentration (p = ns by Mann-Whitney, mean with errors bars showing standard deviation displayed). Two OND CSF IgG values were reported as < 0.9 mg/dL and were conservatively estimated to be 0. Errors bars represent 95% confidence intervals.
Extended Data Fig. 7
Extended Data Fig. 7. Enterovirus antibody enrichment in AFM cases with VirScan is not a reflection of bias in the input library.
Dotplot demonstrating replicate IPs from a typical sample (left panel) correlate with each other but not with the input library (right panel). Values plotted are log10 of the raw rpK values + 1. The sum of the signal at each point on the axes is expressed as a barplot on the axes of the graph.
Extended Data Fig. 8
Extended Data Fig. 8. Strain calling by ELISA versus VirScan
ELISA and VirScan data from subjects with EV-A71 or EV-D68 detected by RT-PCR in either CSF, stool or respiratory fluid. Top panels with strain-specific VP1 ELISA data from EV-A71 (n = 8, red) and EV-D68 (n = 3, blue) patients show cross reactivity. Bottom panels shows VirScan data from known EV-A71 (n = 9, red) and EV-D68 (n = 7, blue) patients. EV-A and EV-D signals were generated by summing the total rpK generated against EV-A and EV-D derived peptides within a sample.
Extended Data Fig. 9
Extended Data Fig. 9. Enterovirus species per-subject heatmap.
VirScan enterovirus genus signal in each subject demonstrating enrichment for a cross-reactive EV signal in the AFM subjects (left) as compared with OND (right). Signal represents the log base 2 of the subject’s EV rpK value divided by the mean rpK value in the OND subjects for each EV species. To increase clarity, resulting values below 3 are not shown (legend).
Figure 1.
Figure 1.. Enterovirus Immunoreactivity in Acute Flaccid Myelitis on a Pan-Viral Phage Display Assay.
(A) Viral families detected by VirScan or phage display immunoprecipitation with next-generation sequencing (PhIP-Seq) sorted by their Baltimore classification. Heatmap color intensity was calculated by subtracting the mean reads per hundred thousand sequenced (rpK) in the other neurologic disease (OND) cerebrospinal fluid sample set (n=58) from that observed in acute flaccid myelitis (AFM) CSF (n=42). The maximum and minimum color intensities reflect +11,000 and −11,000 rpK, respectively. The strongest intensity is observed in the Picornaviridae family (boldface type). (B) Genus Enterovirus demonstrating the strongest enrichment in family Picornaviridae. (C) Violin plot of the proportion of Enterovirus phage per patient with mean and first and third quartile indicated by horizontal lines; Mann-Whitney test corrected for multiple comparisons with a Bonferroni adjustment.
Figure 2.
Figure 2.. Primary Enterovirus Antigens Identified by Pan-Viral Phage Display in Acute Flaccid Myelitis.
We identified 438 unique, enriched antigens with taxonomic identifications mapping to enterovirus (EV) across all acute flaccid myelitis (AFM) cerebrospinal fluid samples (n=42). (A) 420 of 438 EV derived peptides were mapped by BLASTP to the 2,193 amino acid polyprotein of EV-A71 (Genbank Accession AXK59213.1) as a model reference. The relative recovery of these peptides by VirScan is plotted as the log2 of the sum of the differences in the mean signal generated in the AFM and pediatric other neurologic disease (OND) cohorts, using a moving average of 32 amino acids, advanced by 4 amino acid steps. (B) Multiple sequence alignment of a representative set of enriched EV-derived peptides for the VP1 (blue bar) and 3D (red bar) proteins. Sequences from EV-D68 (Genbank Accession AIT52326.1) and EV-A71 (Genbank Accession AXK59213.1) are included for reference. Amino acids are shaded to indicate shared identity among peptides from the indicated EV species.
Figure 3.
Figure 3.. Independent Validation of Pan-Viral Phage Display with Purified Enterovirus VP1 Capsid Protein.
(A) Violin plot that enterovirus (EV) signal generated by ELISA can be found at similar levels in acute flaccid myelitis (AFM) patients with previously detected (n=15) and previously undetected (n=11) EV infections (p = ns). In both AFM cohorts, there was a significantly greater amount of signal generated by ELISA compared with pediatric other neurologic disease (OND) controls (n=50) (p < 0.001 for both comparisons, Mann-Whitney test). (B) Similar results by VirScan with no differences seen when comparing EV signal in AFM patients with previously detected (n=23) and previously undetected (n=19) EV infections (p = ns). When each group was compared to the OND controls (n=58), both demonstrated significant enrichment of EV signal (p < 0.001; Mann-Whitney test with Bonferroni adjustment for multiple comparisons).

Similar articles

Cited by

References

    1. Sejvar JJ, et al. Acute Flaccid Myelitis in the United States, August-December 2014: Results of Nationwide Surveillance. Clinical infectious diseases: an official publication of the Infectious Diseases Society of America 63, 737–745 (2016). - PMC - PubMed
    1. Van Haren K, et al. Acute Flaccid Myelitis of Unknown Etiology in California, 2012–2015. JAMA 314, 2663–2671 (2015). - PubMed
    1. Greninger AL, et al. A novel outbreak enterovirus D68 strain associated with acute flaccid myelitis cases in the USA (2012–14): a retrospective cohort study. The Lancet. Infectious diseases 15, 671–682 (2015). - PMC - PubMed
    1. McKay SL, et al. Increase in Acute Flaccid Myelitis - United States, 2018. MMWR Morb Mortal Wkly Rep 67, 1273–1275 (2018). - PMC - PubMed
    1. CDC AFM Confirmed U.S. Cases To Date. (2019).

Publication types

MeSH terms

Supplementary concepts