. 2019 Nov;25(11):1684-1690.
doi: 10.1038/s41591-019-0608-y. Epub 2019 Oct 21.

Therapeutic inhibition of mTORC2 rescues the behavioral and neurophysiological abnormalities associated with Pten-deficiency

Affiliations

Therapeutic inhibition of mTORC2 rescues the behavioral and neurophysiological abnormalities associated with Pten-deficiency

Chien-Ju Chen et al. Nat Med. 2019 Nov.

Abstract

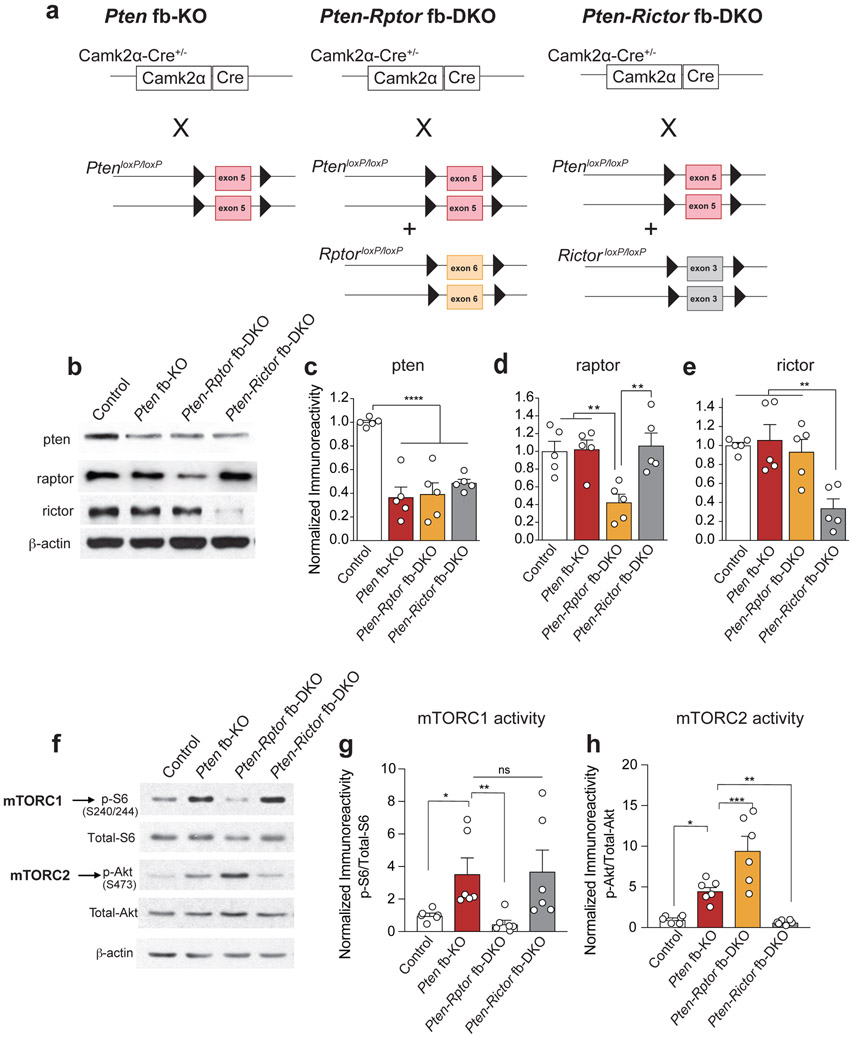
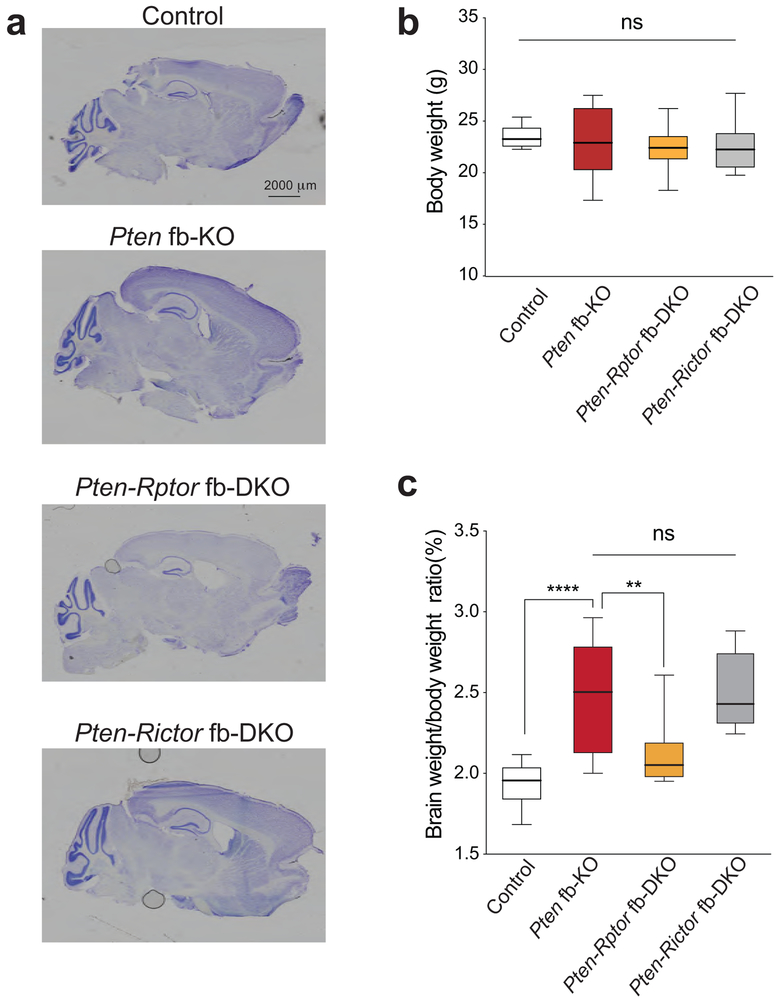
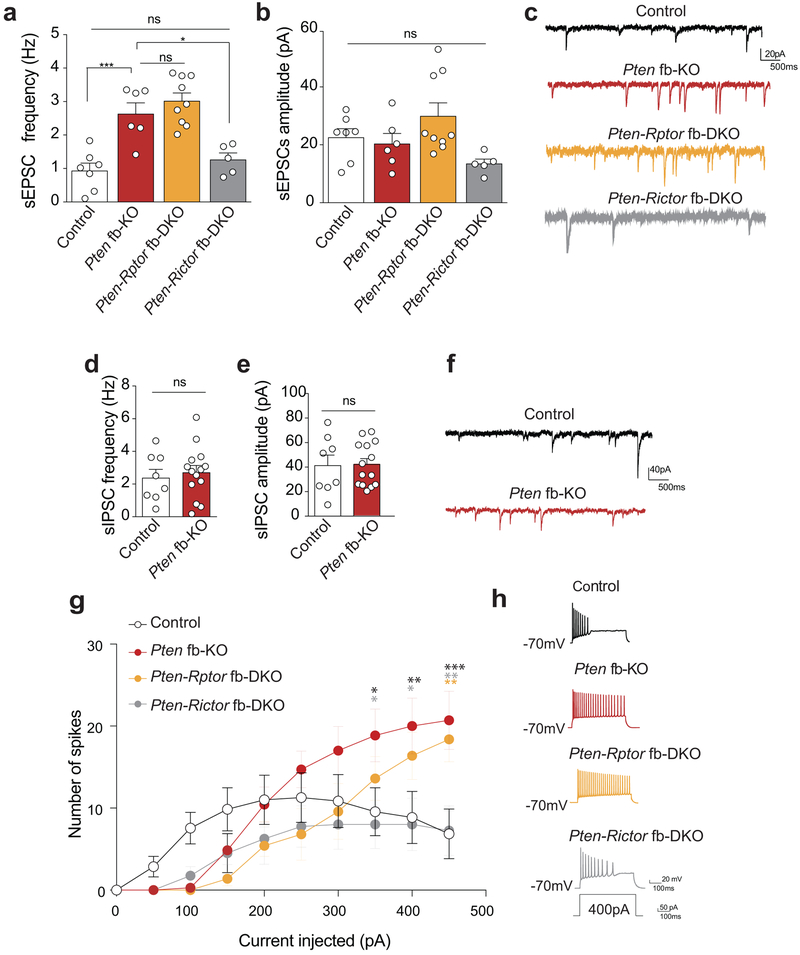
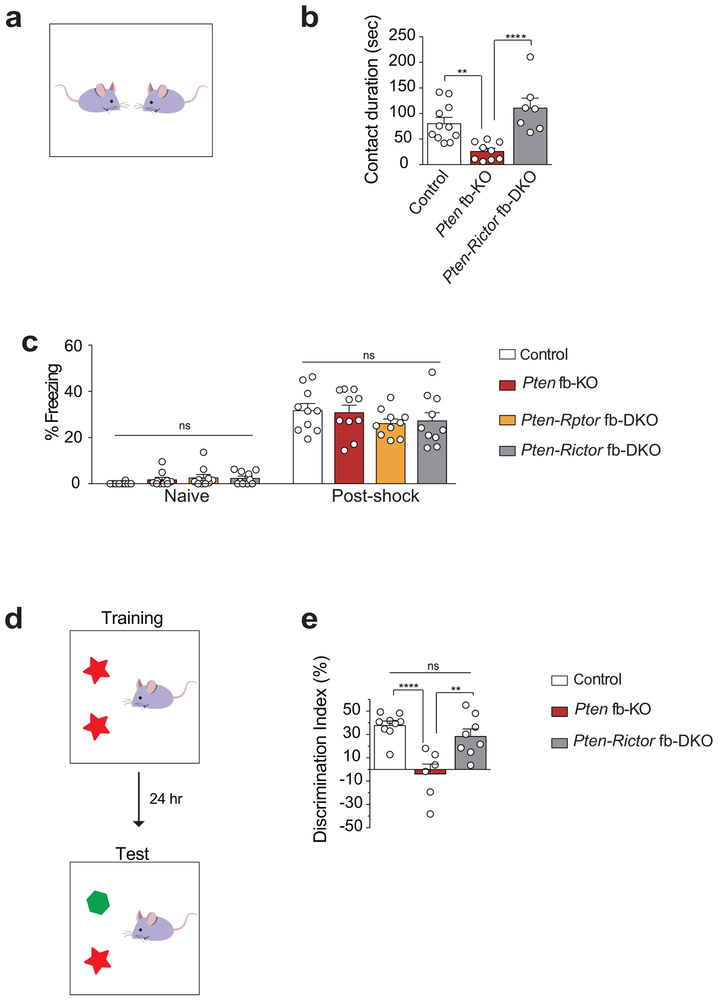
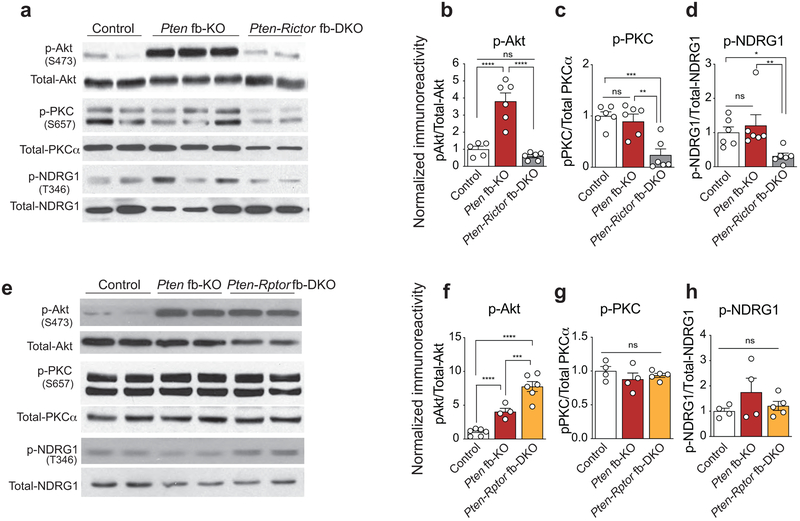
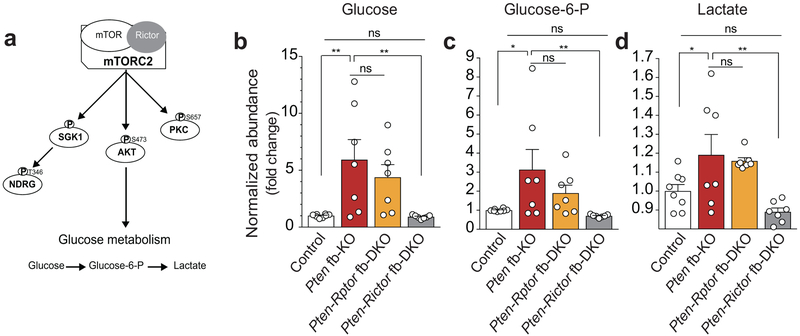
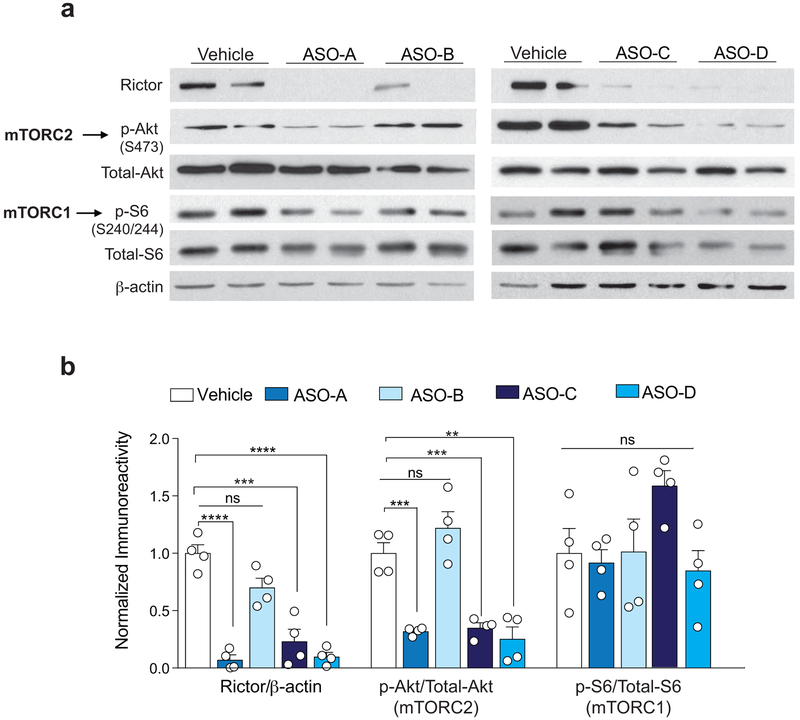
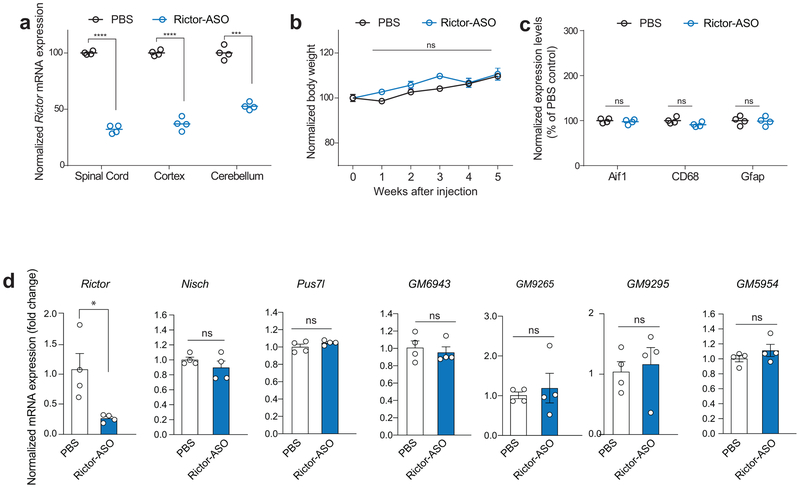
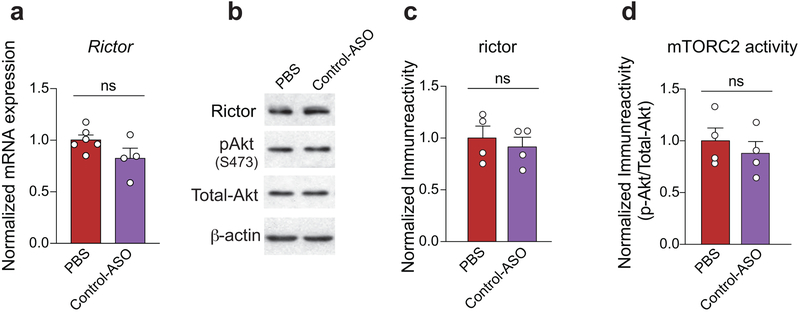
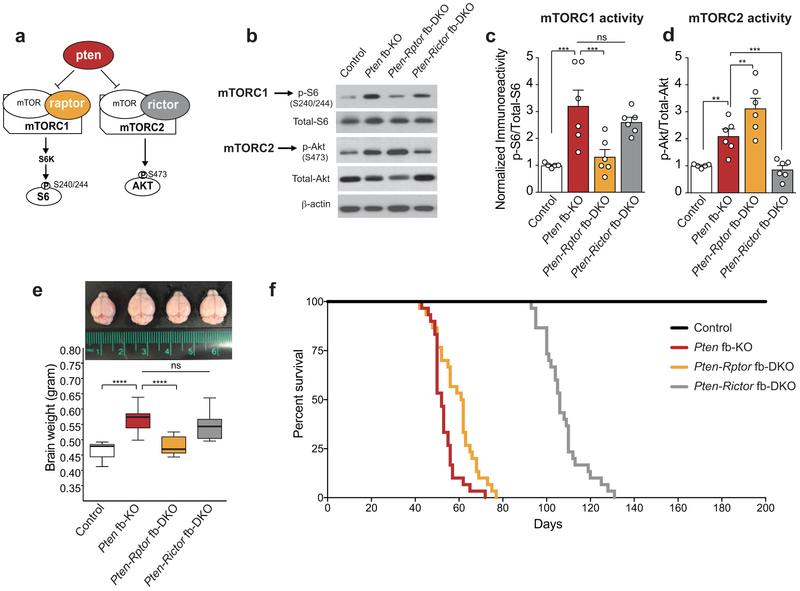
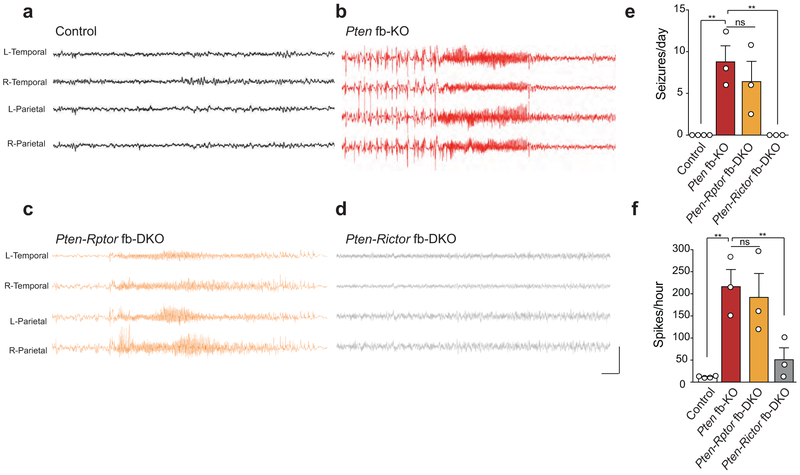
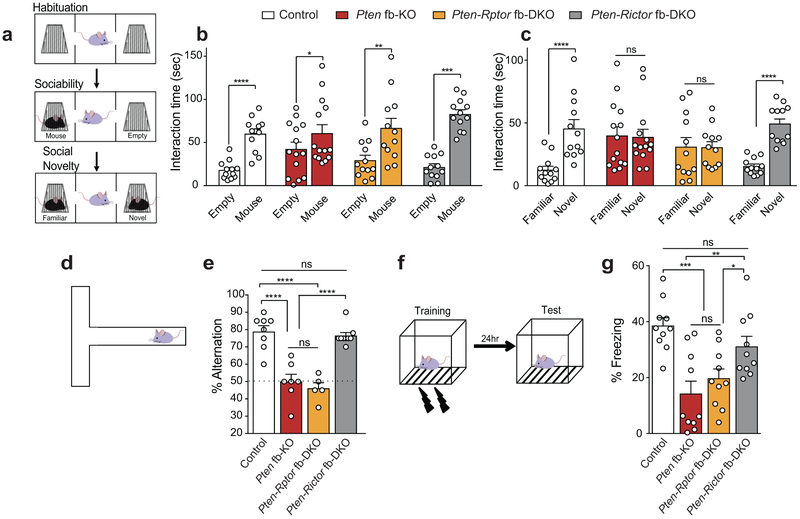
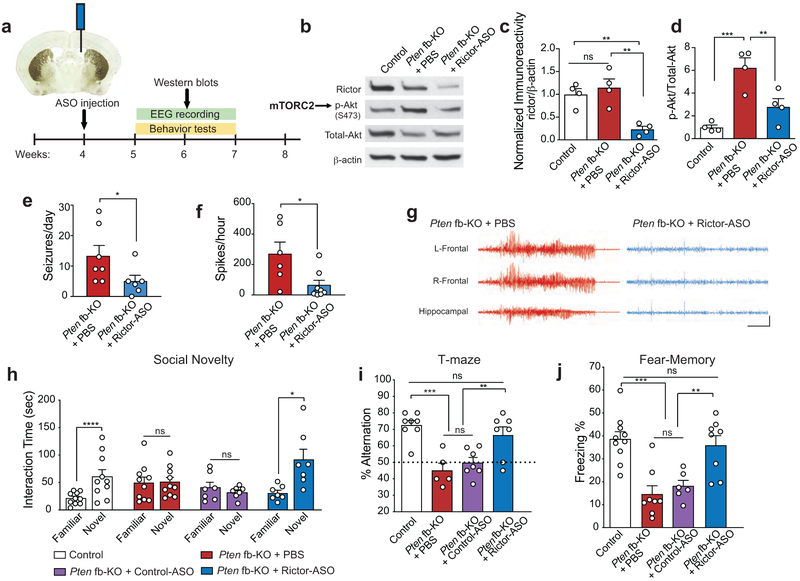
Dysregulation of the mammalian target of rapamycin (mTOR) signaling, which is mediated by two structurally and functionally distinct complexes, mTORC1 and mTORC2, has been implicated in several neurological disorders1-3. Individuals carrying loss-of-function mutations in the phosphatase and tensin homolog (PTEN) gene, a negative regulator of mTOR signaling, are prone to developing macrocephaly, autism spectrum disorder (ASD), seizures and intellectual disability2,4,5. It is generally believed that the neurological symptoms associated with loss of PTEN and other mTORopathies (for example, mutations in the tuberous sclerosis genes TSC1 or TSC2) are due to hyperactivation of mTORC1-mediated protein synthesis1,2,4,6,7. Using molecular genetics, we unexpectedly found that genetic deletion of mTORC2 (but not mTORC1) activity prolonged lifespan, suppressed seizures, rescued ASD-like behaviors and long-term memory, and normalized metabolic changes in the brain of mice lacking Pten. In a more therapeutically oriented approach, we found that administration of an antisense oligonucleotide (ASO) targeting mTORC2's defining component Rictor specifically inhibits mTORC2 activity and reverses the behavioral and neurophysiological abnormalities in adolescent Pten-deficient mice. Collectively, our findings indicate that mTORC2 is the major driver underlying the neuropathophysiology associated with Pten-deficiency, and its therapeutic reduction could represent a promising and broadly effective translational therapy for neurological disorders where mTOR signaling is dysregulated.


Figures

Extended Data Fig. 1
Extended Data Fig. 1. Selective inhibition of mTORC1 or mTORC2 activity in Pten fb-KO mice.
(a) Schematics of generation of forebrain neuron specific Pten-deficient (Pten fb-KO) and double knockout mice (Pten-Rptor fb-DKO and Pten-Rictor fb-DKO). (b-e) Representative western blot (b) and quantification show reduced pten levels in Pten fb-KO mice (c, n = 5, t = 5.22, P < 0.0001), Pten-Rptor fb-DKO (c, n = 5, t = 5.34, P < 0.0001) and Pten-Rictor fb-DKO (c, n = 5, t = 4.50, P = 0.0004) and reduced raptor (d, n = 5 per group , vs. control t = 3.52, P = 0.0028) or rictor (e, n = 5, t = 3.83, P = 0.0015) levels in the hippocampus of Pten-Rptor fb-DKO mice or Pten-Rictor fb-DKO mice, respectively. Representative western blot (f) and quantification (g-h) show increased mTORC1 (g, p-S6 at S240/244) and mTORC2 activity (h, p-Akt at S473) in cortex of Pten fb-KO mice (n = 6 per group, p-S6: t = 2.32, P = 0.03, p-Akt: t = 2.81, P = 0.0111). The increased mTORC1 activity in the cortex of Pten fb-KO mice was reduced in Pten-Rptor fb-DKO mice (n = 6, vs. Pten fb-KO, t = 2.87, P = 0.0091), but not in Pten-Rictor fb-DKO mice (n = 6, vs. Pten fb-KO, t = 0.13, P = 0.8958). By contrast, the increased mTORC2 activity in the cortex of Pten fb-KO mice was reduced in Pten-Rictor fb-DKO mice (t = 3.02, P = 0.0066), but not in Pten-Rptor fb-DKO mice (t = 3.92, P = 0.0009). Data are mean ± SEM. Statistics were based on one-way ANOVA followed by uncorrected two-sided Fisher’s LSD method for pairwise comparisons. n.s., not significant.
Extended Data Fig. 2
Extended Data Fig. 2. Genetic inhibition of mTORC1 (but not mTORC2) reverses the increased brain/body weight ratio in Pten fb-KO mice.
(a) Crystal violet staining of mid-sagittal brain sections from control, Pten fb-KO mice, Pten-Rptor fb-DKO and Pten-Rictor fb-DKO mice (3 mice per group were used for the experiment). (b) Body weight of control (n = 11), Pten fb-KO (n = 9), Pten-Rictor fb-DKO mice (n = 13) and Pten-Rptor fb-DKO (n = 9) was similar (F3,38 = 0.93; P = 0.443). (c) Brain weight relative to body weight in control (n = 11, 0.94 ± 0.04%), Pten fb-KO (n = 9, 2.45 ± 0.34%, vs. control, t = 5.13, P < 0.0001), Pten-Rptor fb-DKO (n = 8, 2.12 ± 0.08%, vs. Pten fb-KO, t = 3.145, P = 0.0034) and Pten-Rictor fb-DKO mice (n = 11, 2.52 ± 0.07%, vs.Pten fb-KO, t = 0.21, P = 0.7810). Box graphs are presented as median, 25th percentile, 75th percentile, minimum, and maximum of the group. Statistics were based on one-way ANOVA followed by uncorrected two-sided Fisher’s LSD method for pairwise comparisons or paired t-test. n.s., not significant.
Extended Data Fig. 3
Extended Data Fig. 3. Genetic inhibition of mTORC2 (but not mTORC1) reverses the increased excitatory synaptic transmission in Pten fb-KO mice.
(a-c) Summary data (a-b) and sample traces (c) show increased frequency (a, Control n = 7, Pten fb-KO n = 6, t = 4.62, P < 0.0001), but not amplitude (b, Control n = 7, Pten fb-KO n = 6, t = 0.47, P = 0.641) of spontaneous excitatory postsynaptic currents (sEPSCs) in CA1 neurons from Pten fb-KO mice compared to control littermates. Unlike in Pten-Rptor fb-DKO mice (n = 9; a, c, Control vs. Pten-Rptor fb-DKO: t = 6.26, P <0.0001), in Pten-Rictor fb-DKO mice (n = 5), sEPSC frequency is restored to control values (a, c, Control vs. Pten-Rictor fb-DKO: t = 0.86, P = 0.99). Data are mean ± SEM. Statistics are based on one-way ANOVA followed by uncorrected two-sided Fisher’s LSD method for pairwise comparisons. (d-f) Summary data (d-e) and sample traces (f) show similar frequency (d, Control n = 8, Pten fb-KO n =14, t = 0.47, P = 0.636) and amplitude (e, Control n = 8, Pten fb-KO n =14, t = 0.09, P = 0.925) of spontaneous inhibitory postsynaptic currents (sIPSCs) in CA1 neurons from control and Pten fb-KO mice. atatistics were based two-sided Student’s t-test Data are mean ± SEM. (g) Input-output curves in CA1 pyramidal neurons show that Pten fb-KO mice and Pten-Rptor fb-DKO mice fired more action potentials (APs) than control littermates at 350pA or higher current injection (n = 7 per group, control vs. Pten fb-KO, 350pA: t = 2.76, P = 0.020; 400 pA: t = 3.23, P = 0.0041; 450 pA: t = 4.13, P = 0.0002). By contrast, the increased excitability in Pten fb-KO mice is reduced in Pten-Rictor fb-DKO mice (n = 7 per group, Pten fb-KO vs. Pten-Rictor fb-DKO, 350 pA: t = 2.76, P = 0.020; 400 pA: t = 3.05, P = 0.010; 450 pA: t = 3.42, P = 0.002. Data are mean ± SEM. Statistics were based on two-way ANOVA followed by Bonferroni’s two-sided multiple comparison test. (h) Representative response elicited in CA1 pyramidal neurons (at −70 mV) upon injection of 400 pA for 500 ms.
Extended Data Fig. 4
Extended Data Fig. 4. Genetic inhibition of mTORC2 rescues the deficits in reciprocal social interaction and long-term object recognition memory in Pten fb-KO mice.
(a) Schematic of the reciprocal social interaction task. (b) Compared to controls (n = 11), Pten fb-KO mice (n = 9) show decreased social interaction (t = 3.42, P = 0.0023). The deficits in reciprocal social interaction are restored in Pten-Rictor fb-DKO mice (n = 7, vs. Pten fb-KO mice, t = 4.69, P < 0.0001). (c) Normal freezing responses in Pten fb-KO mice during training. All groups show similar freezing responses either before (naïve: control, n = 15 vs. Pten fb-KO, n = 12, t = 0.13, P = 0.8948; control vs. Pten-Rptor fb-DKO, n = 12, t = 0.32, P = 0.7941; control vs. Pten-Rictor fb-DKO, n = 12, t = 0.04, P = 0.9668) or immediately after training (post-shock: control vs. Pten fb-KO, t = 0.66, P = 0.5904; control vs. Pten-Rptor fb-DKO, t = 1.46, P = 0.1492; control vs. Pten-Rictor fb-DKO, t = 1.23, P = 0.2238). (d) Schematic of the object recognition task. (e) Pten fb-KO mice showed impaired long-term object recognition memory [control (n = 9), Pten fb-KO (n = 6), t = 4.89, P < 0.0001), which was rescued in Pten-Rictor fb DKO mice [Pten-Rictor fb DKO mice (n = 8) vs. Pten fb-KO mice, t = 3.71, P = 0.0014; Pten-Rictor fb DKO mice vs. control, t = 1.18, P = 0.2518]. Data are mean ± SEM. Statistics were based on two-way ANOVA followed by uncorrected two-sided Fisher’s LSD method for pairwise comparisons. n.s., not significant.
Extended Data Fig. 5
Extended Data Fig. 5. Selective increase in p-Akt in Pten fb-KO mice is reduced by genetic inhibition of mTORC2
Representative western blots (a) and quantifications (b-d) show that compared to control mice, p-Akt at Ser473 (but not p-PKC or p-NDRG1) is the only mTORC2 downstream target whose activity is upregulated in the brain of Pten fb-KO mice [control vs. Pten fb-KO (n = 5-6 per group), p-Akt (b): t = 6.11, P < 0.0001, p-PKC (c): t = 0.64, P = 0.5291, p-NDRG1 (d): t = 0.69, P = 0.4983). As expected, genetic deletion of mTORC2 reduced the activity of all three mTORC2 targets (p-Akt, p-PKC and p-NDRG1) in the brain of Pten-Rictor fb-DKO (n = 6, vs. control p-Akt (b): t = 0.89, P = 0.3903, p-PKC (c): t = 4.56, P = 0.0004, p-NDRG1 (d): t = 2.31, P = 0.0359; vs. Pten fb-KO, p-Akt: t = 7.33, P < 0.0001, p-PKC: t = 3.91, P = 0.0014, p-NDRG1: t = 2.99, P = 0.0090). Compared to Pten fb-KO mice, genetic deletion of mTORC1 in Pten-Rptor fb-DKO did not decrease p-Akt (e-f:,Pten fb-KO (n = 4) vs. Pten-Rptor fb-DKO (n = 6), t = 4.59, P = 0.0005; control (n = 5) vs. Pten-Rptor fb-DKO, t = 9.31, P < 0.0001), p-PKC (e,g:,Pten fb-KO (n = 4) vs. Pten-Rptor fb-DKO (n = 5), t = 0.65, P = 0.5332; control (n = 4) vs. Pten-Rptor fb-DKO, t = 0.73, P = 0.4820) or p-NDRG1 (e,h: Pten fb-KO (n = 4) vs. Pten-Rptor fb-DKO (n = 5), t = 1.19, P = 0.2581; control (n = 4) vs. Pten-Rptor fb-DKO, t = 0.46, P = 0.6527). Data are mean ± SEM. Statistics were based on one-way ANOVA followed by uncorrected two-sided Fisher’s LSD method for pairwise comparisons. n.s., not significant.
Extended Data Fig. 6
Extended Data Fig. 6. Genetic inhibition of mTORC2 rescues the changes in glucose metabolism in the brain of Pten fb-KO mice.
(a) Schematic of mTORC2 regulation of glucose metabolism through the phosphorylation of Akt. (b-d) Metabolomic study revealed an increase in glycolysis metabolites in Pten fb-KO mice, which is normalized when mTORC2, but not mTORC1, is inhibited. The level of glucose (b), glucose-6-phosphate (c) and lactate (d) were increased in the cortex of Pten fb-KO mice (control (n = 8) vs. Pten fb-KO (n = 7): glucose, t = 3.51, P = 0.0017; glucose-6-phosphate, t = 2.77, P = 0.0103; lactate, t = 2.41, P = 0.024). The changes in glucose metabolism are reversed in Pten-Rictor fb-DKO mice (n = 7, vs. control: glucose, t = 0.067, P = 0.9469; glucose-6-phosphate, t = 0.39, P = 0.7009; lactate t = 1.39, P = 0.1771), but not in Pten-Rptor fb-DKO mice [Pten-Rictor fb-KO mice (n = 7) vs. Pten-Rptor fb-DKO (n = 7): glucose, t = 1.07, P = 0.2962; glucose-6-phosphate, t = 1.55, P = 0.1355; lactate t = 0.39, P = 0.6993). Data are mean ± SEM. Statistics were based on one-way ANOVA followed by uncorrected two-sided Fisher’s LSD method for pairwise comparisons. n.s., not significant.
Extended Data Fig. 7
Extended Data Fig. 7. No major changes in mitochondria number, electron transport chain function or the abundance of TCA cycle metabolites in the brain of Pten fb-KO mice.
(a-b) No differences in mitochondria DNA copy number (a, n = 5 per group, F3,16 = 0.21, P = 0.1229) or ETC enzyme activity [b, control (n = 4) Pten fb-KO (n = 3), Pten-Rptor fb-KO (n = 3), Pten-Rictor fb-KO (n = 3), F3,9 = 0.16, P = 0.3782) were observed between the cortexes of control and Pten-deficient mice. (c) The abundance of TCA cycle metabolites did not dramatically change in the brain of Pten fb-KO mice [control (n = 8) vs. Pten fb-KO (n = 7): citrate, t = 0.60, P = 0.5512; alpha-ketoglutarate, t = 1.45, P = 0.1545; malate, t = 1.79, P = 0.0858, fumarate, t = 0.3983, P = 0.69. Control vs. Pten-Rptor fb-DKO (n = 7): citrate, t = 0.95, P = 0.3522; alpha-ketoglutarate, t = 0.62, P = 0.5404; malate, t = 0.41, P = 0.6833; fumarate, t = 1.37, P = 0.1816. control vs. Pten-Rictor fb-DKO n = 7, citrate, t = 0.5512, P = 0.5864; alpha-ketoglutarate, t = 0.2, P = 0.8455; malate, t = 0.43, P = 0.6687, fumarate, t = 0.39, P = 0.6973]. Data are mean ± SEM. Statistics were based on one-way ANOVA followed by uncorrected two-sided Fisher’s LSD method for pairwise comparisons. n.s., not significant.
Extended Data Fig. 8
Extended Data Fig. 8. ASO-A (Rictor-ASO) reduces mTORC2 (but not mTORC1) activity in cortical neurons in culture.
(a-b) Cortical neurons were treated for 72 hours with different ASOs (10 μM) designed to target Rictor mRNA. Representative western blots (a) and quantification (b) show that ASO-A strongly reduces both rictor protein level (n = 4 per group, t6 = 10.94, P = 0.0001) and mTORC2 activity (t6 = 7.25, P = 0.0010), but had no effect on mTORC1 activity (t6 = 0.33, P = 0.9846). Data are mean ± SEM. Values were compared relative to the vehicle treated group and statistics were based on two-sided t-test comparisons. n.s., not significant.
Extended Data Fig. 9
Extended Data Fig. 9. Rictor-ASO selectively reduces Rictor mRNA levels in vivo and is safe.
Control mice were injected with Rictor-ASO and monitored for 5 weeks after injection. (a) Rictor-ASO reduced Rictor mRNA levels in spinal cord (n = 4 per group, t6 = 40.76, P < 0.0001), cortex (n = 4 per group, t6 = 16.77, P < 0.0001) and cerebellum (n = 4 per group, t6 = 11.44, P < 0.001). (b) Rictor-ASO-injected mice showed normal weight gain several weeks post-injection (F5,30 = 2,10, P = 0.0875). (c) mRNA expression of gliosis marker (Gfap) and microglia inflammatory markers (Aif1, CD68) were normal in the brain of Rictor-ASO injected mice (Aif1: n = 4 per group, t6 = 0.60, P = 0.544; CD68: n = 4 per group, t6 = 2.12, P = 0.783; Gfap: n = 4 per group, t6 = 0.17, P = 0.8673). Circles represent number of animals per condition. (d) Control mice were injected with Rictor-ASO and the hippocampus was isolated 2 weeks post-injection. Rictor-ASO selectively reduces Rictor mRNA levels, but did not change the expression of Nisch, Plus7, GM6943, GM9265, GM9295 and GM5954 (n = 4 per group, PBS vs. Rictor-ASO: Rictor: t6 = 3.06, P = 0.0223; Nisch: t6 = 1.11, P = 0.3094; Pus7l: t6 = 1.40, P = 0.2106; GM6943: t6 = 0.54, P = 0.6061, GM9265: t6 = 0.48, P = 0.6513; GM9295: t6 = 0.39, P = 0.71; GM5954: t6 = 1.19, P = 0.2763). Data are mean ± SEM. n represents one biological independent mouse. Statistics were based on two-sided t-test comparisons. n.s., not significant.
Extended Data Fig. 10
Extended Data Fig. 10. A control ASO (Control-ASO) failed to reduce Rictor mRNA levels and inhibit mTORC2 activity.
(a) Treatment with Control-ASO did not reduce Rictor mRNA [PBS (n = 6) vs. Control-ASO (n = 4), t8 = 1.88, P = 0.0968]. Representative western blot image (b) and quantification of (c-d) show that Control-ASO did not decrease rictor protein levels (n = 4 per group, PBS vs. control-ASO t6 = 0.57, P = 0.5864) or mTORC2 activity (n = 4 per group, PBS vs. control-ASO, t6 = 0.71, P = 0.5018). Data are mean ± SEM. Statistics were based on two-sided t-test comparisons. n.s., not significant.
Figure 1.
Figure 1.. Genetic inhibition of mTORC1 (but not mTORC2) reverses increase in brain size, while genetic inhibition of mTORC2 (but not mTORC1) prolongs survival in Pten fb-KO mice.
(a) Schematic of mTORC1 and mTORC2 signaling pathways. (b-d) Representative western blots (b) and quantification (c-d) show increased mTORC1 (p-S6 at S240/244) and mTORC2 activity (p-Akt at S473) in hippocampus of Pten fb-KO mice compared to control mice [control (n = 5), Pten fb-KO (n = 6); p-S6: t = 4.36, P = 0.0003, p-Akt: t = 3.08, P = 0.0062]. The increased mTORC1 activity in the hippocampus of Pten fb-KO mice was reduced in Pten-Rptor fb-DKO mice (n = 6, Pten-fb-KO vs. Pten-Rptor fb-DKO, t = 4.41, P =0.0003), but not in Pten-Rictor fb-DKO mice (n = 6, Pten-fb-KO vs. Pten-Rictor fb-DKO, t = 1.05, P = 0.3050). By contrast, the increased mTORC2 activity in Pten fb-KO mice was reduced in Pten-Rictor fb-DKO mice (Pten-fb-KO vs. Pten-Rictor fb-DKO, t = 4.41, P = 0.0003), but not in Pten-Rptor fb-DKO mice (Pten-fb-KO vs. Pten-Rptor fb-DKO, t = 3.11, P =0.0058). Statistics were based on onw-way ANOVA (two-tailed) followed by uncorrected Fisher’s LSD. Data are presented as mean ± SEM (e) Compared to control mice, Pten fb-KO mice exhibit macrocephaly [control (n = 11) vs. Pten fb-KO (n = 9), t = 6.42, P < 0.0001], which was rescued in Pten-Rptor fb-DKO mice (n = 8, Pten fb-KO vs. Pten-Rptor fb-DKO, t = 5.23, P < 0.0001; control vs. Pten-Rptor fb-DKO, t = 0.74, P = 0.4631), but not in Pten-Rictor fb-DKO mice (n = 11, Pten fb-KO vs. Pten-Rictor fb-DKO, t = 1.35, P = 0.1834). The box plot presents the median, 25th percentile, 75th percentile, minimum, and maximum values of the group. . Statistics are based on one-way ANOVA followed by uncorrected Fisher’s LSD method (two-tailed) for pairwise comparisons. (f) Survival curves show that lifespan in Pten-Rictor fb-DKO mice is significantly increased compared to Pten fb-KO mice and Pten-Rptor fb-DKO mice (n = 30 per group, two-sided Log-Rank test, P < 0.0001). n.s., not significant.
Figure 2.
Figure 2.. Genetic inhibition of mTORC2 prevents the development of seizures in Pten fb-KO mice.
(a-d) Representative EEG traces from control mice (a), Pten fb-KO mice (b), Pten-Rptor fb-DKO mice (c) and Pten-Rictor fb-DKO (d). (e) Compared to control mice, Pten fb-KO and Pten-Rptor fb-DKO mice exhibit frequent generalized seizures [seizures per day; control (n = 4) vs. Pten fb-KO (n = 3): t = 4.62, P = 0.0013; control vs. Pten-Rptor fb-DKO (n = 3): t = 3.38, P = 0.0082]. By contrast, seizures were fully suppressed in Pten-Rictor fb-DKO mice (Pten fb-KO vs. Pten-Rictor fb-DKO: n = 3 per group, t = 4.32, P = 0.0019). (f) Compared to control mice, Pten fb-KO and Pten-Rptor fb-DKO mice exhibit increased interictal spikes [spikes per hour; control (n = 4) vs. Pten fb-KO (n = 3): t = 4.63, P = 0.0012; control vs. Pten-Rptor fb-DKO (n = 4): t = 4.01, P = 0.0027). In contrast, the increased interictal spikes are suppressed in Pten-Rictor fb-DKO mice (spikes per hour; Pten fb-KO vs. Pten-Rictor fb-DKO: n = 3 per group, t = 3.50, P = 0.0067). Calibration: 3 sec and 1500 μV. Data are mean ± SEM. Statistics are based on one-way ANOVA followed by uncorrected two-sided Fisher’s LSD method for pairwise comparisons. n.s., not significant.
Figure 3.
Figure 3.. Genetic inhibition of mTORC2 prevents the behavioral abnormalities in Pten fb-KO mice.
(a) Schematic of the three-chamber social interaction task. (b) In the sociability test, like control mice, Pten fb-KO mice spent more time interacting with a mouse than with an empty wire cup [mouse vs. empty cup interaction time, control (n = 12), t11 = 6.60, P < 0.0001; Pten fb-KO (n = 14), t13 = 2.22, P = 0.0446; Pten-Rptor fb-DKO (n = 12), t11 = 3.74, P = 0.0033; Pten-Rictor fb-DKO (n = 12), t11 = 5.71, P = 0.0001). (c) In the social novelty test, Pten fb-KO mice showed no preference interacting with a novel vs. a familiar mouse (t13 = 0.29, P = 0.7736) compared to control mice (t11 = 9.87, P < 0.0001). Unlike genetic inhibition of mTORC1 (Pten-Rptor fb-DKO, t11 = 0.99, P = 0.3411), genetic inhibition of mTORC2 reversed the deficits in social novelty in Pten-deficient mice (Pten fb-KO vs. Pten-Rictor fb-DKO, t11 = 6.36, P < 0.0001). Statistics are based on paired t-test. Data are mean ± SEM. (d) Schematic of the T-maze spontaneous alteration task. (e) Compared to controls (n = 8, 78.7 ± 3.5 %), both Pten fb-KO mice (n = 7, 50.0 ± 4.2 %, control vs. Pten fb-KO, t = 6.38, P < 0.0001) and Pten-Rptor fb-DKO mice (n = 5, 46.0 ± 3.3%, control vs. Pten-Rptor fb-DKO, t = 6.59, P < 0.0001) showed impaired spontaneous alternation, which was not significantly different from chance level. By contrast, Pten-Rictor fb-DKO mice showed normal spontaneous alteration (n = 9, 76.4 ± 1.83 %, vs. control t = 0.54, P = 0.5959; Pten fb-KO mice vs. Pten-Rictor fb-DKO mice, t = 6.02, P < 0.0001). (f) Schematic of the contextual fear conditioning test paradigm. (g) Compared to control, both Pten fb-KO mice and Pten-Rptor fb-DKO mice show impaired long-term fear memory (n = 10 per group, control vs. Pten fb-KO, t = 4.72, P < 0.0001; control vs. Pten-Rptor fb-DKO, t = 3.65, P = 0.0008). By contrast, long-term fear memory is greatly improved in Pten-Rictor fb-DKO mice (n = 10, Pten fb-KO vs. Pten-Rictor fb-DKO, t = 3.27, P = 0.0024; control vs. Pten-Rictor fb-DKO, t = 1.44, P = 0.1569 Statistics are based on one-way ANOVA comparison followed by uncorrected two-sided Fisher’s LSD method for pairwise comparisons. n.s., not significant.
Figure 4.
Figure 4.. Injection of antisense oligonucleotide targeting mTORC2 component Rictor improved seizures, memory and ASD-like behaviors in Pten fb-KO mice.
(a) Schematic of Rictor antisense oligonucleotide (Rictor-ASO) treatment and experimental design. Representative western blots (b) and quantification (c-d) show that intracerebroventricular (ICV) injection of Rictor-ASO reduced both rictor protein levels (c, n = 4 per group, Pten fb-KO + PBS vs. Pten fb-KO + Rictor-ASO, t = 4.77, P = 0.0010) and mTORC2 activity (d, n = 4 per group, Pten fb-KO + PBS vs. Pten fb-KO + Rictor-ASO, t = 3.71, P = 0.0048) in the hippocampus of Pten fb-KO mice. Statistics are based on one-way ANOVA comparison followed by uncorrected two-sided Fisher’s LSD method for pairwise comparisons. (e-f) Rictor-ASO injection attenuated EEG seizures [e, seizures per day: Pten fb-KO + PBS (n = 7), vs. Pten fb-KO + Rictor-ASO (n = 6), t = 2.18, P = 0.0314] and the increased interictal spikes [f, spikes/hour: Pten fb-KO + PBS (n = 6) vs. Pten fb-KO + Rictor-ASO (n = 8), t = 2.41, P = 0.048] in Pten fb-KO mice. (g) Representative EEG traces in Rictor-ASO-injected Pten fb-KO mice. Calibration: 5 sec and 500 μV. Statistics are based on one-way ANOVA comparison followed by uncorrected two-sided Fisher’s LSD method for pairwise comparisons. (h) Treatment with Rictor-ASO rescued the deficits in social novelty in Pten fb-KO mice [control (n = 10), t9 = 6.98, P < 0.0001; Pten fb-KO + PBS (n = 10), t9 = 0.83, P = 0.4301; Pten fb-KO + Control-ASO (n = 7), t6 = 0.41, P = 0.6936; Pten fb-KO + Rictor-ASO, n = 7, t6 = 3.46, P = 0.0135). Statistics are based on paired t-test. (i-j) Treatment with Rictor-ASO improves spontaneous alteration in the T-maze [i, Control (n = 8), 72.5 ± 2.84 %; Pten fb-KO + PBS (n = 5), 45.0 ± 4.47 %; Pten fb-KO + Control-ASO (n = 6), 49.73 ± 3.23 %; Pten fb-KO + Rictor-ASO (n = 7), 66.43 ± 5.80 %, control vs. Pten fb-KO + PBS, t = 4.75, P < 0.0001; Pten fb-KO + PBS vs. Pten fb-KO + Rictor-ASO, t = 3.60, P = 0.0015; Pten fb-KO + Control-ASO vs. Pten fb-KO + Rictor-ASO, t = 3.08, P = 0.0053; Pten fb-KO + PBS vs. Pten fb-KO + Control-ASO, t = 0.79, P = 0.435, control vs. Pten fb-KO + Rictor-ASO, t = 1.16, P = 0.26] and long-term contextual fear memory in Pten fb-KO mice [j, Control (n = 10) vs. Pten fb-KO + PBS (n = 8), t = 4.98, P < 0.0001; Pten fb-KO + PBS vs. Pten fb-KO + Rictor-ASO (n = 8), t = 4.18, P = 0.0003; Pten fb-KO + Control-ASO (n = 6) vs. Pten fb-KO + Rictor-ASO, t = 3.23, P = 0.0032; Pten fb-KO + PBS vs. Pten fb-KO + Control-ASO, t = 0.65, P = 0.5233; control vs. Pten fb-KO + Rictor-ASO, t = 0.57, P = 0.5729). Statistics are based on one-way ANOVA comparison followed by uncorrected two-sided Fisher’s LSD method for pairwise comparisons. Data are presented as mean ± SEM.

Comment in

References

    1. Ehninger D & Silva AJ Rapamycin for treating Tuberous sclerosis and Autism spectrum disorders. Trends in molecular medicine 17, 78–87 (2011). - PMC - PubMed
    1. Winden KD, Ebrahimi-Fakhari D & Sahin M Abnormal mTOR Activation in Autism. Annual review of neuroscience (2018). - PubMed
    1. Costa-Mattioli M & Monteggia LM mTOR complexes in neurodevelopmental and neuropsychiatric disorders. Nature neuroscience 16, 1537–1543 (2013). - PubMed
    1. Zhou J & Parada LF PTEN signaling in autism spectrum disorders. Current opinion in neurobiology (2012). - PubMed
    1. Knafo S & Esteban JA PTEN: Local and Global Modulation of Neuronal Function in Health and Disease. Trends in neurosciences 40, 83–91 (2017). - PubMed

Methods-only References

    1. Kwon CH, et al. Pten regulates neuronal soma size: a mouse model of Lhermitte-Duclos disease. Nature genetics 29, 404–411 (2001). - PubMed
    1. Huang W, et al. mTORC2 controls actin polymerization required for consolidation of long-term memory. Nature neuroscience 16, 441–448 (2013). - PMC - PubMed
    1. Zhu PJ, et al. Suppression of PKR promotes network excitability and enhanced cognition by interferon-gamma-mediated disinhibition. Cell 147, 1384–1396 (2011). - PMC - PubMed
    1. Buffington SA, et al. Microbial Reconstitution Reverses Maternal Diet-Induced Social and Synaptic Deficits in Offspring. Cell 165, 1762–1775 (2016). - PMC - PubMed
    1. Silverman JL, Yang M, Lord C & Crawley JN Behavioural phenotyping assays for mouse models of autism. Nature reviews. Neuroscience 11, 490–502 (2010). - PMC - PubMed

Publication types

MeSH terms

Substances