. 2019 Dec;16(12):1247-1253.
doi: 10.1038/s41592-019-0612-7. Epub 2019 Oct 21.

Nucleus segmentation across imaging experiments: the 2018 Data Science Bowl

Affiliations

Nucleus segmentation across imaging experiments: the 2018 Data Science Bowl

Juan C Caicedo et al. Nat Methods. 2019 Dec.

Erratum in

Abstract

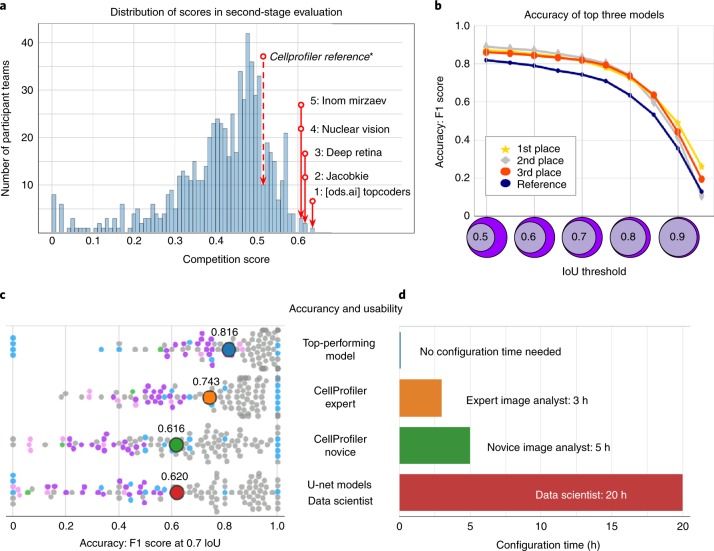
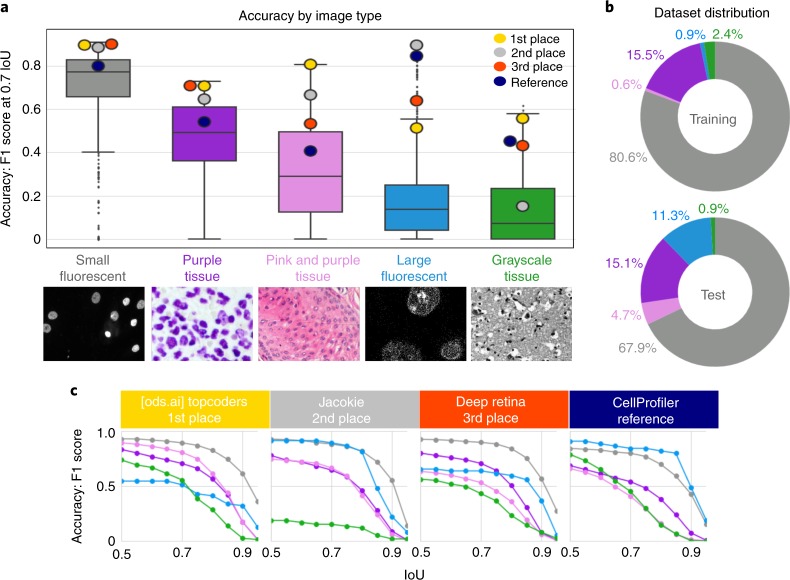
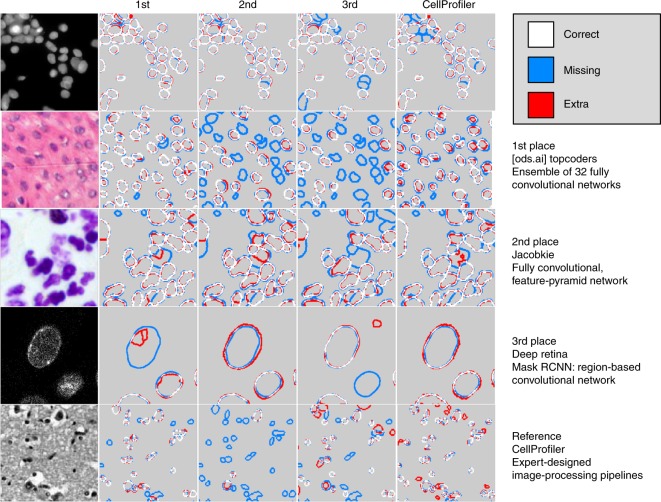
Segmenting the nuclei of cells in microscopy images is often the first step in the quantitative analysis of imaging data for biological and biomedical applications. Many bioimage analysis tools can segment nuclei in images but need to be selected and configured for every experiment. The 2018 Data Science Bowl attracted 3,891 teams worldwide to make the first attempt to build a segmentation method that could be applied to any two-dimensional light microscopy image of stained nuclei across experiments, with no human interaction. Top participants in the challenge succeeded in this task, developing deep-learning-based models that identified cell nuclei across many image types and experimental conditions without the need to manually adjust segmentation parameters. This represents an important step toward configuration-free bioimage analysis software tools.


Figures

Fig. 1
Fig. 1. Accuracy and usability of segmentation strategies in the second-stage holdout sets.
a, The histogram counts participant teams (n = 739) according to the official competition score of their best submission. The top five competitors are labeled in the distribution, as is the reference segmentation obtained by an expert analyst using CellProfiler. b, Accuracy of the top three solutions measured as the F1 score at multiple IoU thresholds. The scale of the x axis of the histogram in panel a (competition score) is correlated with the area under the curve of the F1 score versus IoU thresholds. The top three models had a similar performance with slight differences at the tails of the curves. c, Breakdown of accuracy in the second-stage evaluation set for the top performing model and three reference solutions. The distribution of F1-scores at a single IoU threshold (IoU = 0.7) shows points (n = 106) that each represented the segmentation accuracy of one image in the set of 106 annotated images of the second-stage evaluation (Methods). The color of single-image points corresponds to the group of images defined for reference evaluations (Methods and Fig. 2). The average of the distribution is marked with a larger point labeled with the corresponding average accuracy value. d, Estimated time required to configure the segmentation tools evaluated in c (Supplementary Note 4).
Fig. 2
Fig. 2. Performance of submitted solutions across varying, imbalanced image types.
a, Example images of the five visually grouped image types (Methods) are shown across the bottom and the chart shows the spread of F1 scores (Methods) across all second-stage submissions. F1 scores were measured at a threshold of 0.7 IoU (Methods). Box plot: center line, median; box limits, upper and lower quartiles; whiskers, 1.5× interquartile range; points, outliers; colored points, top three participants. b, The distribution of the various image types is shown, color-coded as in a. The top competitors segmented all image types with high accuracy despite the imbalance of examples in the training set. c, Detail of accuracy results by image types and object coverage (IoU) thresholds. The x axis displays IoU thresholds and the y axis represents accuracy measured with F1 scores. For each participant, the plot displays five curves showing the trend of segmentation accuracy at different object coverage thresholds.
Fig. 3
Fig. 3. Example segmentation maps for various images obtained by the top three participants and the CellProfiler reference.
The segmentation maps show pixel-wise alignments between target segmentation masks and predicted segmentations. If the masks align correctly, pixels in the boundaries are colored white. If the target mask or part of it is missing, pixels in the boundaries are colored blue. If the predicted segmentation is introduced in a region without real object, the boundary pixels are red.

References

    1. Sommer C, Gerlich DW. Machine learning in cell biology—teaching computers to recognize phenotypes. J. Cell Sci. 2013;126:5529–5539. doi: 10.1242/jcs.123604. - DOI - PubMed
    1. Boutros M, Heigwer F, Laufer C. Microscopy-based high-content screening. Cell. 2015;163:1314–1325. doi: 10.1016/j.cell.2015.11.007. - DOI - PubMed
    1. Mattiazzi Usaj M, et al. High-content screening for quantitative cell biology. Trends Cell Biol. 2016;26:598–611. doi: 10.1016/j.tcb.2016.03.008. - DOI - PubMed
    1. Schindelin J, et al. Fiji: an open-source platform for biological image analysis. Nat. Methods. 2012;9:676–682. doi: 10.1038/nmeth.2019. - DOI - PMC - PubMed
    1. McQuin C, et al. CellProfiler 3.0: next-generation image processing for biology. PLoS Biol. 2018;16:e2005970. doi: 10.1371/journal.pbio.2005970. - DOI - PMC - PubMed

Publication types

MeSH terms