

Inoculation Pneumonia Caused by Coagulase Negative Staphylococcus
- PMID: 31636610
- PMCID: PMC6787291
- DOI: 10.3389/fmicb.2019.02198
Inoculation Pneumonia Caused by Coagulase Negative Staphylococcus
Abstract
Rationale: Although frequently retrieved in tracheal secretions of critically ill patients on mechanical ventilation, the existence of pneumonia caused by coagulase-negative staphylococci (CoNS) remains controversial.
Objective: To assess whether Staphylococcus haemolyticus (S. haemolyticus) inoculated in mice's trachea can infect normal lung parenchyma, increasing concentrations of S. haemolyticus were intratracheally administered in 221 immunocompetent mice.
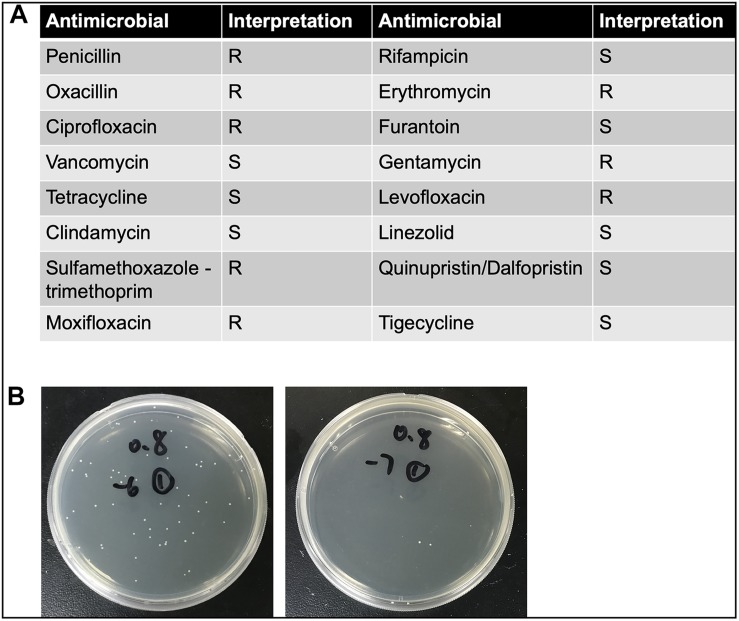
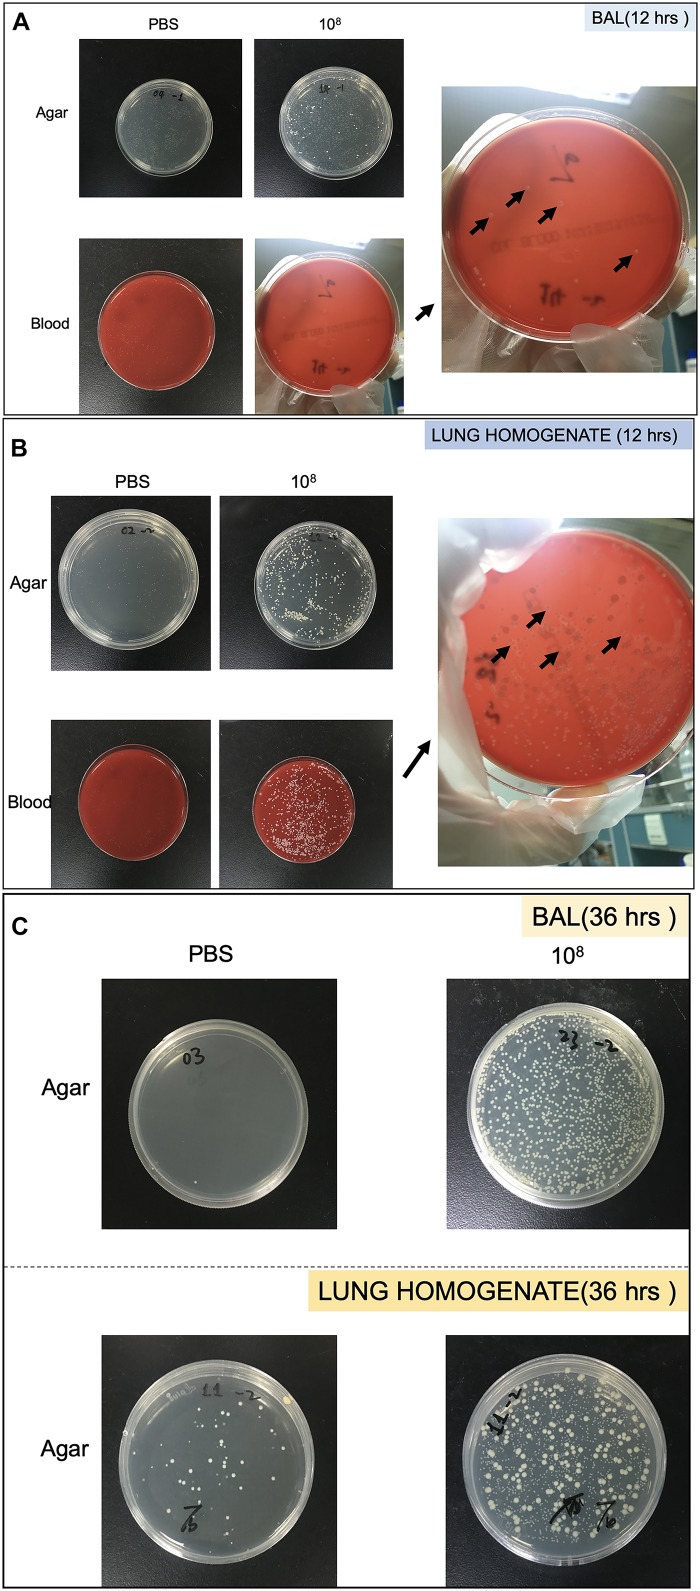
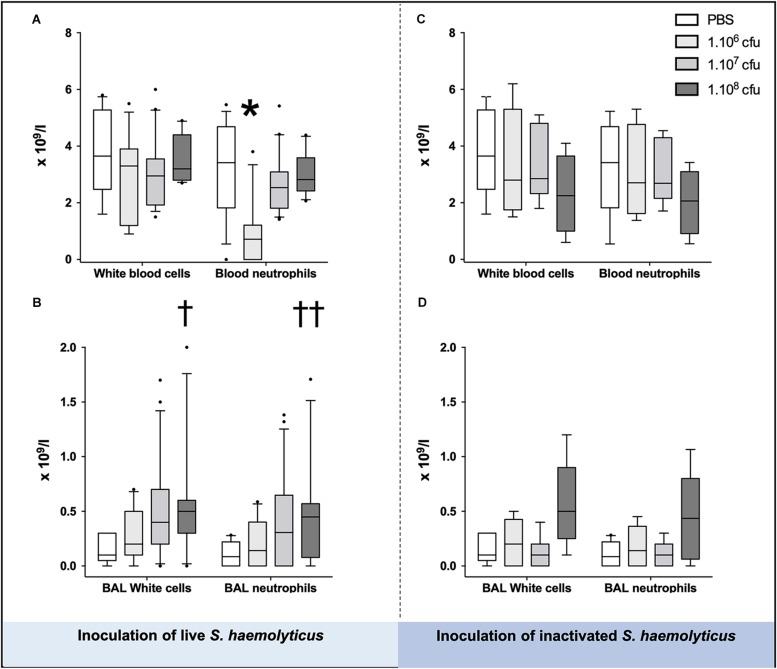
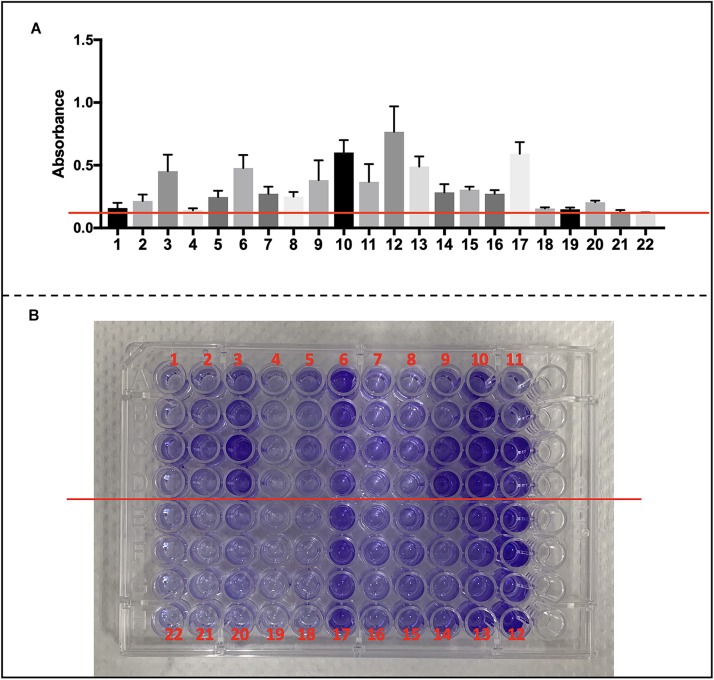
Methods: Each animal received intratracheally phosphate-buffered saline (PBS) (n = 43) or live (n = 141) or inactivated (n = 37) S. haemolyticus at increasing load: 1.0 × 10⁶, 1.0 × 10⁷, and 1.0 × 10⁸ colony forming units (CFU). Forty-three animals were sacrificed at 12 h and 178 were sacrificed at 36 h; 64 served for post-mortem lung histology, 157 served for pre-mortem bronchoalveolar lavage (BAL) analysis, and 42 served for post-mortem quantitative bacteriology of lung tissue. The distribution of biofilm-associated genes was investigated in the S. haemolyticus strain used in our in vivo experiment as well as among 19 other clinical S. haemolyticus strains collected from hospitals or nursing houses.
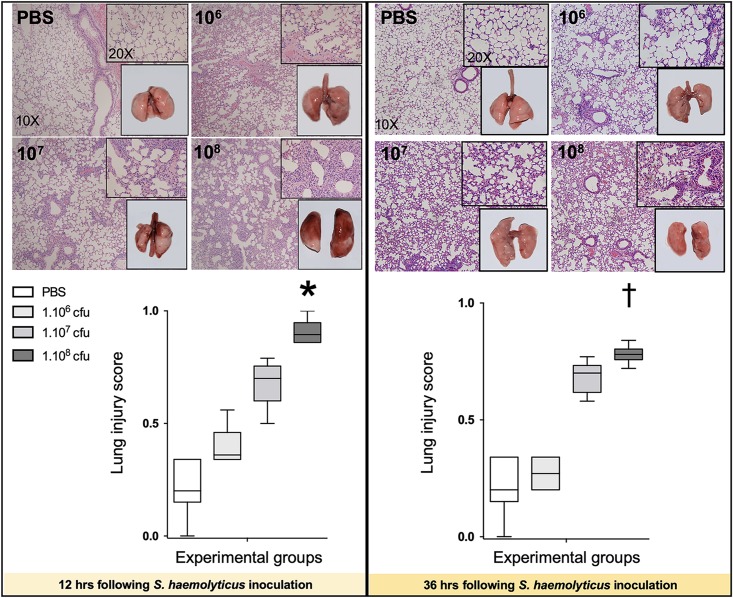
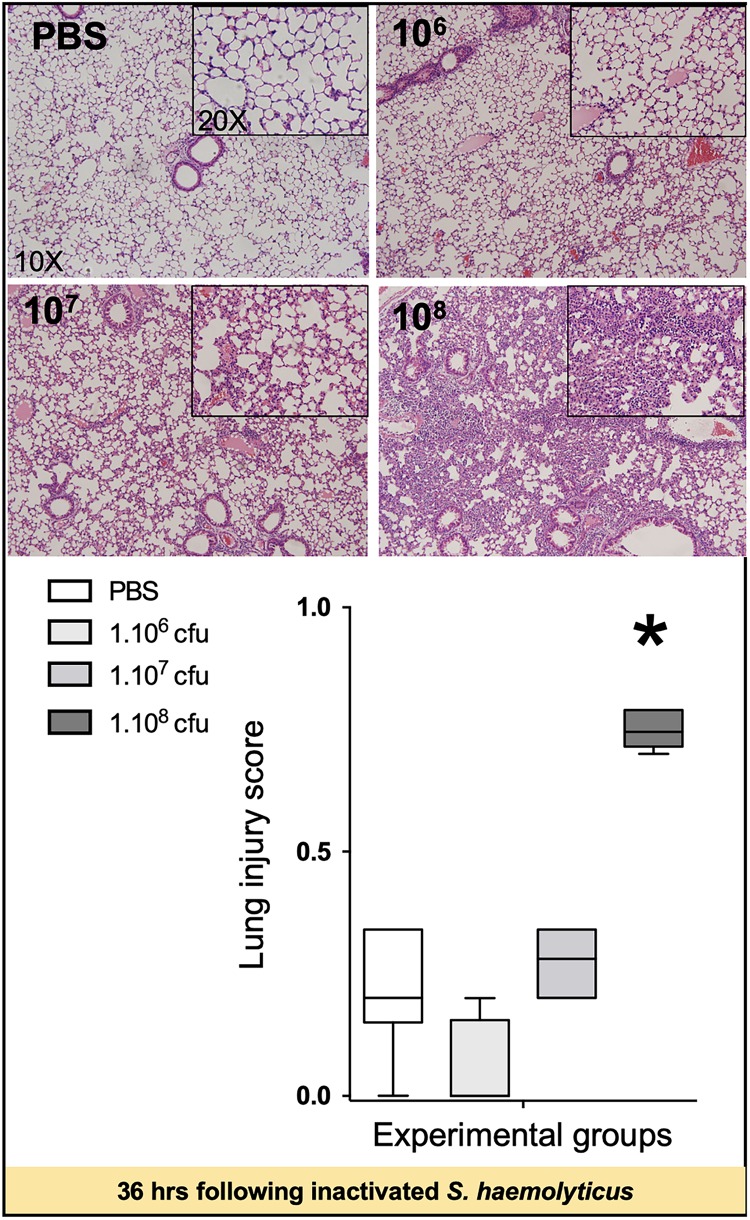
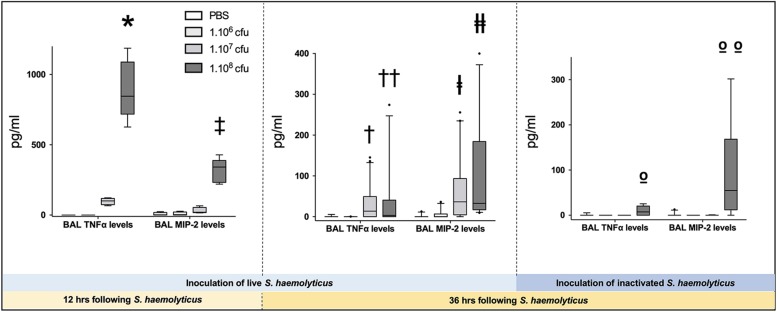
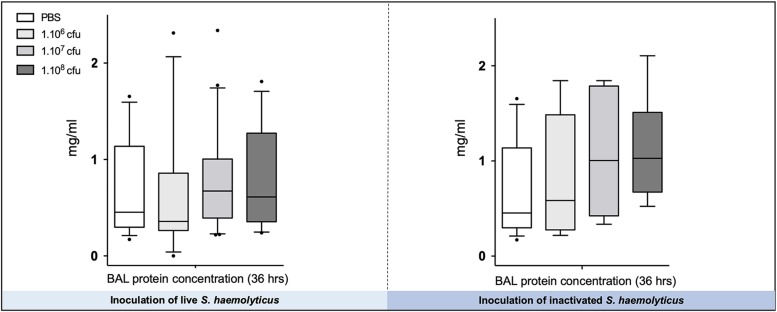
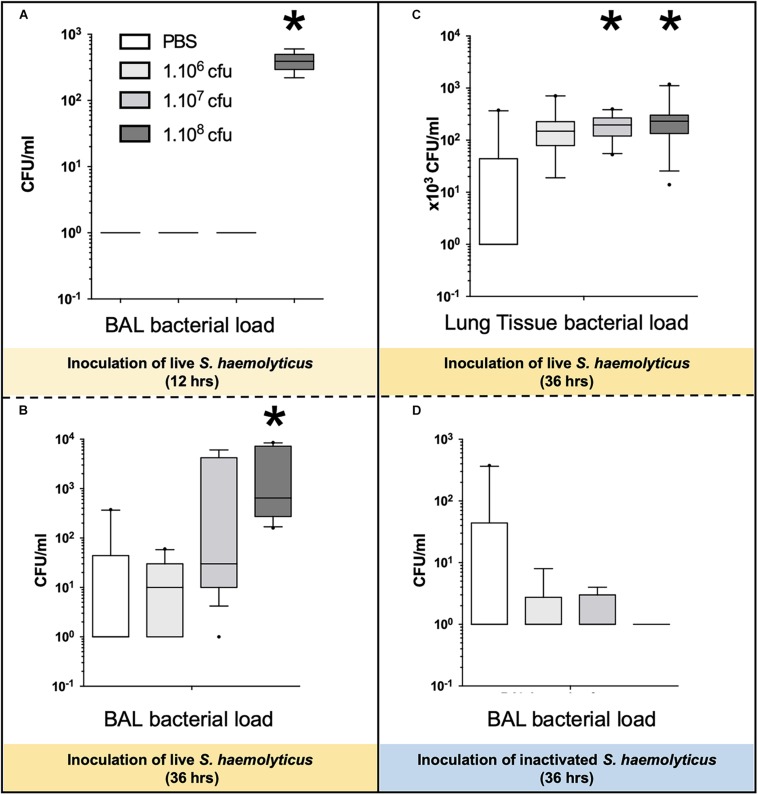
Measurements and main results: Intratracheal inoculation of 1.0 × 10⁸ CFU live S. haemolyticus caused macroscopic and histological confluent pneumonia with significant increase in BAL white cell count, tumor necrosis factor-α (TNF-α), and macrophage inflammatory protein (MIP)-2. At 12 h, high concentrations of S. haemolyticus were identified in BAL. At 36 h, lung injury and BAL inflammation were less severe than at 12 h and moderate concentrations of species belonging to the oropharyngeal flora were identified in lung tissue. The inoculation of 1.0 × 10⁶ and 1.0 × 10⁷ CFU live S. haemolyticus caused histologic interstitial pneumonia and moderate BAL inflammation. Similar results were observed after inoculation of inactivated S. haemolyticus. Moreover, biofilm formation was a common phenotype in S. haemolyticus isolates. The low prevalence of the ica operon in our clinical S. haemolyticus strain collection indicated icaA and icaD independent-biofilm formation.
Conclusion: In immunocompetent spontaneously breathing mice, inoculation of S. haemolyticus causes concentration-dependent lung infection that spontaneously recovers over time. icaA and icaD independent biofilm formation is a common phenotype in S. haemolyticus isolates.
Keywords: Staphylococcus haemolyticus; coagulase-negative staphylococci; inoculation pneumonia; macrophage inflammatory protein-2; tumor necrosis factor-α.
Copyright © 2019 Shi, Monsel, Rouby, Xu, Zhu and Qu.
Figures
Similar articles
-
Staphylococcus epidermidis and Staphylococcus haemolyticus: detection of biofilm genes and biofilm formation in blood culture isolates from patients in a Brazilian teaching hospital.Diagn Microbiol Infect Dis. 2016 Sep;86(1):11-4. doi: 10.1016/j.diagmicrobio.2016.06.006. Epub 2016 Jun 7. Diagn Microbiol Infect Dis. 2016. PMID: 27344542
-
Biofilm Formation Ability and Presence of Adhesion Genes among Coagulase-Negative and Coagulase-Positive Staphylococci Isolates from Raw Cow's Milk.Pathogens. 2020 Aug 14;9(8):654. doi: 10.3390/pathogens9080654. Pathogens. 2020. PMID: 32823918 Free PMC article.
-
[Phenotypic evaluation of hydrophobicity and the ability to produce biofilm in coagulase-negative staphylococci isolated from infected very-low-birthweight newborns].Med Dosw Mikrobiol. 2013;65(3):149-59. Med Dosw Mikrobiol. 2013. PMID: 24432554 Polish.
-
Clinical Infections, Antibiotic Resistance, and Pathogenesis of Staphylococcus haemolyticus.Microorganisms. 2022 May 31;10(6):1130. doi: 10.3390/microorganisms10061130. Microorganisms. 2022. PMID: 35744647 Free PMC article. Review.
-
[Study of the virulence of coagulase-negative staphylococci in experimental infections].Orv Hetil. 1992 Jul 5;133(27):1685-8, 1693. Orv Hetil. 1992. PMID: 1625850 Review. Hungarian.
Cited by
-
Preclinical efficacy and clinical safety of clinical-grade nebulized allogenic adipose mesenchymal stromal cells-derived extracellular vesicles.J Extracell Vesicles. 2021 Aug;10(10):e12134. doi: 10.1002/jev2.12134. Epub 2021 Aug 14. J Extracell Vesicles. 2021. PMID: 34429860 Free PMC article. Clinical Trial.
-
The Emergence of a Multidrug-Resistant and Pathogenic ST42 Lineage of Staphylococcus haemolyticus from a Hospital in China.Microbiol Spectr. 2022 Jun 29;10(3):e0234221. doi: 10.1128/spectrum.02342-21. Epub 2022 May 17. Microbiol Spectr. 2022. PMID: 35579464 Free PMC article.
-
A case of acute bacterial pericarditis in a COVID-19 patient.Singapore Med J. 2022 Aug;63(8):484-486. doi: 10.11622/smedj.2021022. Epub 2021 Mar 12. Singapore Med J. 2022. PMID: 33721972 Free PMC article. No abstract available.
-
Lower respiratory tract infections due to multi‑drug resistant pathogens in central nervous system injuries (Review).Biomed Rep. 2023 Mar 6;18(4):30. doi: 10.3892/br.2023.1612. eCollection 2023 Apr. Biomed Rep. 2023. PMID: 37009311 Free PMC article. Review.
-
Clinical Efficacy and Safety of Arbekacin against Pneumonia in Febrile Neutropenia: A Retrospective Study in Patients with Hematologic Malignancies.Infect Chemother. 2022 Mar;54(1):80-90. doi: 10.3947/ic.2021.0126. Infect Chemother. 2022. PMID: 35384420 Free PMC article.
References
-
- Adam H. J., DeCorby M., Rennie R., Karlowsky J. A., Hoban D. J., Zhanel G. G. (2011). Prevalence of antimicrobial resistant pathogens from blood cultures from Canadian hospitals: Results of the CANWARD 2007-2009 study. Diagn. Microbiol. Infect. Dis 69 307–313. 10.1016/j.diagmicrobio.2010.10.026 - DOI - PubMed
-
- Allignet J., Aubert S., Dyke K. G., El Solh N. (2001). Staphylococcus caprae strains carry determinants known to be involved in pathogenicity: A gene encoding an autolysin-binding fibronectin and the ica operon involved in biofilm formation. Infect. Immun. 69 712–718. 10.1128/iai.69.2.712-718.2001 - DOI - PMC - PubMed
LinkOut - more resources
Full Text Sources
Miscellaneous