. 2019 Jul 15:5:28.
doi: 10.1038/s41378-019-0070-5. eCollection 2019.

A MEMS ultrasound stimulation system for modulation of neural circuits with high spatial resolution in vitro

Affiliations

A MEMS ultrasound stimulation system for modulation of neural circuits with high spatial resolution in vitro

Jungpyo Lee et al. Microsyst Nanoeng. .

Abstract

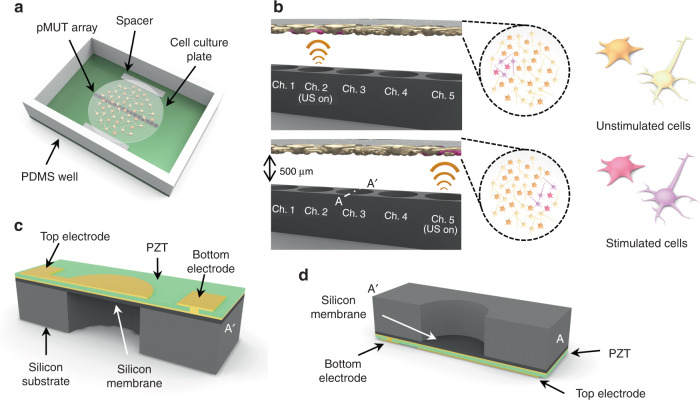
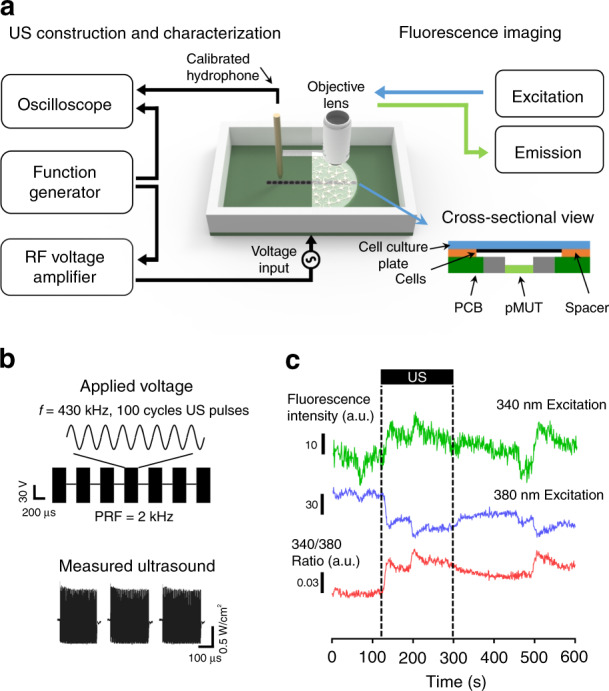
Neuromodulation by ultrasound has recently received attention due to its noninvasive stimulation capability for treating brain diseases. Although there have been several studies related to ultrasonic neuromodulation, these studies have suffered from poor spatial resolution of the ultrasound and low repeatability with a fixed condition caused by conventional and commercialized ultrasound transducers. In addition, the underlying physics and mechanisms of ultrasonic neuromodulation are still unknown. To determine these mechanisms and accurately modulate neural circuits, researchers must have a precisely controllable ultrasound transducer to conduct experiments at the cellular level. Herein, we introduce a new MEMS ultrasound stimulation system for modulating neurons or brain slices with high spatial resolution. The piezoelectric micromachined ultrasonic transducers (pMUTs) with small membranes (sub-mm membranes) generate enough power to stimulate neurons and enable precise modulation of neural circuits. We designed the ultrasound transducer as an array structure to enable localized modulation in the target region. In addition, we integrated a cell culture chamber with the system to make it compatible with conventional cell-based experiments, such as in vitro cell cultures and brain slices. In this work, we successfully demonstrated the functionality of the system by showing that the number of responding cells is proportional to the acoustic intensity of the applied ultrasound. We also demonstrated localized stimulation capability with high spatial resolution by conducting experiments in which cocultured cells responded only around a working transducer.

Keywords: Electrical and electronic engineering; Microfluidics.


Conflict of interest statement

Conflict of interestThe authors declare that they have no conflict of interest.

Figures

Fig. 1
Fig. 1. Schematic illustration of the proposed pMUT array for localized ultrasound stimulation.
a schematic diagram of the pMUT array for ultrasound stimulation on the cell culture plate. A neuron-astrocyte cocultured coverslip located on the pMUT array; b conceptual diagram of the localized stimulation showing that cells were stimulated only by ultrasound from an activated transducer; unstimulated cells are bright yellow (left), and stimulated cells are pink (right); c cross-section of the bottom view of the pMUT unit; d cross-section of the top view of the pMUT unit
Fig. 2
Fig. 2. Fabrication process of the pMUT array (section A–A’ in Fig. 1b).
a A 4-inch silicon-on-insulator (SOI) wafer with 15 μm of top silicon was prepared; b the SOI wafer was bonded with a bulk PZT using CYTOP as a bonding layer; c the PZT film was thinned using a chemical mechanical polishing (CMP) process; the Ti/Pt layers were deposited and patterned on top of the PZT layer; d the PZT layer was etched to form a hole for the bottom electrode; e an Au layer was deposited and patterned to form the top and bottom electrodes; f the membrane was released from the backside through the DRIE process
Fig. 3
Fig. 3. Images of the fabricated pMUT array and packaged device.
a SEM image of the bottom view of the fabricated pMUT array showing section line (A–A’) of Fig. 2; b SEM image of the top view of the fabricated pMUT array; c optical image of the fabricated pMUT array; d optical image of the packaged device with the pMUT array, showing the DIP switches soldered on the PCB to control individual transducers and spacers to maintain a constant distance between the cell culture plate and the transducers; voltage was applied to the pMUT array through an SMA connector
Fig. 4
Fig. 4. Experimental setup for mechanical characterization and optical recording.
a schematic diagram of the characterization (left) and general configuration (right) of the system; b applied voltage signals of 100 cycles, 430-kHz sine wave pulses to the pMUT array and measured acoustic intensity by a calibrated hydrophone; c representative ultrasound-induced fluorescence trace of ratiometric dye Fura-2 AM showing fluorescence intensities that were increased by 340 nm of excitation light and decreased by 380 nm of excitation light
Fig. 5
Fig. 5. Measured mechanical characteristics of the fabricated pMUTs.
a Impedance phase angle and magnitude of the fabricated pMUTs at the resonant frequency; b acoustic intensity with different frequencies; c acoustic intensity with different input voltages; d acoustic intensity with different horizontal distances from the center of the transducer; all acoustic intensities were measured by a calibrated hydrophone at a height of 1 mm above the transducer membrane
Fig. 6
Fig. 6. Confocal scanning microscopy Images of neuron-astrocyte cocultured sample at DIV 14.
a neurons stained by the neuron-specific marker Tuj-1; b astrocytes stained by the astrocyte-specific marker, GFAP; c nuclei stained by the nuclei-specific marker Hoechst; d merged image of cocultured neurons and astrocytes
Fig. 7
Fig. 7. Responses of cocultured cells stimulated by the ultrasound from the pMUT array through measurement of the real-time change in the intracellular Ca2+ concentration.
a plot of the transients in the intracellular concentration change of Ca2+ of responding cells by ultrasound at the input voltage of 66 V; magnified view of the plot shows the gradual change of calcium concentration by ultrasound; the different colors represent responses from different cells; b fluorescence image of the intracellular calcium-specific marker Fura-2 AM; c response rate of stimulated cells by ultrasound with different input voltages; d response rate of stimulated cells by ultrasound with different horizontal locations of the Ch. 4 transducer; data are presented as the mean ± SEM. values. Student’s t-test were used to analyze the differences. *p < 0.05, **p < 0.01, ***p < 0.001, ****p < 0.0001, n.s: not significant

References

    1. Bewernick BH, et al. Nucleus accumbens deep brain stimulation decreases ratings of depression and anxiety in treatment-resistant depression. Biol. Psychiat. 2010;67:110–116. doi: 10.1016/j.biopsych.2009.09.013. - DOI - PubMed
    1. Denys D, et al. Deep brain stimulation of the nucleus accumbens for treatment-refractory obsessive-compulsive disorder. Arch. Gen. Psychiat. 2010;67:1061–1068. doi: 10.1001/archgenpsychiatry.2010.122. - DOI - PubMed
    1. Zhou W, et al. Ultrasound neuro-modulation chip: activation of sensory neurons in Caenorhabditis elegans by surface acoustic waves. Lab Chip. 2017;17:1725–1731. doi: 10.1039/C7LC00163K. - DOI - PubMed
    1. Obeso JA, et al. Deep-brain stimulation of the subthalamic nucleus or the pars interna of the globus pallidus in Parkinson’s disease. New Engl. J. Med. 2001;345:956–963. doi: 10.1056/NEJMoa000827. - DOI - PubMed
    1. Ressler KJ, Mayberg HS. Targeting abnormal neural circuits in mood and anxiety disorders: from the laboratory to the clinic. Nat. Neurosci. 2007;10:1116–1124. doi: 10.1038/nn1944. - DOI - PMC - PubMed