. 2019 Oct 16:7:e7875.
doi: 10.7717/peerj.7875. eCollection 2019.

Integumentary structure and composition in an exceptionally well-preserved hadrosaur (Dinosauria: Ornithischia)

Affiliations

Integumentary structure and composition in an exceptionally well-preserved hadrosaur (Dinosauria: Ornithischia)

Mauricio Barbi et al. PeerJ. .

Abstract

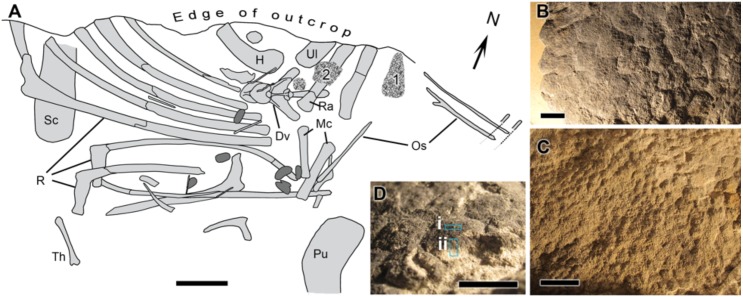
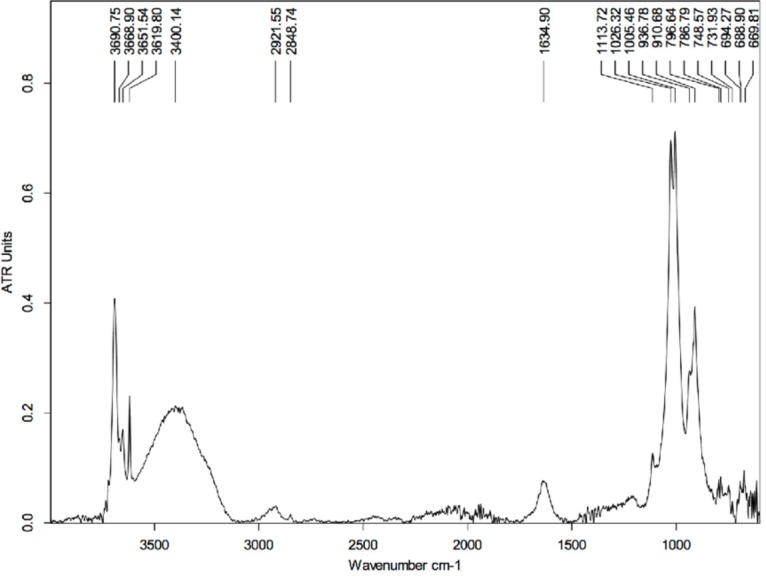
Preserved labile tissues (e.g., skin, muscle) in the fossil record of terrestrial vertebrates are increasingly becoming recognized as an important source of biological and taphonomic information. Here, we combine a variety of synchrotron radiation techniques with scanning electron and optical microscopy to elucidate the structure of 72 million-year-old squamous (scaly) skin from a hadrosaurid dinosaur from the Late Cretaceous of Alberta, Canada. Scanning electron and optical microscopy independently reveal that the three-dimensionally preserved scales are associated with a band of carbon-rich layers up to a total thickness of ∼75 microns, which is topographically and morphologically congruent with the stratum corneum in modern reptiles. Compositionally, this band deviates from that of the surrounding sedimentary matrix; Fourier-transform infrared spectroscopy and soft X-ray spectromicroscopy analyses indicate that carbon appears predominantly as carbonyl in the skin. The regions corresponding to the integumentary layers are distinctively enriched in iron compared to the sedimentary matrix and appear with kaolinite-rich laminae. These hosting carbonyl-rich layers are apparently composed of subcircular bodies resembling preserved cell structures. Each of these structures is encapsulated by calcite/vaterite, with iron predominantly concentrated at its center. The presence of iron, calcite/vaterite and kaolinite may, independently or collectively, have played important roles in the preservation of the layered structures.

Keywords: Cell layer; Fossil; Hadrosaur; Integument; Preservation; Scanning electron microscopy; Skin; Spectromicroscopy; Synchrotron radiation; X-ray.


Conflict of interest statement

James J. Dynes is employed by Canadian Light Source Inc.

Figures

Figure 1
Figure 1. Edmontosaurus cf. regalis (UALVP 53290).
(A) quarry map showing location of preserved integument (indicated by numerals) shown in (B) and (C). Dark grey regions are freshwater bivalves. (B) Higher magnification of 1 showing dark-coloured polygonal scales (type “1” preservation; see text). (C) Detail of 2 showing cluster areas associated with the forearm integument. (D) Detail of dark type “1” scales in oblique view showing sampling locations for spectromicroscopy: samples were collected with a microtome from (i) the outer surface of the epidermal scale to produce a light-coloured powder, and (ii) from a cross section of the scale that penetrated into the pale underlying sedimentary matrix to produce a dark-coloured powder. Scale bar in (A) is 10 cm. Scale bars in (B)–(D) are 1 cm. Abbreviations: Dv, dorsal vertebra; H, humerus; Mc, metacarpal; Os, ossified tendon; Pu, pubis; R, rib; Ra, radius; Sc, scapula; Th, theropod tibia; Ul, ulna. Line drawing by Phil R. Bell.
Figure 2
Figure 2. Comparative histology (transmitted light optical micrographs) of the skin of Edmontosaurus cf. regalis (UALVP 53290) (A, B), Crocodylus porosus (C, D), Rattus rattus (E, F), and Gallus gallus domesticus (G, H).
In UALVP 53290, the dark outer (superficial) layer corresponds to the position of the epidermis (e) in modern analogues (C–F). The thickness of the region identified as epidermis in UALVP 53290 varies (B); however, distinctive layering of this region (arrowheads in B) resembles the stratified appearance and general thickness of the stratum corneum in Crocodylus (D). Boxed area in A encompasses the enlarged area shown in B. (I) Phase-contrast and (J) transmitted light optical micrographs of Edmontosaurus cf. regalis (UALVP 53290) skin revealing fine laminae in the outer stratified region. The outermost epidermal layer in indicated by arrowheads. Dark laminae are, in places, composed of small, lenticular or subcircular bodies (arrows in I). Photos by Josef Buttigieg (A, B), Phil R. Bell (C–H) and Mauricio Barbi (I, J). Abbreviations: b, barite layer; e, epidermis; d, dermis; ds, dark stratified region; g, sedimentary grains; h, hinge area; hs, hair shaft; hy, hypodermis; m, sedimentary matrix; p, pigment cells; s, epidermal scale; sc, stratum corneum; sg, stratum germinativum. Silhouettes created by Pete Buchholz (Edmontosaurus, Buchholz (2019)), Rebecca Groom (Rattus, Groom (2019)), Steven Traver (Crocodilus, Gallus, Traver (2019a) and Traver (2019b)) courtesy of Phylopic and used under the Creative Commons Attribution-ShareAlike 3.0 Unported license (Commons, 2019).
Figure 3
Figure 3. SEM images from a sample of the skin from UALVP 53290 using (A, B) secondary electron (SEI), and (C, D) back-scattered electron detectors.
(A) Cross-section representing the epidermal scale and underlying sedimentary matrix (scale = 500 µm). Sedimentary deposits (e.g., individual detrital grains) are dominant in this image. (B) A magnified image of the boxed area shown in (A) (scale = 50 µm). The white top layer is of sedimentary nature (more details further below) and partially covers the top of several epidermal scales. A thin darker area under this white surface and above another sedimentary region can also be observed. (C) Higher magnification of boxed region in (B) (scale = 25 µm) imaged using BSE. Brighter areas represent higher atomic number (Z) elements. Areas richer in carbon-based (lower Z) structures are expected to show as darker regions, such as the one just under the top white layer in this image. Numbers and cross-hairs indicate specific points where spectral distributions were obtained using SEM-EDS. (D) BSE image showing a discrete darker zone (low Z; indicated with an arrow) close to the top of the sample (scale = 50 µm).
Figure 4
Figure 4. SEM chemical analysis for point 2 in Fig. 3C showing high carbon content typical of the dark (low Z) regions identified by BSE SEM.
Figure 5
Figure 5. SEM elemental maps for Carbon (B), Oxygen (C), Aluminum (D) and Silica (E) of a region containing a carbon-rich area and sediments.
The maps show a clear correlation between the darker area in the map (A) (BSE image) and the carbon distribution in the sample. Boxed area in (A) shows an apparent chain of sub-structures. The scale bar is 5 mµfor all figures.
Figure 6
Figure 6. FTIR spectrum of the HCl-treated skin sample collected using Attenuated Total Reflectance (ATR) in absorption mode.
The peaks at 3,690, 3,651, 3,619, 1,113, 1,026, 1,005, 936, and 910 cm−1 are characteristics of kaolinite.
Figure 7
Figure 7. Region of the darker powder sample mapped using FTIR in transmission mode.
Each cross on the map represents a position used to collect a spectrum.
Figure 8
Figure 8. Select set of spectra extracted from the map in Fig. 7 using FTIR in transmission mode.
A series of peaks identified using the OPUS software peak finder are listed on the top of the figure. A description of potential compounds associated to each of these peaks are provided in the text.
Figure 9
Figure 9. (A–C) Optical images of the hadrosaur skin and sediment debris from the microtome. The white rectangles show the region magnified in each successive image. (D) Transmission image at 280 eV of the boxed region in C, showing the inorganic material. The yellow rectangle shows the area studied in detail using STXM and depicted in Fig. 11. (E) Transmission image at 300 eV of the same area, showing the organic material.
Figure 10
Figure 10. Carbon K-edge XANES reference spectra used in the initial linear regression fitting of the carbon image sequence and the organic carbon spectrum derived from the skin.
(A) Carbon spectrum derived from the skin using PCA-CA. Only one carbon spectrum is evident throughout the skin, consisting of peaks attributed to ketone carbonyl (286.7 eV), carbonyl (288.5 eV), carbonate (290.3 eV) and K (297.2, 299.9 eV). (B) To distinguish the organic carbon from the carbonate and K in the skin, the carbonate (calcite; red spectrum) and K peaks (green) were removed, resulting in a modified carbon in the skin spectrum (pink). To separate the carbonate from the K, the K2CO3 spectrum was modified by subtracting a calcium carbonate (CaCO3) spectrum from it. See text for details.
Figure 11
Figure 11. Carbon component maps of the area shown in Fig. 9E derived from the linear regression fitting of a C K-edge image sequence using reference spectra and the modified carbon (“carbonyl”) spectrum (see Fig. 10B).
(A) Carbonyl, (B) carbonate (CO32), (C) K, (D) K2CO3, and (E) featureless signal (FS). Two fittings were carried out; the first fitting used the modified carbon from skin spectrum, and the carbonate and K spectra. The second fitting used the K2CO3 instead of the K and carbonate spectra. Both fittings used the same slow varying featureless signal. The carbonyl and FS maps were similar for both fittings, thus, only those from the first fitting are shown. Color composites of selected component maps. (F) K, red; carbonyl, green; carbonate, blue; (G) K, red; FS, green; carbonate, blue; (H) K, red; K2CO3, green; CO32, blue.
Figure 12
Figure 12. Calcium component maps derived from the linear regression fitting of a Ca L-edge image sequence using spectra derived from the Ca in the skin and in the inorganic particles (crystal) found associated with the integument.
(A) Ca in skin, (B) Ca in crystals, and (C) featureless signal (FS). (D) Color composites of the component maps (Ca in crystal = red, Ca in skin = green and slow varying featureless signal (FS) = blue). (E) Ca L-edge XANES spectra derived by threshold masking (Dynes et al., 2006b; Dynes et al., 2006a) of the pixels from the inorganic particles and from the skin component maps, (F) The spectra from the yellow box in (E) was enlarged and normalized on the 348 eV peak to better show the differences in peak position between the skin and inorganic spectra.
Figure 13
Figure 13. Iron component maps derived from the linear regression fitting of a Fe L-edge image sequence using reference spectra.
(A) Comparison of Fe(III) and Fe(II) spectra derived by threshold masking of the component maps to the siderite (Fe(II)) and goethite (Fe(III)) reference spectra. Component maps: (B) Fe(III), (C) Fe(II) and (D) slow varying featureless signal (FS). (E) Color composites of the component maps (Fe(III), red; featureless signal, green; Fe(II), blue).
Figure 14
Figure 14. (A) Distribution of carbonyl (red) compared to the distribution of other compounds (cyan) in a 65 × 50 µm area of the sample. This area was measured in 0.1 µm steps. A layer of skin, identified by the yellow rectangle and predominantly composed of carbonyl, can be seen diagonally at the top-left corner of the image. The white arrow points towards the top of the skin. The red box represents the area detailed in (B). (B) Carbonyl (288.5 eV) map of the area within the red rectangle depicted in (A). The map covers an area of 20 × 20 µm of the sample in steps of 0.1 µm. The scale bar is 2 µm. Dark areas correspond to the presence of carbonyl (the data were collected with the detector in X-ray absorption mode). The yellow rectangle highlights a carbonyl layer which seems to be organized in smaller substructures, with three of them delineated by the white circles. (C) Elemental mapping of carbon (red), calcium (blue) and iron (green) of one of the substructures indicated by the white arrow in (B).

References

    1. Bagnara JT, Hadley ME. Chromatophores and color change. Prentice Hall; Englewood Cliffs, New Jersey: 1973.
    1. Barbi M, Tokaryk T, Tolhurst T. Synchrotron radiation as a tool in paleontology. Physics in Canada. 2014;70:8–12.
    1. Barrett PM, Evans DC, Campione NE. Evolution of dinosaur epidermal structures. Biology Letters. 2015;11:20150229. doi: 10.1098/rsbl.2015.0229. - DOI - PMC - PubMed
    1. Bell PR. Standardized terminology and potential taxonomic utility for hadrosaurid skin impressions: a case study for Saurolophus from Canada and Mongolia. PLOS ONE. 2012;7:e31295. doi: 10.1371/journal.pone.0031295. - DOI - PMC - PubMed
    1. Bell PR. A review of hadrosaurid skin impressions. In: Eberth DA, Evans DC, editors. The hadrosaurs: proceedings of the international Hadrosaur symposium; 2014. pp. 572–590.

LinkOut - more resources