. 2019 Oct 16:7:e7893.
doi: 10.7717/peerj.7893. eCollection 2019.

Comparison between two- and three-dimensional scoring of zebrafish response to psychoactive drugs: identifying when three-dimensional analysis is needed

Affiliations

Comparison between two- and three-dimensional scoring of zebrafish response to psychoactive drugs: identifying when three-dimensional analysis is needed

Simone Macrì et al. PeerJ. .

Abstract

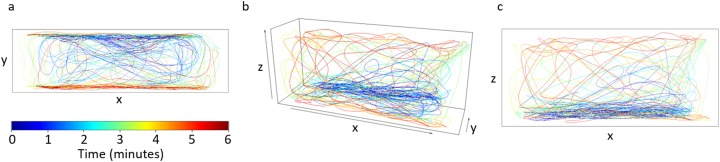
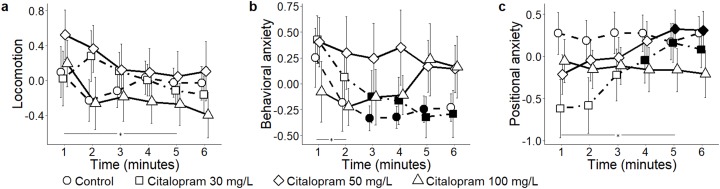
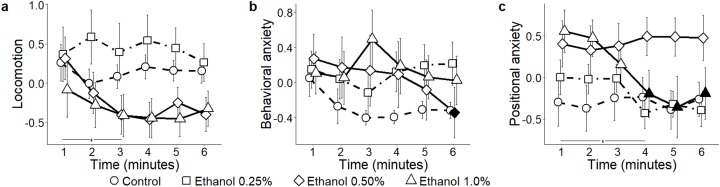
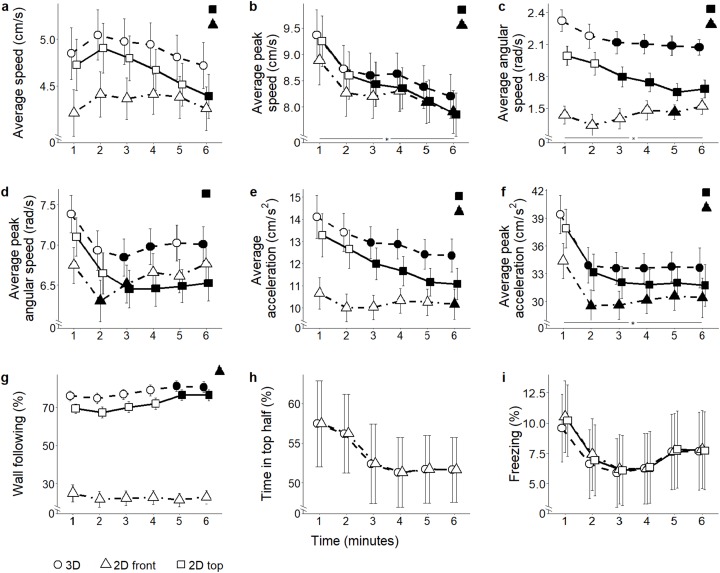
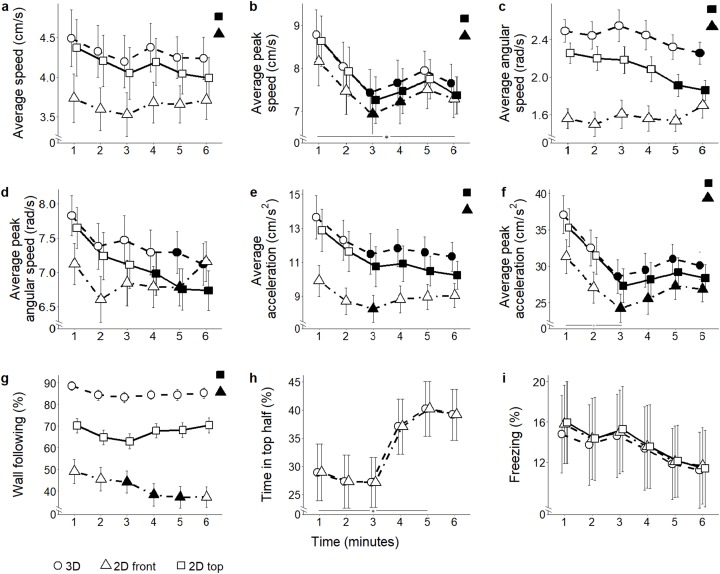
Zebrafish (Danio rerio) have recently emerged as a valuable laboratory species in the field of behavioral pharmacology, where they afford rapid and precise high-throughput drug screening. Although the behavioral repertoire of this species manifests along three-dimensional (3D), most of the efforts in behavioral pharmacology rely on two-dimensional (2D) projections acquired from a single overhead or front camera. We recently showed that, compared to a 3D scoring approach, 2D analyses could lead to inaccurate claims regarding individual and social behavior of drug-free experimental subjects. Here, we examined whether this conclusion extended to the field of behavioral pharmacology by phenotyping adult zebrafish, acutely exposed to citalopram (30, 50, and 100 mg/L) or ethanol (0.25%, 0.50%, and 1.00%), in the novel tank diving test over a 6-min experimental session. We observed that both compounds modulated the time course of general locomotion and anxiety-related profiles, the latter being represented by specific behaviors (erratic movements and freezing) and avoidance of anxiety-eliciting areas of the test tank (top half and distance from the side walls). We observed that 2D projections of 3D trajectories (ground truth data) may introduce a source of unwanted variation in zebrafish behavioral phenotyping. Predictably, both 2D views underestimate absolute levels of general locomotion. Additionally, while data obtained from a camera positioned on top of the experimental tank are similar to those obtained from a 3D reconstruction, 2D front view data yield false negative findings.

Keywords: Anxiety; Automated tracking; Citalopram; Ethanol; Novel tank diving test.


Conflict of interest statement

The authors declare that they have no competing interests.

Figures

Figure 1
Figure 1. Trajectory for a single fish from a control trial.
(A) Top view, (B) 3D reconstructed trajectory obtained from synchronizing trajectories from top and front views, and (C) front view. The color of the trajectory denotes the evolution of the position of the fish along the 6-min trial. The axes dimensions are 29 × 8.5 × 13 cm. Our an in-house developed tracking software (available for download at https://github.com/sach1tb/peregrine) was used in the analysis.
Figure 2
Figure 2. Principal components for the citalopram conditions.
Mean ± standard error for (A) locomotion (B) behavioral anxiety, and (C) positional anxiety, over 6-min trials, showing overall variation, as well as for each concentration of citalopram (control 0, 30, 50, and 100 mg/L) based on the reconstructed trajectories in 3D. Data were analyzed through a repeated measures ANOVA for split-plot designs. Filled symbols denote a significant difference (P < 0.05) from the first minute within each condition. Horizontal bar denotes a significant overall difference in time.
Figure 3
Figure 3. Principal components for the ethanol conditions.
Mean ± standard error for (A) locomotion (B) behavioral anxiety, and (C) positional anxiety, over 6-min trials, showing overall variation, as well as for each concentration of ethanol (control 0%, 0.25%, 0.50%, and 1.0%) based on the reconstructed trajectories in 3D. Data were analyzed through a repeated measures ANOVA for split-plot designs. Filled symbols denote a significant difference (P < 0.05) from the first minute within each condition. Horizontal bar denotes a significant overall difference in time.
Figure 4
Figure 4. Behavioral parameters for the citalopram conditions.
Mean ± standard error for (A) average speed (B) average peak speed (C) average angular speed (D) average peak angular speed (E) average acceleration (F) average peak acceleration (G) proportion of time spent within three cm of walls (H) proportion of time spent in the top half of the tank, and (I) proportion of time spent freezing, over 6-min trials aggregated for all citalopram conditions, computed from 2D front and top views, and 3D reconstructed trajectories. Data were analyzed through a repeated measures ANOVA for split-plot designs. Filled symbols denote a significant difference (P < 0.05) from the first minute within each condition. Horizontal bar denotes a significant overall difference over time. Filled symbols in the top right corner of each panel indicate a significant overall difference with respect to 3D data.
Figure 5
Figure 5. Behavioral parameters for the ethanol conditions.
Mean ± standard error for (A) average speed (B) average peak speed (C) average angular speed (D) average peak angular speed (E) average acceleration (F) average peak acceleration (G) proportion of time spent within three cm of walls (H) proportion of time spent in the top half of the tank, and (I) proportion of time spent freezing, over 6-min trials aggregated for all ethanol conditions, computed from 2D front and top views, and 3D reconstructed trajectories. Data were analyzed through a repeated measures ANOVA for split-plot designs. Filled symbols denote a significant difference (P < 0.05) from the first minute within each condition. Horizontal bar denotes a significant overall difference over time. Filled symbols in the top right corner of each panel indicate a significant overall difference with respect to 3D data.

References

    1. Abaid N, Bartolini T, Macri S, Porfiri M. Zebrafish responds differentially to a robotic fish of varying aspect ratio, tail beat frequency, noise, and color. Behavioural Brain Research. 2012;233(2):545–553. doi: 10.1016/j.bbr.2012.05.047. - DOI - PubMed
    1. Bateson M, Brilot B, Nettle D. Anxiety: an evolutionary approach. Canadian Journal of Psychiatry. 2011;56(12):707–715. doi: 10.1177/070674371105601202. - DOI - PubMed
    1. Bernier NJ, Peter RE. The hypothalamic–pituitary-interrenal axis and the control of food intake in teleost fish. Comparative Biochemistry and Physiology Part B: Biochemistry and Molecular Biology. 2001;129(2–3):639–644. doi: 10.1016/S1096-4959(01)00360-8. - DOI - PubMed
    1. Butail S, Bartolini T, Porfiri M. Collective response of zebrafish shoals to a free-swimming robotic fish. PLOS ONE. 2013;8(10):e76123. doi: 10.1371/journal.pone.0076123. - DOI - PMC - PubMed
    1. Cachat J, Stewart A, Grossman L, Gaikwad S, Kadri F, Chung KM, Wu N, Wong K, Roy S, Suciu C, Goodspeed J, Elegante M, Bartels B, Elkhayat S, Tien D, Tan J, Denmark A, Gilder T, Kyzar E, Dileo J, Frank K, Chang K, Utterback E, Hart P, Kalueff AV. Measuring behavioral and endocrine responses to novelty stress in adult zebrafish. Nature Protocols. 2010;5(11):1786–1799. doi: 10.1038/nprot.2010.140. - DOI - PubMed

LinkOut - more resources