. 2019 Dec 9;130(1):491-506.
doi: 10.1172/JCI129382.

Oral ferroportin inhibitor ameliorates ineffective erythropoiesis in a model of β-thalassemia

Oral ferroportin inhibitor ameliorates ineffective erythropoiesis in a model of β-thalassemia

Vania Manolova et al. J Clin Invest. .

Abstract

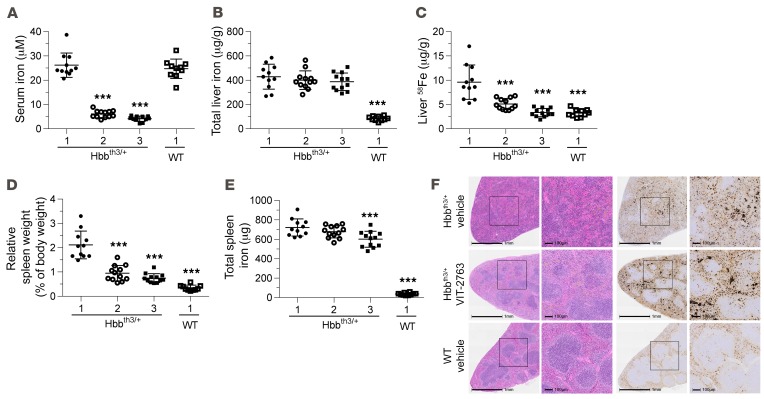
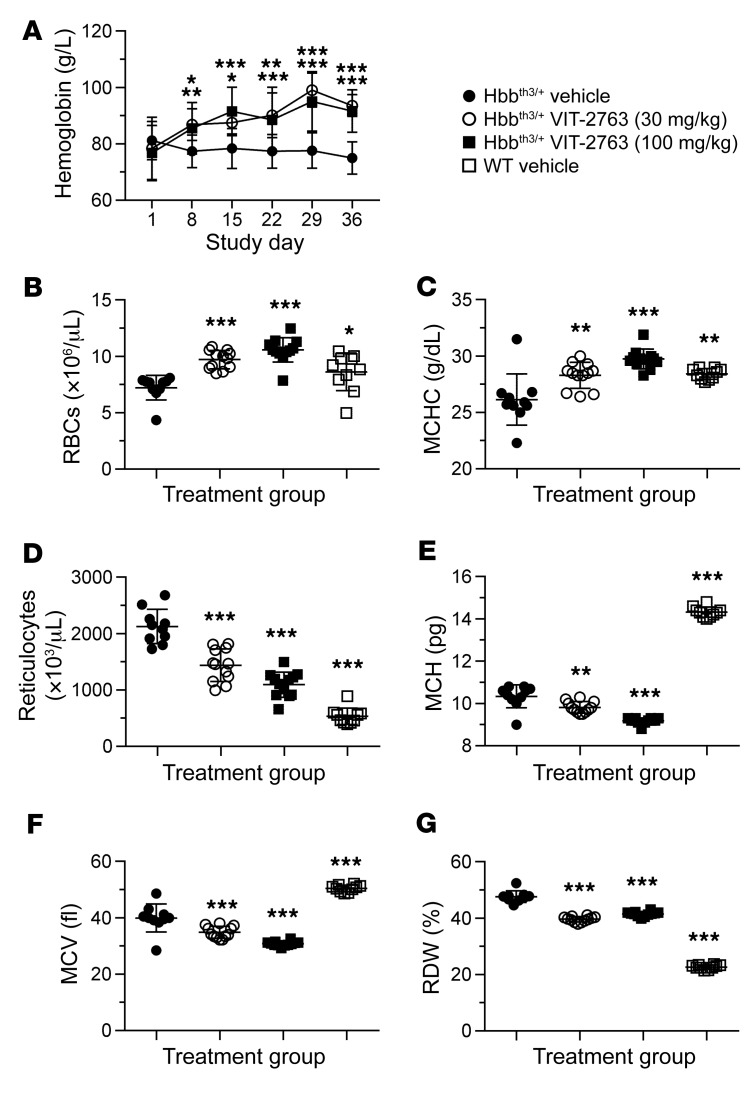
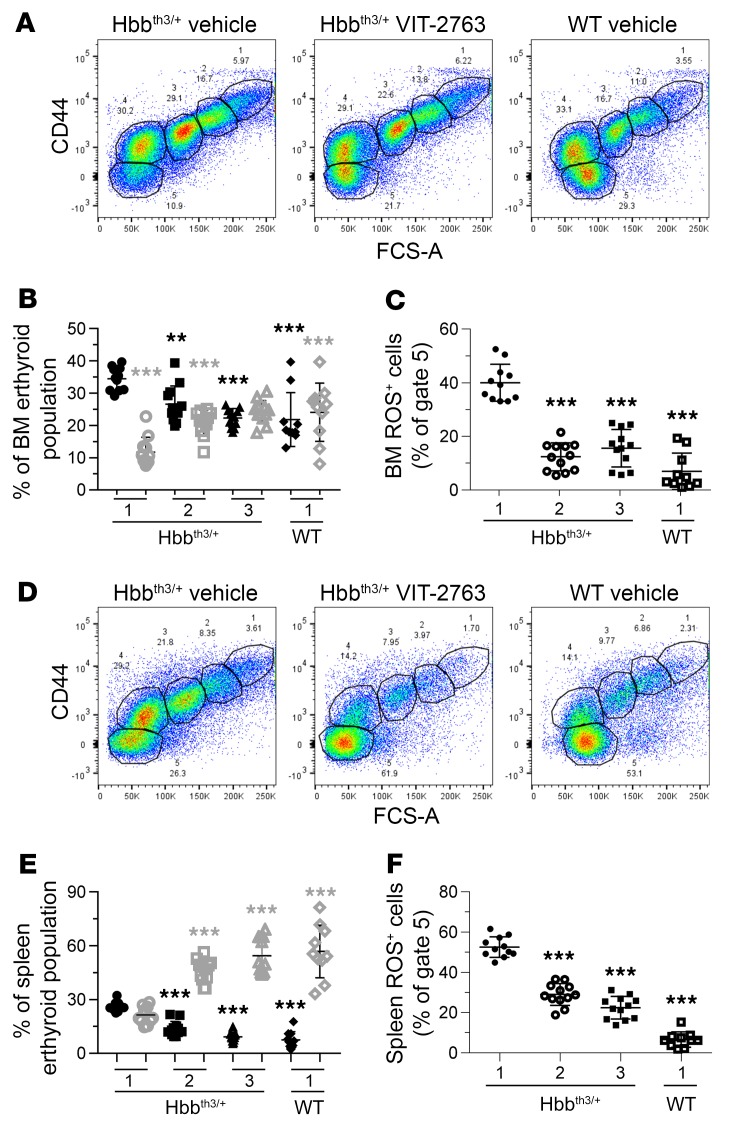
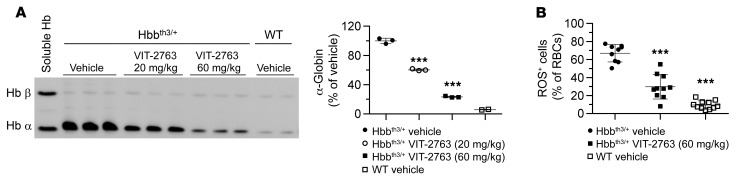
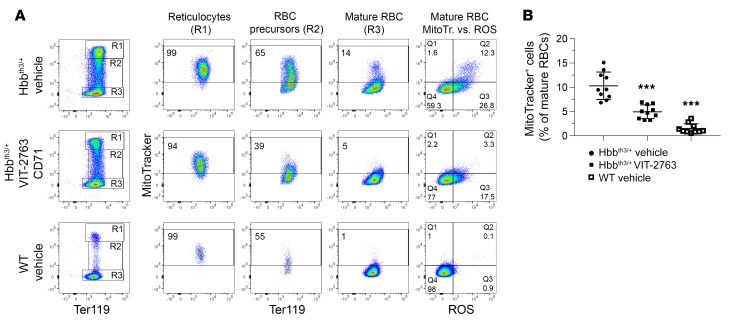
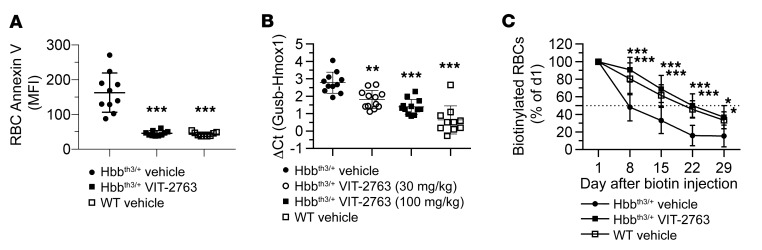
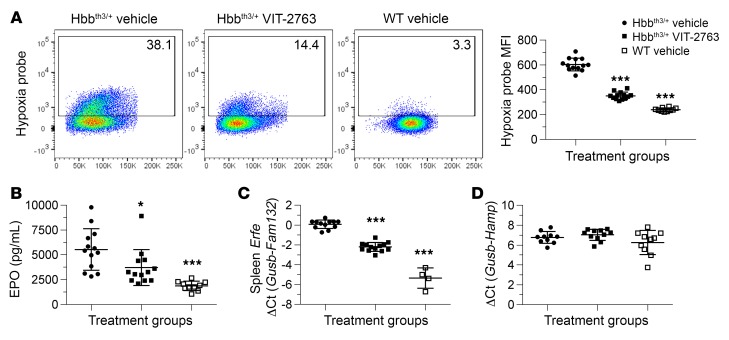
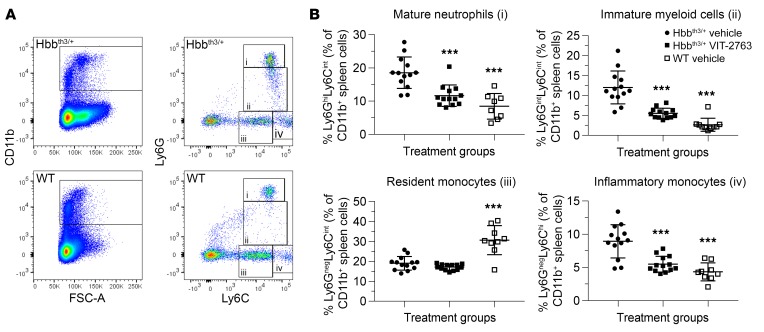
β-Thalassemia is a genetic anemia caused by partial or complete loss of β-globin synthesis, leading to ineffective erythropoiesis and RBCs with a short life span. Currently, there is no efficacious oral medication modifying anemia for patients with β-thalassemia. The inappropriately low levels of the iron regulatory hormone hepcidin enable excessive iron absorption by ferroportin, the unique cellular iron exporter in mammals, leading to organ iron overload and associated morbidities. Correction of unbalanced iron absorption and recycling by induction of hepcidin synthesis or treatment with hepcidin mimetics ameliorates β-thalassemia. However, hepcidin modulation or replacement strategies currently in clinical development all require parenteral drug administration. We identified oral ferroportin inhibitors by screening a library of small molecular weight compounds for modulators of ferroportin internalization. Restricting iron availability by VIT-2763, the first clinical stage oral ferroportin inhibitor, ameliorated anemia and the dysregulated iron homeostasis in the Hbbth3/+ mouse model of β-thalassemia intermedia. VIT-2763 not only improved erythropoiesis but also corrected the proportions of myeloid precursors in spleens of Hbbth3/+ mice. VIT-2763 is currently being developed as an oral drug targeting ferroportin for the treatment of β-thalassemia.

Keywords: Drug therapy; Hematology.


Conflict of interest statement

Conflict of interest: All authors are employees of Vifor (International) Ltd. and might own equities. VM and FD are inventors in patents related to the publication (WO2017/068089 and WO2017/068090).

Figures

Figure 1
Figure 1. Identification of ferroportin inhibitors.
(A) Screening and profiling cascade used to identify ferroportin inhibitors. (B) Chemical structure of the ferroportin inhibitor VIT-2763.
Figure 2
Figure 2. VIT-2763 competes with hepcidin for ferroportin binding.
(A) VIT-2763 prevented the internalization of TMR-hepcidin in J774 cells. Representative fluorescence microscopy pictures from more than 10 independent experiments are shown with J774 cells at high (2 μM) and low concentrations (0.0001 μM) of VIT-2763 or hepcidin before adding TMR-hepcidin (red). Nuclei are shown in blue. Scale bar: 25 μm. (B) Dose-response curves of VIT-2763 and unlabeled hepcidin in J774 TMR-hepcidin internalization assay. n = 3 per concentration. (C) Dose-response curves of VIT-2763 and unlabeled hepcidin in fluorescence polarization assay. n = 3 per concentration. (D) Dose-response curves in iron efflux assay in T47D cells. Shown are dose-response curves of VIT-2763 or hepcidin alone and both in a combination with equimolar concentrations. n = 3 or 4 per concentration. (E and F) Dose-response curves of VIT-2763 (E) and hepcidin (F) in HEK-FPN1-GFP ferritin-BLA reporter assay with or without doxycycline induction of ferroportin. n = 4 per concentration. Data are presented as mean + SD for each concentration.
Figure 3
Figure 3. VIT-2763 and hepcidin induce ferroportin internalization and ubiquitination.
(A) Representative images from fluorescence microscopy kinetic analysis of ferroportin internalization and degradation in MDCK cells constitutively expressing human ferroportin with a fluorescent HaloTag (green). Nuclei are depicted in red. Cells were incubated with either VIT-2763 (20 μM) or hepcidin (1 μM) for the indicated times. Scale bar: 25 μm. The full kinetic study shown in the figure was performed once. The experiment was repeated at individual time points: once at 6 hours, 3 times at 20 minutes and 1 hour, and more than 10 times at 3 hours and 18 hours with reproducible results. (B) Quantification of the ferroportin-associated membrane fluorescence in MDCK cells treated with serial dilutions of either hepcidin or VIT-2763 for 18 hours. n = 3 per concentration. Data are shown as mean ± SD for each concentration. (C) Kinetics of internalization of ferroportin, as depicted by decrease of membrane-associated ferroportin fluorescence in MDCK cells treated with either hepcidin (1 μM) or VIT-2763 (20 μM). n = 2 (1–6 hours); n = 3 (18 hours). Mean for each time point is shown. Data in B and C are presented as mean of the percentage of ferroportin membrane fluorescence relative to untreated cells. (D) Immunoprecipitation of J774 lysates for ubiquitination and degradation studies of ferroportin. J774 cells were treated with hepcidin (150 nM) or VIT-2763 (100 nM) for 10, 20, 40, 60, or 120 minutes before harvesting and IP with MTP1 anti-ferroportin antibody. Immunoprecipitates were blotted and stained with either ubiquitin-specific (upper blot) or ferroportin-specific (lower blot) antibody (F308). The full kinetic study shown in the figure was performed once. The experiment at time points 10 and 120 minutes was performed 5 times with reproducible results.
Figure 4
Figure 4. Rapid absorption of orally dosed VIT-2763 and decrease in serum iron induced by hepcidin and VIT-2763 in rodents.
(A) Oral PK/PD of VIT-2763 at a single dose of 30 mg/kg in rats. n = 3. Data are shown as mean ± SD. (B and C) Serum iron levels in C57BL/6 mice treated with either hepcidin (5 mg/kg) (n = 5) (B) or VIT-2763 (60 mg/kg) (n = 10) (C) for 1 hour, 3 hours, 6 hours, and 16 hours. Data are shown as individual values and mean ± SD. In B and C, statistical analysis was performed by comparing all treatment groups to the Hbbth3/+ vehicle group using 1-way ANOVA with Dunnett’s multiple comparison test. **P < 0.01; ***P < 0.001.
Figure 5
Figure 5. VIT-2763 decreased serum iron and prevented liver iron loading in Hbbth3/+ mice.
(A) VIT-2763 significantly decreased serum iron levels in Hbbth3/+ mice 3 hours after oral dosing at study day 36. (B) Total liver iron concentration remained unchanged following 36 days of treatment with VIT-2763. (C) VIT-2763 prevented liver 58Fe loading in Hbbth3/+ mice. (D) VIT-2763 reduced the relative spleen weight of Hbbth3/+ mice. (E) Effect of VIT-2763 on total spleen iron content. (AE) x axis labels: 1, vehicle; 2, VIT-2763 (30 mg/kg); 3, VIT-2763 (100 mg/kg). Individual values and mean ± SD are shown. Statistical analysis was performed by comparing all treatment groups to the Hbbth3/+ vehicle group using 1-way ANOVA with Dunnett’s multiple comparison test. n = 10–12. (F) Representative photographs from H&E (left) and DAB-enhanced Perls staining (right) in spleen sections from vehicle-treated (top) or VIT-2763-treated (100 mg/kg, middle) Hbbth3/+ mice and vehicle-treated WT mice (bottom). Shown are representative photographs from 10 to 12 mice per group and 3 sections from each spleen. Scale bars: 1 mm in originals, 100 μm in enlargements. ***P < 0.001.
Figure 6
Figure 6. VIT-2763 significantly corrected anemia and improved RBC parameters in Hbbth3/+ mice.
(A) VIT-2763 significantly increased Hb concentration starting at day 8 of dosing in Hbbth3/+ mice. Mean ± SD values of Hb concentrations are shown. Statistical analysis was performed using repeated measures 2-way ANOVA with Dunnett’s multiple comparison test to compare all treatment groups to the Hbbth3/+ vehicle group over time. n = 10–12 mice. At the study end, VIT-2763 increased RBC counts (B) and MCHC (C) and decreased reticulocyte counts (D), MCH (E), MCV (F), and RDW (G) in Hbbth3/+ mice. For BF, individual values and mean ± SD are shown. Statistical analysis was performed by comparing all treatment groups to the Hbbth3/+ vehicle group using 1-way ANOVA with Dunnett’s multiple comparison test. n = 10–12 mice. *P < 0.05; **P < 0.01; ***P < 0.001.
Figure 7
Figure 7. VIT-2763 treatment improved the ineffective erythropoiesis in BM and spleen of Hbbth3/+ mice.
Gating strategy used to identify erythroid progenitors in BM (A) or spleen (D) by flow cytometry. Representative dot plots from 1 out of 4 independent experiments showing vehicle- or VIT-2763-treated Hbbth3/+ and WT mice. VIT-2763 decreased the frequency of polychromatic erythroblasts (population in gate 3) in BM (B) and spleen (E). VIT-2763 treatment reduced the percentages of BM (C) and spleen (F) ROS-positive mature erythrocytes. (B and E) Black symbols show polychromatic erythroblasts, and gray symbols show mature erythrocytes. (B, C, E and F) x axis labels: 1, vehicle; 2, VIT-2763 (30 mg/kg); 3, VIT-2763 (100 mg/kg). Individual values and mean ± SD are shown. Statistical analysis was performed by comparing all treatment groups to the Hbbth3/+ vehicle group using 1-way ANOVA with Dunnett’s multiple comparison test. n = 10–12 mice. **P < 0.01; ***P < 0.001.
Figure 8
Figure 8. VIT-2763 reduced the formation of insoluble α-globin aggregates in RBCs of Hbbth3/+ mice.
(A) TAU gel electrophoresis of membrane-bound globins in RBCs from Hbbth3/+ and WT mice. n = 4–6. Each band is a pool of samples from 2 mice. Soluble α and β Hb from WT RBCs are shown as a reference. Quantification of the signal intensity of the TAU gel α-globin bands by densitometry is shown next to the TAU gel picture. Similar effect of VIT-2763 on α-globin was documented in 4 independent experiments. (B) VIT-2763 (60 mg/kg bid for 28 days) reduced the proportion of ROS+ Ter119+ RBCs of Hbbth3/+ mice. Individual values and mean ± SD are shown. Statistical analysis was performed by comparing all treatment groups to the Hbbth3/+ vehicle group using 1-way ANOVA with Dunnett’s multiple comparison test. n = 9–11. ***P < 0.001.
Figure 9
Figure 9. VIT-2763 improved the elimination of mitochondria in RBCs of Hbbth3/+ mice.
(A and B) Mitochondria are retained in mature RBCs of Hbbth3/+ mice and cleared in mature RBCs of Hbbth3/+ mice treated with VIT-2763. (A) Flow cytometry analysis showing representative dot plots from 1 out of 3 independent experiments. RBCs were gated as mature RBCs (Ter119hiCD71neg), RBC precursors (Ter119hiCD71int), and reticulocytes (Ter119hiCD71hi) and analyzed for mitochondrial labeling by MitoTracker Deep Red staining and ROS by CM-H2DCFDA staining. (B) Quantification of the percentage of RBCs with mitochondria. Individual values and mean ± SD are shown. Statistical analysis was performed by comparing all treatment groups to the Hbbth3/+ vehicle group using 1-way ANOVA with Dunnett’s multiple comparison test. n = 10 mice. ***P < 0.001.
Figure 10
Figure 10. VIT-2763 decreased apoptosis and extended the life span of RBCs in Hbbth3/+ mice.
(A) VIT-2763 lowered PS exposure on peripheral RBCs, as detected by decrease in intensity of annexin V staining. n = 9–10. (B) VIT-2763 reduced the expression of liver Hmox1, as detected by qPCR. n = 10–12. (A and B) Individual values and mean ± SD are shown. Statistical analysis was performed by comparing all treatment groups to the Hbbth3/+ vehicle group using 1-way ANOVA with Dunnett’s multiple comparison test. (C) VIT-2763 (60 mg/kg for 7 weeks) extended the life span of RBCs in Hbbth3/+ mice. Biotin labeling was performed after 21 days of dosing with VIT-2763. Shown is the percentage of biotinylated Ter119+ cells normalized to the percentage of labeled cells at day 1 after biotin injection. n = 4–10. Mean ± SD values are shown. Statistical analysis was performed using repeated measures 2-way ANOVA with Dunnett’s multiple comparison test to compare all treatment groups to the Hbbth3/+ vehicle group over time. *P < 0.05; **P < 0.01; ***P < 0.001.
Figure 11
Figure 11. VIT-2763 reduced hypoxia response in RBCs, excessive serum EPO, and Erfe expression in spleens of Hbbth3/+ mice without effect on liver Hamp.
(A) Percentage of hypoxic RBCs (left, dot plots) and MFI of the hypoxia probe (right, Hypoxia probe+ RBCs) in peripheral blood of Hbbth3/+ mice or WT mice, as detected by flow cytometry analysis. n = 10–13 mice per group. Representative dot plots showing 1 out of 2 independent experiments. (B) Serum EPO was measured by ELISA. n = 10–13. (C) Spleen Erfe (Fam132) (n = 4–13 mice per group) and liver Hamp (D) gene expression were measured by qPCR (n = 10-11 mice). (AD) Individual values and mean ± SD are shown. Statistical analysis was performed by comparing all treatment groups to the Hbbth3/+ vehicle group using 1-way ANOVA with Dunnett’s multiple comparison test. *P < 0.05; ***P < 0.001.
Figure 12
Figure 12. Effects of VIT-2763 on myeloid precursors in spleens of Hbbth3/+ mice.
(A) Gating strategy used to identify myeloid cell populations from the spleen of WT and Hbbth3/+ mice: (i) mature neutrophils (Ly6GhiLy6Cint),(ii) immature myeloid cells (Ly6GintLy6Cint), (iii) resident monocytes (Ly6GnegLy6Cint), and (iv) inflammatory monocytes (Ly6GnegLy6Chi). Representative dot plots from 1 out of 3 independent experiments are shown. (B) Quantification of percentages of mature neutrophils, immature myeloid cells, resident monocytes, and inflammatory monocytes in CD11b+ spleen cells. Individual values and mean ± SD are shown. n = 8–13 mice per group. Statistical analysis was performed by comparing all treatment groups to the Hbbth3/+ vehicle group using 1-way ANOVA with Dunnett’s multiple comparison test. ***P < 0.001.

References

    1. Rivella S. Iron metabolism under conditions of ineffective erythropoiesis in β-thalassemia. Blood. 2019;133(1):51–58. doi: 10.1182/blood-2018-07-815928. - DOI - PMC - PubMed
    1. Taher AT, Weatherall DJ, Cappellini MD. Thalassaemia. Lancet. 2018;391(10116):155–167. doi: 10.1016/S0140-6736(17)31822-6. - DOI - PubMed
    1. Mettananda S, Gibbons RJ, Higgs DR. α-Globin as a molecular target in the treatment of β-thalassemia. Blood. 2015;125(24):3694–3701. doi: 10.1182/blood-2015-03-633594. - DOI - PMC - PubMed
    1. Rivella S. β-thalassemias: paradigmatic diseases for scientific discoveries and development of innovative therapies. Haematologica. 2015;100(4):418–430. doi: 10.3324/haematol.2014.114827. - DOI - PMC - PubMed
    1. Rivella S. The role of ineffective erythropoiesis in non-transfusion-dependent thalassemia. Blood Rev. 2012;26(Suppl 1):S12–S15. - PMC - PubMed

Publication types

MeSH terms