. 2019 Dec 2;129(12):5137-5150.
doi: 10.1172/JCI128428.

Fracture repair requires TrkA signaling by skeletal sensory nerves

Affiliations

Fracture repair requires TrkA signaling by skeletal sensory nerves

Zhu Li et al. J Clin Invest. .

Abstract

Bone is richly innervated by nerve growth factor-responsive (NGF-responsive) tropomyosin receptor kinase A-expressing (TrKa-expressing) sensory nerve fibers, which are required for osteochondral progenitor expansion during mammalian skeletal development. Aside from pain sensation, little is known regarding the role of sensory innervation in bone repair. Here, we characterized the reinnervation of tissue following experimental ulnar stress fracture and assessed the impact of loss of TrkA signaling in this process. Sequential histological data obtained in reporter mice subjected to fracture demonstrated a marked upregulation of NGF expression in periosteal stromal progenitors and fracture-associated macrophages. Sprouting and arborization of CGRP+TrkA+ sensory nerve fibers within the reactive periosteum in NGF-enriched cellular domains were evident at time points preceding periosteal vascularization, ossification, and mineralization. Temporal inhibition of TrkA catalytic activity by administration of 1NMPP1 to TrkAF592A mice significantly reduced the numbers of sensory fibers, blunted revascularization, and delayed ossification of the fracture callus. We observed similar deficiencies in nerve regrowth and fracture healing in a mouse model of peripheral neuropathy induced by paclitaxel treatment. Together, our studies demonstrate an essential role of TrkA signaling for stress fracture repair and implicate skeletal sensory nerves as an important upstream mediator of this repair process.

Keywords: Bone Biology; Bone disease.


Conflict of interest statement

Conflict of interest: The James laboratory receives research support from Musculoskeletal Transplant Foundation (MTF) Biologics.

Figures

Figure 1
Figure 1. Fatigue end-loading induces ulnar stress fracture.
(A) μCT 3D reconstruction of a mouse forelimb showing a mid-diaphyseal healing fracture of the ulna (a representative image from day 7 is shown). Scale bar: 500 μm. (B) μCT 3D reconstructions, (C) coronal cross-sectional images, and (D) axial cross-sectional images at serial time points after stress fracture from days 1–56. Arrowheads indicate fracture sites. The uninjured forelimb is shown for comparison. Black scale bar: 500 μm; white scale bars: 1 mm. (EG) Quantitative analysis of μCT imaging on days 1–56 after stress fracture. (E) BV of callus; (F) BV/TV of callus; and (G) BMD of callus. Dashed line indicates the mean BMD of uninjured ulnar cortical bone at the mid-diaphysis. For all graphs, each dot represents a single sample, with each sample number indicated below. Data are expressed as the mean ± SD. ††P < 0.01 versus the day-7 time point (E and F) or versus the uninjured control (G), by 1-way ANOVA with post hoc Newman-Keuls test. u, ulna; r, radius.
Figure 2
Figure 2. NGF reporter activity after stress fracture.
(AU) Representative tile scans (left), high-magnification images (middle), and representative H&E-stained images (right) of the ulnar fracture site and associated callus in NGF-eGFP reporter animals at serial time points between days 1 and 56 after stress fracture. Reporter activity is shown in green, and nuclear counterstaining is shown in blue. An uninjured control is shown for comparison. The thin dashed white line indicates the uppermost boundary of the periosteum or fracture callus. The thicker dashed white line represents the boundary between the periosteum or fracture callus and the underlying cortical bone. Red arrowheads indicate the fracture site. (V) Semiquantitation of NGF-eGFP reporter activity after fracture on days 1–56 in comparison with the uninjured control. Each dot in the graphs represents a single sample, with the sample numbers indicated below. White scale bars: 50 μm; black scale bars: 20 μm. Data are expressed as the mean ± SD. P < 0.05 and ††P < 0.01 versus the uninjured control; ##P < 0.01 versus the day-3 time point, by 1-way ANOVA with post hoc Newman-Keuls test.
Figure 3
Figure 3. Cellular sources of NGF after stress fracture.
(AG) IHC was performed on a NGF-eGFP fracture callus on day 3 after injury, including staining for (A) vimentin (Vim), (B) PDGFRα, (C) PDGFRß, (D) CD45, (E) F4/80, (F) Ly-6G, and (G) CD117. Immunohistochemical staining is shown in red or yellow, and NGF reporter activity is shown in green. Nuclear counterstaining is shown in blue. (H) Semiquantitative analysis of eGFP coexpression with immunofluorescence staining of NGF-eGFP reporter sections on day 3 after fracture. (IN) Immunohistochemical analysis of a NGF-eGFP fracture callus on day 14, including staining for (I) osteocalcin (OCN), (J) TRAP, (K) CD45, (L) CD31, (M) PDGFRß, and (N) a negative control without a primary antibody. Immunohistochemical staining is shown in red, NGF reporter activity is shown in green, and nuclear counterstaining is shown in blue. (O) Semiquantitative analysis of eGFP coexpression with immunofluorescence staining of NGF-eGFP reporter tissue sections on day 14 after fracture. In the graphs, each dot represents a single analyzed image. Data are expressed as the mean ± SD. White scale bar: 50 μm; blue scale bars (insets): 5 μm.
Figure 4
Figure 4. TrkA+CGRP+ sensory nerve sprouting after stress fracture.
(A and B) TUBB3 whole-mount immunohistochemical staining of the ulnar periosteum before and 6 hours after stress fracture. White dashed lines indicate the fracture site. (CI) Tile scans and high-magnification images of ulnar fracture calluses in Thy1-YFP reporter animals, with reporter activity shown in green using Imaris surface renderings. (C) Uninjured control. (DI) Fracture callus on days 3, 7, 14, 28, and 56 after injury. The thin dashed white line represents the uppermost boundary of the periosteum or fracture callus. The thick dashed white line represents the boundary between the periosteum or fracture callus and the underlying cortical bone. White arrowheads indicate the fracture site. (J) Quantification of Thy1-YFP reporter activity from days 1–56 after fracture, indicated as a volumetric measure of YFP reporter activity. (K and L) Representative images of CGRP and TH immunohistochemical detection (yellow) in uninjured periosteum from Thy1-YFP reporter (green) animals. (M and N) CGRP immunohistochemical detection (yellow) and (O) quantification on days 3 and 14 after fracture. (P and Q) TH immunohistochemical detection (yellow) and (R) quantification ons day 3 and 14 after fracture. In the graphs, each dot represents a single sample, with the sample numbers indicated below. Scale bars: 50 μm and 20 μm (insets). Data are expressed as the mean ± SD. ††P < 0.01 versus the uninjured control; ##P < 0.01 versus the day-1 time point, by 1-way ANOVA with post hoc Newman-Keuls test.
Figure 5
Figure 5. Neurovascular changes after stress fracture.
(AG) Representative CD31 immunohistochemical staining and quantification after fracture, performed on Thy1-YFP reporter fracture sites. Imaris surface renderings of CD31 immunohistochemical staining (red) and Thy1-YFP reporter activity (green), with nuclear counterstaining shown in blue. Tile scans of longitudinal cross sections of the fracture callus are shown along with high-magnification images. (A) Uninjured control. (BG) Fracture callus on days 3, 7, 14, 28, and 56 after injury. The thin dashed white line indicates the uppermost boundary of the periosteum or fracture callus. The thick dashed white line represents the boundary between the periosteum or fracture callus and the underlying cortical bone. White arrowheads indicate the fracture site. (H) Quantification of CD31 immunohistochemical staining at serial time points from days 1–56 after fracture, reported as a volumetric measure of CD31 immunohistochemical staining. (I) Schematic model of the temporal sequence of events after ulnar stress fracture. The number of days after fracture is depicted on the x axis, and the relative activity of each cellular process is shown on the y axis. In the graphs, each dot represents a single sample, with the number of samples indicated below. Scale bars: 50 μm (including insets). Data are expressed as the mean ± SD. P < 0.05 and ††P < 0.01 versus the uninjured control; ##P < 0.01 versus the day-7 time point, by 1-way ANOVA with post hoc Newman-Keuls test.
Figure 6
Figure 6. Inhibition of TrkA catalytic activity and its effects on stress fracture healing.
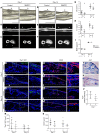
(AF) μCT images of ulnar stress fracture healing in TrkAF592A Thy1-YFP mice treated with 1NMPP1 or vehicle control on (AC) day 7 and (DF) day 14 after injury. (A) μCT reconstructions, (B) coronal cross-sectional images, and (C) axial cross-sectional images. (GI) Quantitative μCT analysis of stress fractures in TrkAF592A Thy1-YFP mice on days 7 and 14 after injury. (G) BV, (H) TV, and (I) BMD of callus. (JM) Thy1-YFP reporter activity in TrkAF592A Thy1-YFP mice treated with (J and L) vehicle control or (K and M) 1NMPP1, as seen on day 7 after injury. Tile scans and high-magnification images are shown. The thin dashed white line indicates the uppermost boundary of the fracture callus. The thick dashed white line represents the boundary between the fracture callus and the underlying cortex. White arrowheads indicate the fracture site. (N) Quantification of Thy1-YFP reporter activity on days 7 and 14 after injury. (OR) CD31 immunohistochemical staining of tissue from TrkAF592A Thy1-YFP mice treated with (O and Q) vehicle control or (P and R) 1NMPP1, on day 7 after injury. Tile scans and high-magnification images are shown. (S) Quantification of CD31 immunohistochemical staining, 7 and 14 days after injury. (T and U) High-magnification images of ALP staining of tissue from TrkAF592A Thy1-YFP mice treated with (T) vehicle control or (U) 1NMPP1, on day 7 after injury. (V) Quantification of ALP staining intensity, on day 7 after injury. For all graphs, each dot represents a single sample, with sample numbers indicated below. Scale bars: 500 μm (A and D), 1 mm (B, C, E, and F), 50 μm (JR), 25 μm (enlarged insets in AR, T and U). Data are expressed as the mean ± SD. P < 0.05 versus the vehicle control at the corresponding time point, by 2-tailed Student’s t test.
Figure 7
Figure 7. Chemotherapy-induced peripheral neuropathy phenocopies TrkA inhibition during stress fracture.
(AC) Periosteal nerve fiber loss in animals treated with PTX within the uninjured ulnar periosteum. (A and B) Representative images of TUBB3 immunohistochemical staining (green) and (C) quantification of TUBB3+ nerve fiber frequency. (DI) μCT images of ulnar stress fracture healing in control- or PTX-treated mice on day 7 after injury. (D and G) μCT reconstructions of the fracture site, (E and H) coronal cross-sectional images, and (F and I) axial cross-sectional images on days 7 and 14 after injury. (J and K) Quantitative μCT analysis of control- or PTX-treated mice on days 7 and 14 after injury. (J) BV of callus and (K) BMD of callus. (L and M) Immunohistochemical staining for TUBB3+ nerve fibers among (L) control- or (M) PTX-treated mice on day 7 after injury. Tile scans and high-magnification images are shown. The thin dashed white line indicates the uppermost boundary of the fracture callus, and the thick dashed white line indicates the boundary between the fracture callus and the underlying cortex. White arrowheads indicate the fracture site. (N) Quantification of TUBB3 immunohistochemical staining on days 7 and 14 after injury. (O and P) CD31 immunohistochemical staining of tissue from (O) control- or (P) PTX-treated animals on day 7 after injury. Tile scans and high-magnification images are shown. (Q) Quantification of CD31 immunohistochemical staining of tissue from control- or PTX-treated mice on days 7 and 14 after injury. Each dot represents a single sample, with sample numbers indicated below. Scale bars: 50 μm (A, B, L, M, O, and P and insets in L, M, O, and P), 1 mm (E, F, H, and I), and 500 μm (D and G). Data are expressed as the mean ± SD. P < 0.05 versus control, by 2-tailed Student’s t test.

References

    1. Bjurholm A, Kreicbergs A, Brodin E, Schultzberg M. Substance P- and CGRP-immunoreactive nerves in bone. Peptides. 1988;9(1):165–171. doi: 10.1016/0196-9781(88)90023-X. - DOI - PubMed
    1. Castañeda-Corral G, et al. The majority of myelinated and unmyelinated sensory nerve fibers that innervate bone express the tropomyosin receptor kinase A. Neuroscience. 2011;178:196–207. doi: 10.1016/j.neuroscience.2011.01.039. - DOI - PMC - PubMed
    1. Pezet S, McMahon SB. Neurotrophins: mediators and modulators of pain. Annu Rev Neurosci. 2006;29:507–538. doi: 10.1146/annurev.neuro.29.051605.112929. - DOI - PubMed
    1. Mantyh PW. The neurobiology of skeletal pain. Eur J Neurosci. 2014;39(3):508–519. doi: 10.1111/ejn.12462. - DOI - PMC - PubMed
    1. Kumar A, Brockes JP. Nerve dependence in tissue, organ, and appendage regeneration. Trends Neurosci. 2012;35(11):691–699. doi: 10.1016/j.tins.2012.08.003. - DOI - PubMed

Publication types