. 2019 Oct 21;19(1):434.
doi: 10.1186/s12870-019-2059-5.

The interplay between miR156/SPL13 and DFR/WD40-1 regulate drought tolerance in alfalfa

Affiliations

The interplay between miR156/SPL13 and DFR/WD40-1 regulate drought tolerance in alfalfa

Biruk A Feyissa et al. BMC Plant Biol. .

Abstract

Background: Developing Medicago sativa L. (alfalfa) cultivars tolerant to drought is critical for the crop's sustainable production. miR156 regulates various plant biological functions by silencing SQUAMOSA-PROMOTER BINDING PROTEIN-LIKE (SPL) transcription factors.

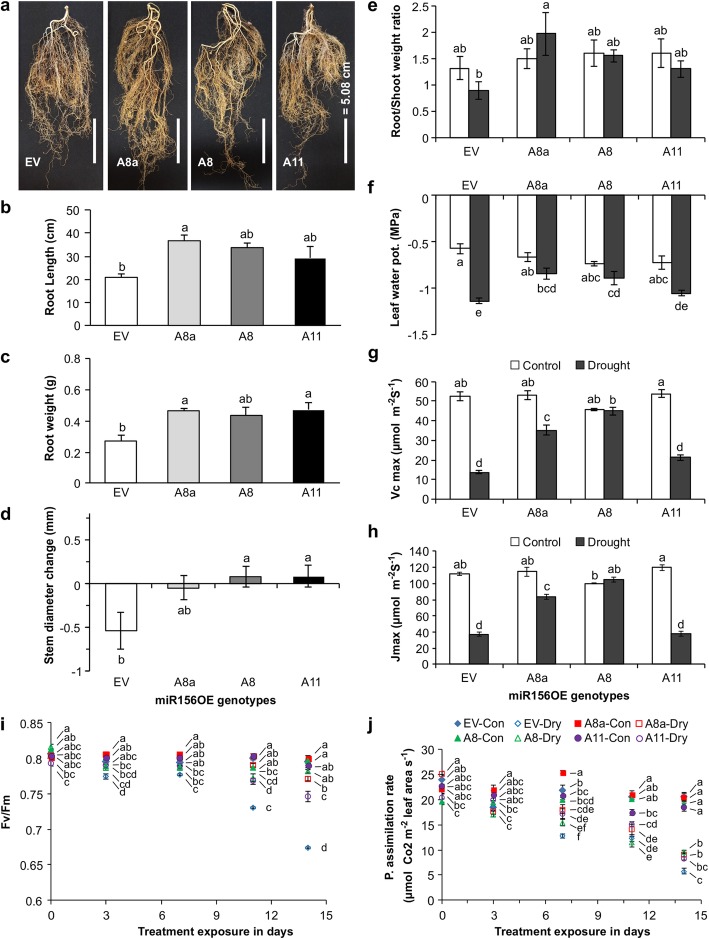
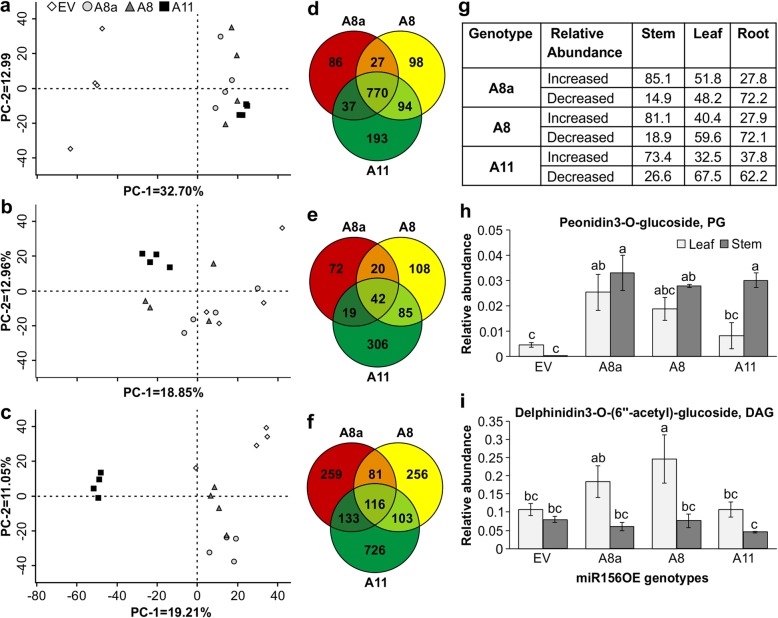
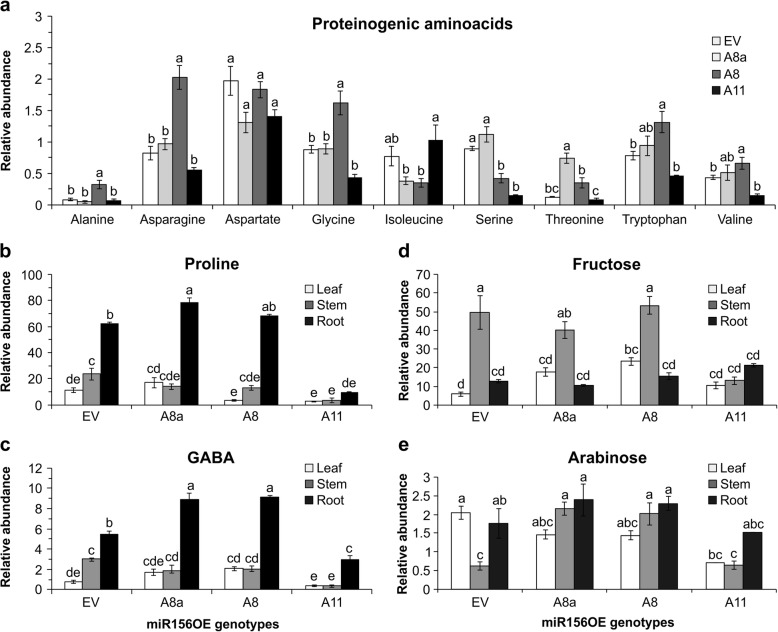
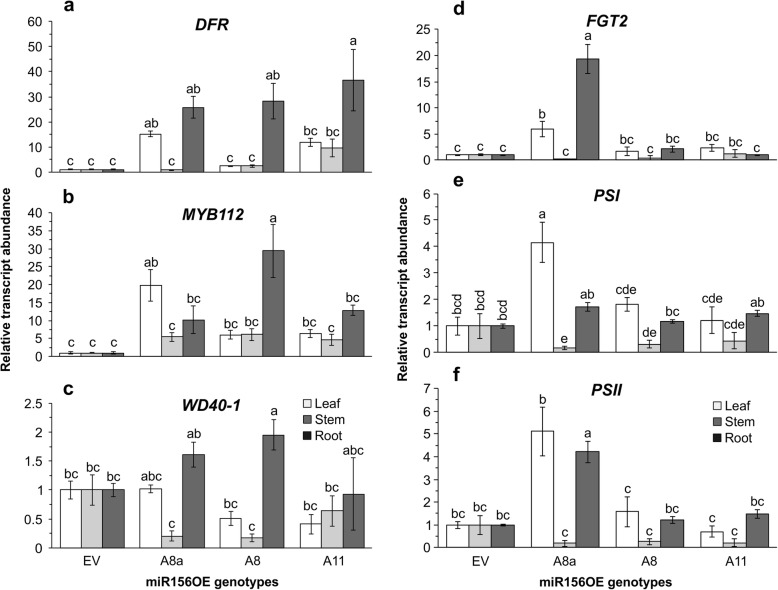
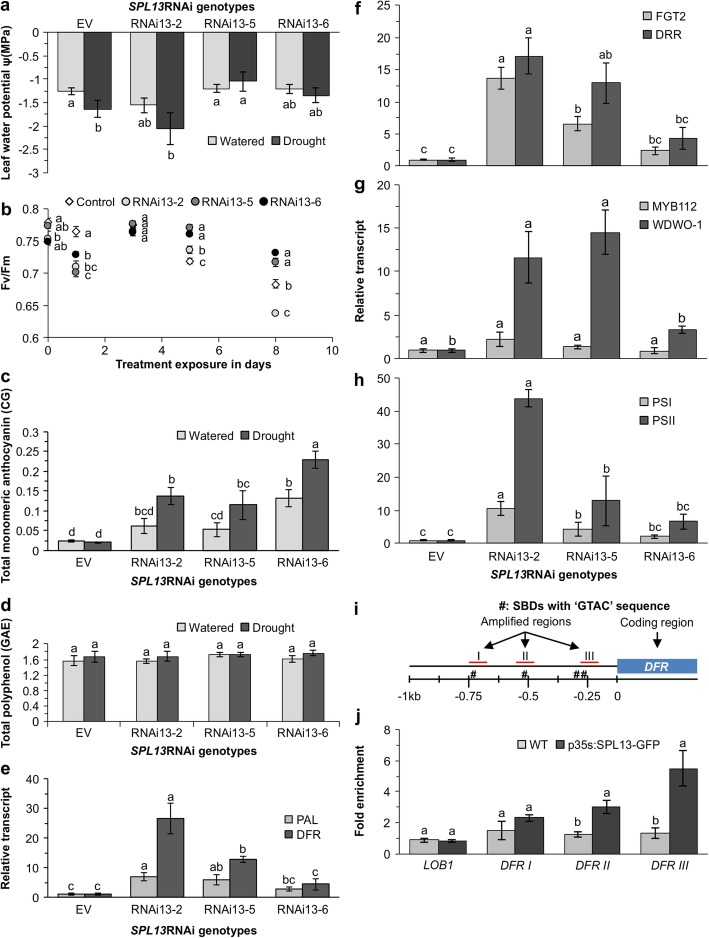
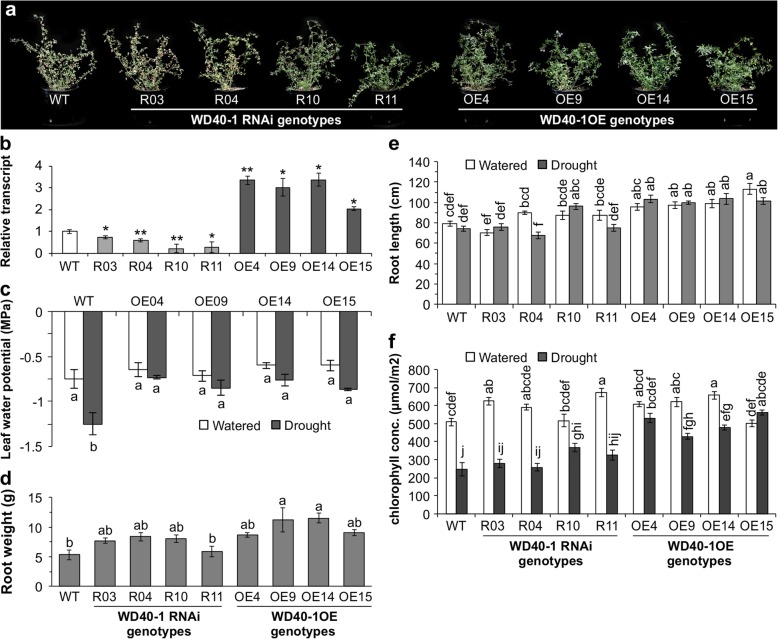
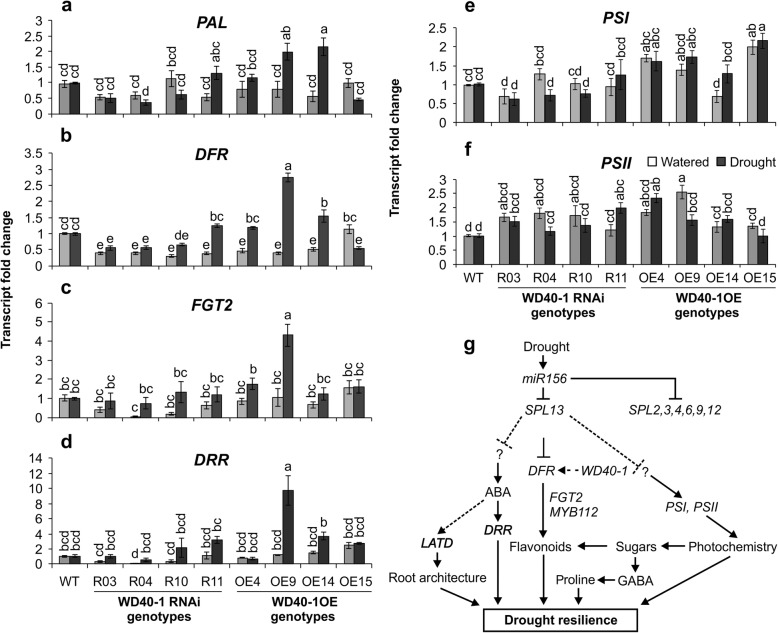
Results: To understand the mechanism of miR156-modulated drought stress tolerance in alfalfa we used genotypes with altered expression levels of miR156, miR156-regulated SPL13, and DIHYDROFLAVONOL-4-REDUCTASE (DFR) regulating WD40-1. Previously we reported the involvement of miR156 in drought tolerance, but the mechanism and downstream genes involved in this process were not fully studied. Here we illustrate the interplay between miR156/SPL13 and WD40-1/DFR to regulate drought stress by coordinating gene expression with metabolite and physiological strategies. Low to moderate levels of miR156 overexpression suppressed SPL13 and increased WD40-1 to fine-tune DFR expression for enhanced anthocyanin biosynthesis. This, in combination with other accumulated stress mitigating metabolites and physiological responses, improved drought tolerance. We also demonstrated that SPL13 binds in vivo to the DFR promoter to regulate its expression.

Conclusions: Taken together, our results reveal that moderate relative miR156 transcript levels are sufficient to enhance drought resilience in alfalfa by silencing SPL13 and increasing WD40-1 expression, whereas higher miR156 overexpression results in drought susceptibility.

Keywords: Alfalfa; Drought; SQUAMOSA-PROMOTER BINDING PROTEIN-LIKE13; WD40–1; miR156; microRNA.


Conflict of interest statement

The authors declare that they have no competing interests.

Figures

Fig. 1
Fig. 1
Effects of miR156 overexpression on drought tolerance and physiological responses in alfalfa. a Roots of EV and miR156OE plants under drought stress; b root length; c root weight; d stem basal diameter change under drought; e root/shoot biomass ratio; f leaf water potential; g Vcmax, maximum rate of rubisco carboxylase activity; h Jmax, maximum rate of photosynthetic electron transport; i dark adapted chlorophyll florescence, Fv/Fm, and j photosynthetic assimilation rate in well-watered (control) and drought stressed plants. Values are sample means ± SE, n = 4 individual plants except in ‘d’, ‘e’, ‘f’, ‘i’, ‘j’ where n = 5. ANOVA p values are provided in Additional file 2: Table S5.1. Significant difference in Post hoc Tukey multiple comparisons test is indicated with different letters. Letters in multiple time point data of ‘i’ and ‘j’ is analyzed separately
Fig. 2
Fig. 2
LCMS-based metabolite profiling illustrates distinct profile in miR156OE genotypes during drought stress. a Principal component analysis of metabolite profile in stem, b leaf, and c root tissues under drought stress; d metabolite features that are significantly different at p < 0.01 from EV plants in tissues of stem, e leaf, and f root tissues; g proportion of metabolite features that are significantly increased (≥ 1.5 log 2 fold change) or decreased (≤ − 1.5 log 2 fold change) relative to EV under drought stress; h relative levels of anthocyanin metabolites of peonidin 3-O-glucoside, PG, and i delphinidin 3-O-(6″-acetyl)-glucoside, DAG. The relative abundance of metabolites is normalized to an internal standard. Values are sample means ± SE, n = 4 individual plants. ANOVA p values are provided in Additional file 2: Table S5. 4. Significant difference in Post hoc Tukey multiple comparisons test is indicated with different letters
Fig. 3
Fig. 3
GCMS-based primary metabolite profiling demonstrates drought stress tolerance strategies by miR156. a Relative levels of proteinogenic amino acids in leaf tissues during drought stress: alanine, asparagine, aspartate, glycine, isoleucine, serine, threonine, tryptophan and valine; b relative levels of metabolites from the γ-aminobutyric acid (GABA) shunt in leaf, stem and root tissues of proline, and c GABA; d relative levels of sugars from tissues of leaf, stem and root as fructose, and e arabinose under drought stress. Values are sample means ± SE, n = 4 individual plants. ANOVA p values are provided in Additional file 2: Table S5.5. Significant difference in Post hoc Tukey multiple comparisons test is indicated with different letters
Fig. 4
Fig. 4
Differential transcript levels of selected genes in the phenylpropanoid pathway and photosystems during drought stress. a qRT-PCR based transcript levels of leaf, stem and root tissues of  DIHYDROFLAVONOL-4-REDUCTASE, DFR; b MYB112; c WD40–1; d FLAVONOID GLUCOSYLTRANSFERASE2, FGT2; e PHOTOSYSTEM I p700 CHLOROPHYLL A APOPROTEIN APS I, PSI; f PHOTOSYSTEM II Q(b), PSII, n = 4 individual plants, values are sample means ± SE. Transcript abundance is relative to empty vector after being normalized to acetyl-CoA carboxylase, ACC1, and ACTIN housekeeping genes. ANOVA p values are provided in Additional file 2: Table S5.6. Significant difference in Post hoc Tukey multiple comparisons test is indicated with different letters
Fig. 5
Fig. 5
SPL13 silencing regulates drought by coordinated metabolite, transcript, and physiological adjustments. a Leaf water potential in SPL13RNAi and EV plants; b dark adapted chlorophyll florescence, Fv/Fm, during drought stress; c total monomeric anthocyanin expressed as cyanidin-o-glucoside equivalent (CG); and d total polyphenol content expressed as gallic acid equivalent (GAE); e transcript levels of PHENYLALANINE AMMONIA-LYASE, PAL, and DIHYDROFLAVONOL-4-REDUCTASE, DFR; f FLAVONOID GLUCOSYLTRANSFERASE2, FGT2, and DEHYDRATION RESPONSIVE RD-22-LIKE, DRR; g MYB112 and WD40–1 transcription factor genes from the phenylpropanoid pathway in stems of SPL13RNAi and EV genotypes; h transcript levels of PHOTOSYSTEM I p700 CHLOROPHYLL A APOPROTEIN APS I, PSI, and PHOTOSYSTEM II Q(b), PSII under drought stress; i schematic representation of potential SPL13 binding sites in the promoter region of DFR, j ChIP-qPCR based fold enrichment analysis of SPL13 in p35S:SPL13-GFP and WT plants from means of n = three individual plants where LATERAL ORGAN BOUNDARES-1, LOB1, is used as a negative control. Values are means ± SE, light gray bars in ‘a’, ‘c’ and ‘d’ represent values under well-watered condition while dark gray bars represent values under drought stressed conditions. Relative transcript levels in ‘e’, ‘f’, ‘g’ and ‘h’ are shown relative to EV after being normalized to acetyl-CoA carboxylase, ACC1, and ACTIN housekeeping genes. ANOVA p values are provided in Additional file 2: Table S5.2, S5.7 and S5.8. Significant difference in Post hoc Tukey multiple comparisons test is indicated with different letters. Letters in multiple time point data of ‘b’ is analyzed separately
Fig. 6
Fig. 6
WD40–1 enhances drought tolerance in alfalfa. a above ground phenotypes of WT, four WD40–1RNAi and four WD40–1OE genotypes during drought stress; b transcript levels of WD40–1 in WT, WD40–1RNAi WD40–1OE genotypes used for the study; c leaf water potential in WT and WD40–1OE genotypes under well-watered and drought stress condition; d root weight in drought stressed WT, WD40–1RNAi and WD40–1OE plants; e root length in well-watered and drought stressed WT, WD40–1RNAi and WD40–1OE plants; and f chlorophyll concentration in well-watered and drought stressed WT, WD40–1RNAi and WD40–1OE plants. Values are means ± SE; n = 4 individual plants for ‘b’ to ‘e’ while n = 20 in ‘f’. ANOVA p values are provided in Additional file 2: Table S5.3. Significant difference in Post hoc Tukey multiple comparisons test is indicated with different letters
Fig. 7
Fig. 7
WD40–1 regulates transcript levels of genes in the phenylpropanoid pathway and photosystem during drought stress. a Transcript levels of PHENYLALANINE AMMONIA-LYASE, PAL; b DIHYDROFLAVONOL-4-REDUCTASE, DFR; c FLAVONOID GLUCOSYLTRANSFERASE2, FGT2; d DEHYDRATION RESPONSIVE RD-22-LIKE, DRR; (e) PHOTOSYSTEM I p700 CHLOROPHYLL A APOPROTEIN APS I, PSI; f PHOTOSYSTEM II Q(b), PSII. Transcript levels are shown relative to EV after being normalized to acetyl-CoA carboxylase, ACC1, and ACTIN housekeeping. Values are means ± SE, n = 4 individual plants, ANOVA p values are provided in Additional file 2: Table S5.9; g schematic representation of miR156-based alfalfa drought resilience model system. Solid line represents an experimentally confirmed mechanism while broken lines are hypothesized functions. Arrow heads indicate positive regulation while line heads indicate negative regulation. Significant difference in Post hoc Tukey multiple comparisons test is indicated with different letters

References

    1. Ray DK, Gerber JS, MacDonald GK, West PC. Climate variation explains a third of global crop yield variability. Nat Commun. 2015;6:5989. doi: 10.1038/ncomms6989. - DOI - PMC - PubMed
    1. Olesen JE, Trnka M, Kersebaum KC, Skjelvåg AO, Seguin B, Peltonen-Sainio P, et al. Impacts and adaptation of European crop production systems to climate change. Eur J Agron. 2011;34(2):96–112. doi: 10.1016/j.eja.2010.11.003. - DOI
    1. Mba C, Guimaraes EP, Ghosh K. Re-orienting crop improvement for the changing climatic conditions of the 21st century. Agric Food Secur. 2012;1(1):1–17. doi: 10.1186/2048-7010-1-7. - DOI
    1. Zhou M, Luo H. MicroRNA-mediated gene regulation: potential applications for plant genetic engineering. Plant Mol Biol. 2013;83(1):59–75. doi: 10.1007/s11103-013-0089-1. - DOI - PubMed
    1. Sun G. MicroRNAs and their diverse functions in plants. Plant Mol Biol. 2012;80(1):17–36. doi: 10.1007/s11103-011-9817-6. - DOI - PubMed

MeSH terms

LinkOut - more resources