. 2020 Feb 15;41(3):656-665.
doi: 10.1002/hbm.24830. Epub 2019 Oct 22.

Beta-band oscillations play an essential role in motor-auditory interactions

Affiliations

Beta-band oscillations play an essential role in motor-auditory interactions

Omid Abbasi et al. Hum Brain Mapp. .

Abstract

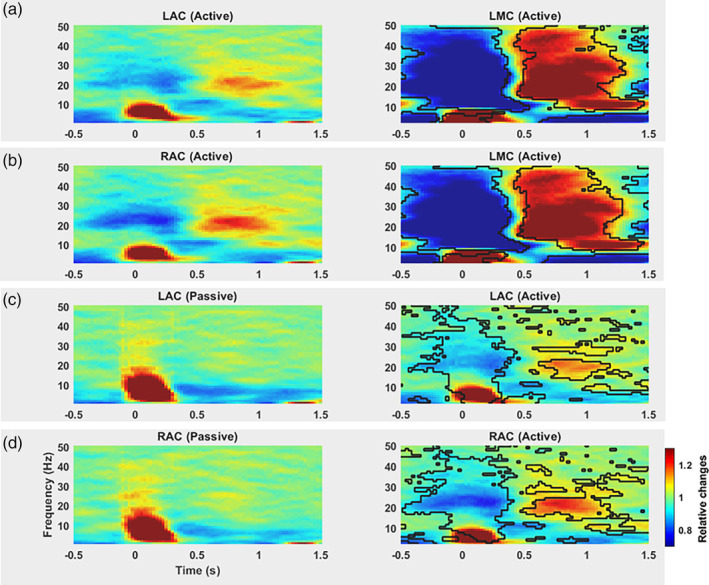
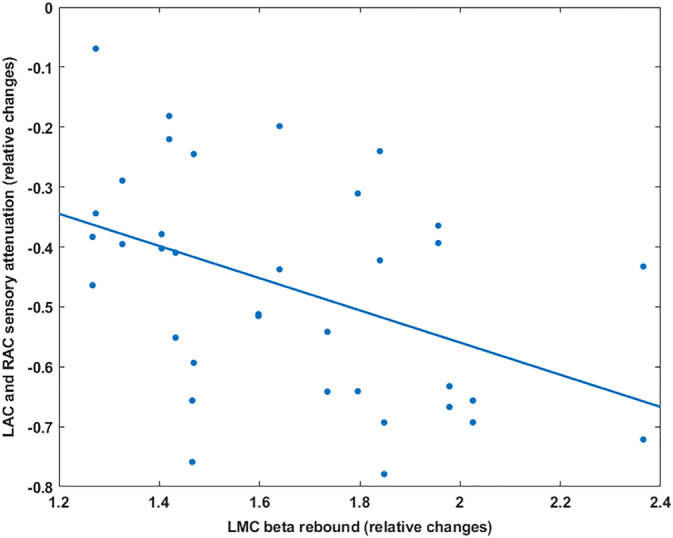
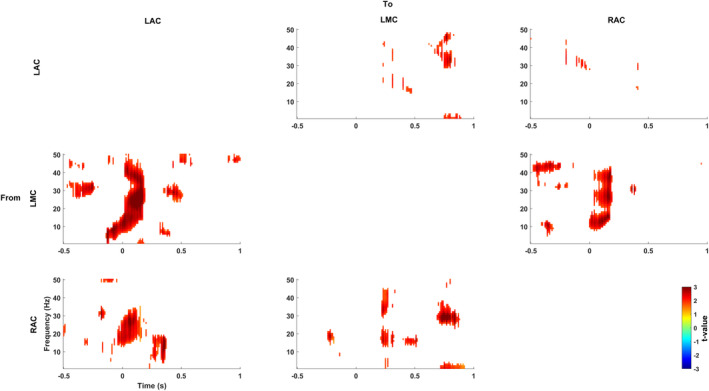
In the human brain, self-generated auditory stimuli elicit smaller cortical responses compared to externally generated sounds. This sensory attenuation is thought to result from predictions about the sensory consequences of self-generated actions that rely on motor commands. Previous research has implicated brain oscillations in this process. However, the specific role of these oscillations in motor-auditory interactions during sensory attenuation is still unclear. In this study, we aimed at addressing this question by using magnetoencephalography (MEG). We recorded MEG in 20 healthy participants during listening to passively presented and self-generated tones. Our results show that the magnitude of sensory attenuation in bilateral auditory areas is significantly correlated with the modulation of beta-band (15-30 Hz) amplitude in the motor cortex. Moreover, we observed a significant directional coupling (Granger causality) in beta-band originating from the motor cortex toward bilateral auditory areas. Our findings indicate that beta-band oscillations play an important role in mediating top-down interactions between motor and auditory cortex and, in our paradigm, suppress cortical responses to predicted sensory input.

Keywords: MEG; auditory perception; beta-band oscillation; motor-auditory interactions; prediction; sensory attenuation.


Figures

Figure 1
Figure 1
Sensory attenuation in the auditory cortex (top grey panel) and beta‐band modulation in the motor cortex (bottom grey panel). (a) Localization of group average M100 attenuation demonstrates the strongest M100 attenuation in bilateral auditory areas (sensory attenuation value: [active–passive]/passive). (b) Grand averaged of the extracted time series from left auditory cortex (LAC) voxel shows stronger auditory evoked field (M100 component) in passive condition as compared to active condition. (c) Group average beta modulation was localised over the left motor cortex. Colour codes beta power changes relative to beta rebound induced by the right index finger button press. (d) Grand averaged time–frequency spectrogram for left motor cortex (LMC) voxel in passive (left panel) and active (right panel) conditions. The low‐frequency power increase around 0 ms is caused by motor evoked components. Significant differences are designated by contour lines on the active map. The statistical test revealed significant changes in beta‐band power in LMC voxel in the active condition as compared to LMC voxel in the passive condition. Colour codes relative changes. Time point 0 s marks tone presentation onset
Figure 2
Figure 2
Grand averaged time–frequency spectrogram and statistical comparisons of oscillatory power in the motor cortex and auditory cortices. Rows 1 and 2: Time–frequency spectrograms show beta modulation in LMC, LAC, and RAC voxels in the active condition. The statistical test revealed significant changes in beta‐band power in LMC voxel in the active condition as compared to LAC and RAC voxels in the active condition (a and b, right panels). The resulting time–frequency clusters with cluster‐level p‐values below an alpha level of .05 (obtained from the statistical analysis) are considered significant and designated by black contour on the right spectrograms. Rows 3 and 4: Only left and right time–frequency maps of auditory cortices in the active conditions show beta modulations. Significant changes (p < .05) were found in beta‐band activity in LAC and RAC voxels (c and d, right panel) for the active condition as compared to passive condition. Colour codes the normalised power by computing relative changes with reference to the mean power from −2 to 2 s. Time point 0 s marks tone presentation onset. LAC and RAC, left auditory cortex, LMC, left motor cortex; RAC, right auditory cortex
Figure 3
Figure 3
Scatterplot of the LMC beta rebound (x‐axis) and the LAC and RAC sensory attenuation (y‐axis). The blue line indicates the fitted linear regression. The increase of beta rebound in the left motor cortex leads to stronger sensory attenuation in the auditory cortices. LAC and RAC, left auditory cortex, LMC, left motor cortex; RAC, right auditory cortex
Figure 4
Figure 4
Results of Granger causality analysis. Granger causality differences between the original and time‐reversed data in motor and auditory areas for the active condition. There is significant Granger causality in the alpha/beta range from the motor area to both left and right auditory areas. Colour codes t values. Time point 0 s marks tone presentation onset

References

    1. Abbasi, O. , Dammers, J. , Arrubla, J. , Warbrick, T. , Butz, M. , Neuner, I. , & Shah, N. J. (2015). Time‐frequency analysis of resting state and evoked EEG data recorded at higher magnetic fields up to 9.4 T. Journal of Neuroscience Methods, 255, 1–11. 10.1016/j.jneumeth.2015.07.011 - DOI - PubMed
    1. Abbasi, O. , Hirschmann, J. , Schmitz, G. , Schnitzler, A. , & Butz, M. (2016). Rejecting deep brain stimulation artefacts from MEG data using ICA and mutual information. Journal of Neuroscience Methods, 268, 131–141. 10.1016/j.jneumeth.2016.04.010 - DOI - PubMed
    1. Bastos, A. M. , Vezoli, J. , Bosman, C. A. , Schoffelen, J.‐M. , Oostenveld, R. , Dowdall, J. R. , … Fries, P. (2015). Visual areas exert feedforward and feedback influences through distinct frequency channels. Neuron, 85, 390–401. 10.1016/j.neuron.2014.12.018 - DOI - PubMed
    1. Bauer, M. , Stenner, M.‐P. , Friston, K. J. , & Dolan, R. J. (2014). Attentional modulation of alpha/beta and gamma oscillations reflect functionally distinct processes. The Journal of Neuroscience, 34, 16117–16125. 10.1523/JNEUROSCI.3474-13.2014 - DOI - PMC - PubMed
    1. Bhatt, M. B. , Bowen, S. , Rossiter, H. E. , Dupont‐Hadwen, J. , Moran, R. J. , Friston, K. J. , & Ward, N. S. (2016). Computational modelling of movement‐related beta‐oscillatory dynamics in human motor cortex. NeuroImage, 133, 224–232. 10.1016/j.neuroimage.2016.02.078 - DOI - PMC - PubMed