. 2019 Oct 21;51(2):255-276.e7.
doi: 10.1016/j.devcel.2019.10.003.

Reconstruction of the Global Neural Crest Gene Regulatory Network In Vivo

Affiliations

Reconstruction of the Global Neural Crest Gene Regulatory Network In Vivo

Ruth M Williams et al. Dev Cell. .

Abstract

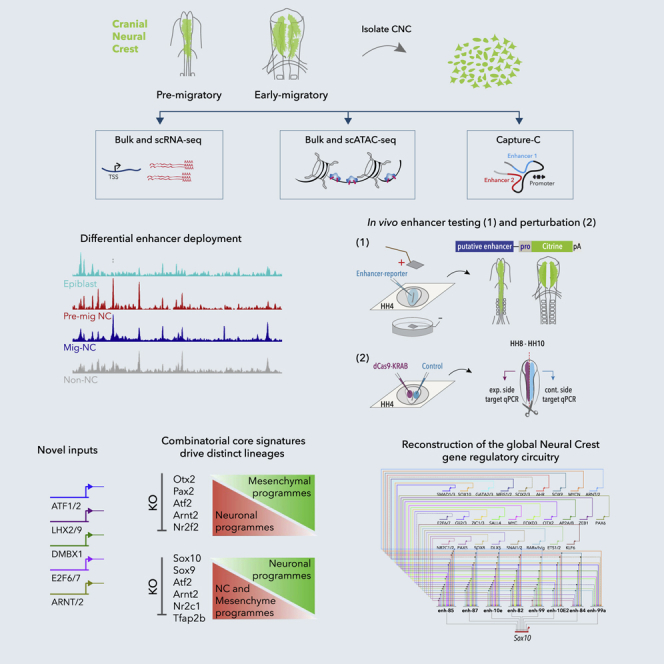
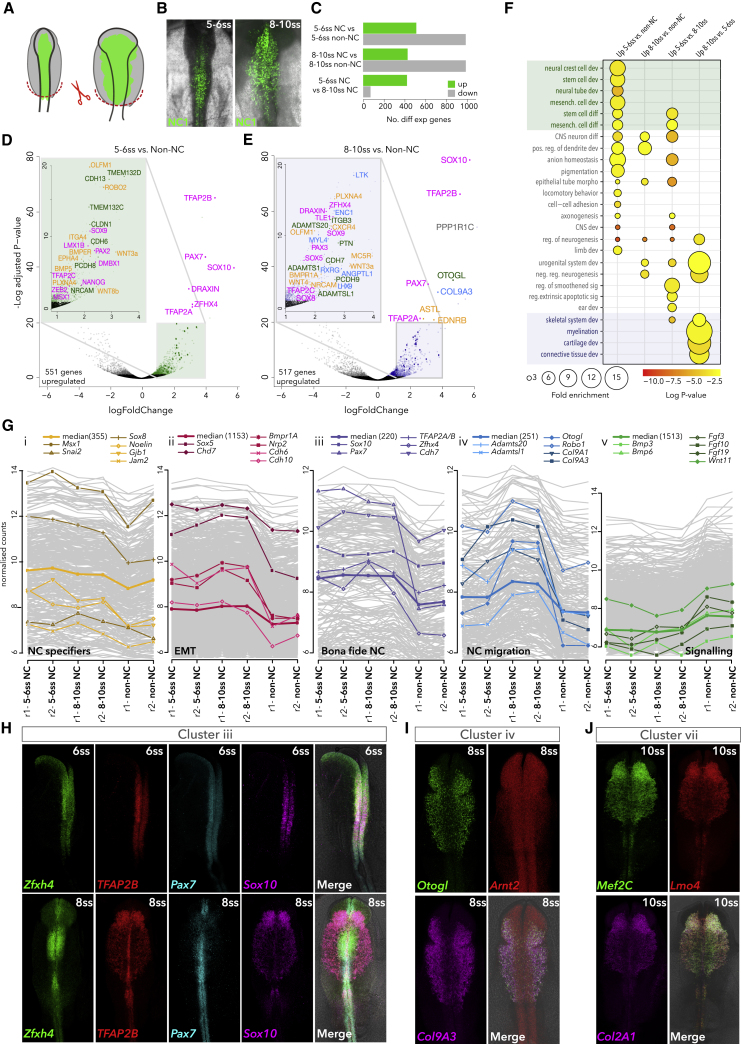
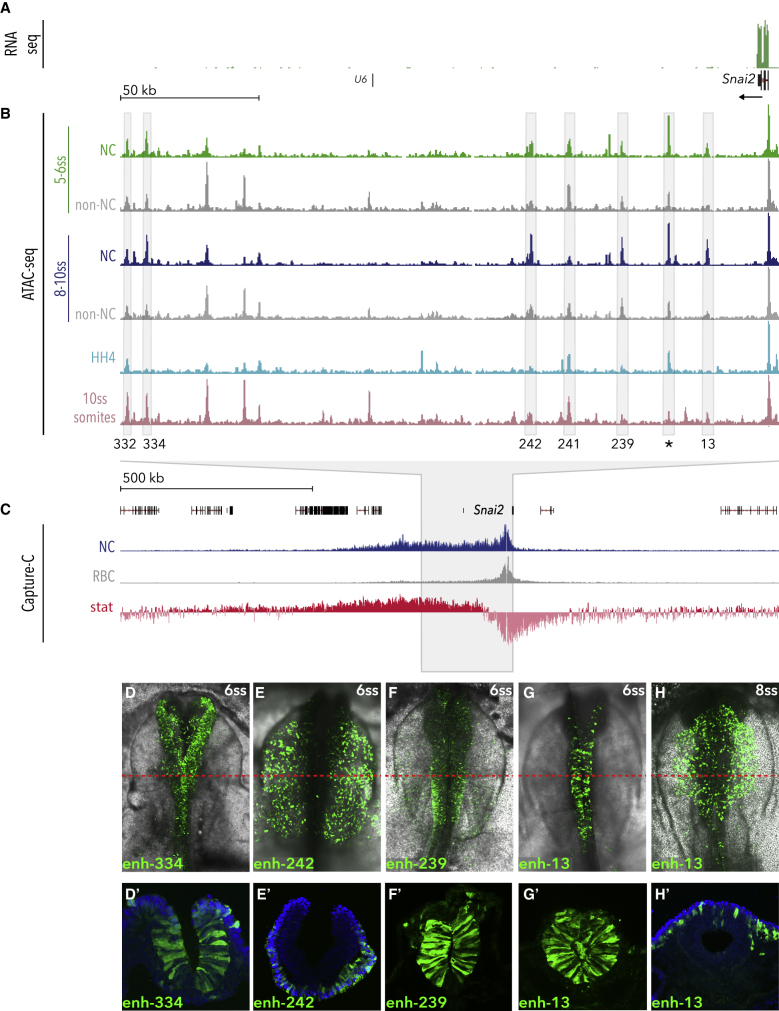
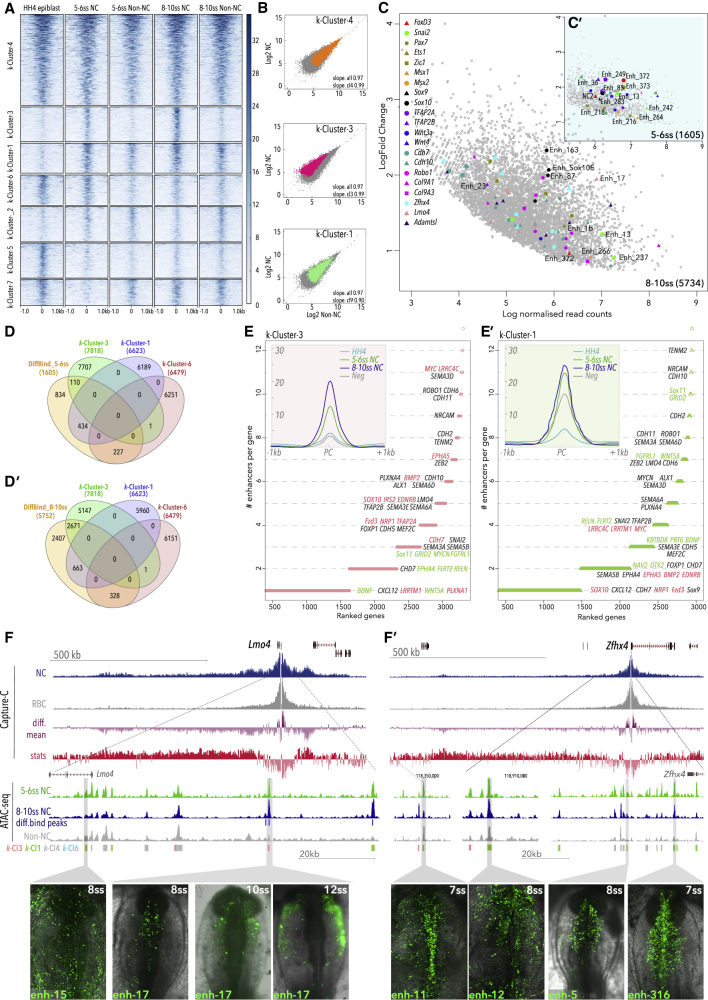
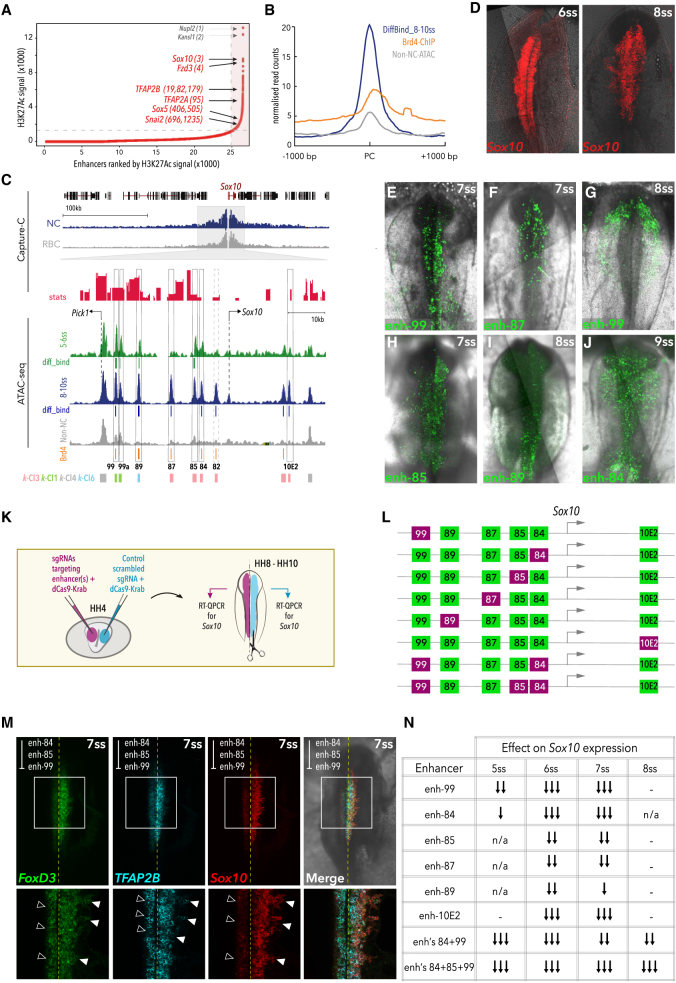
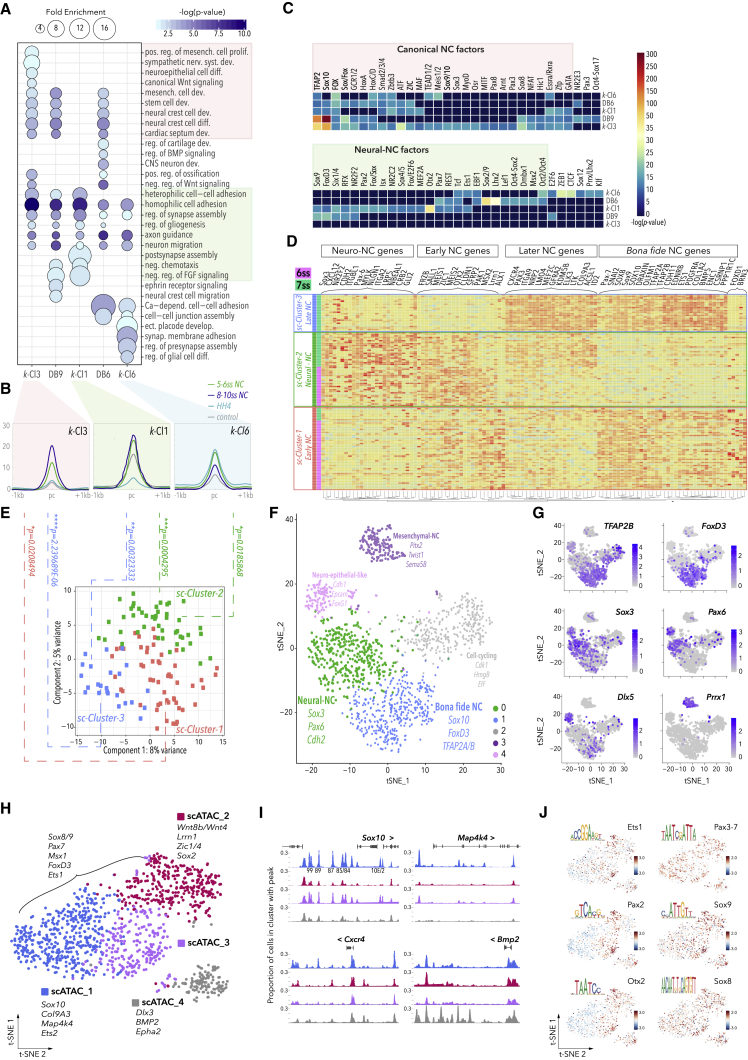
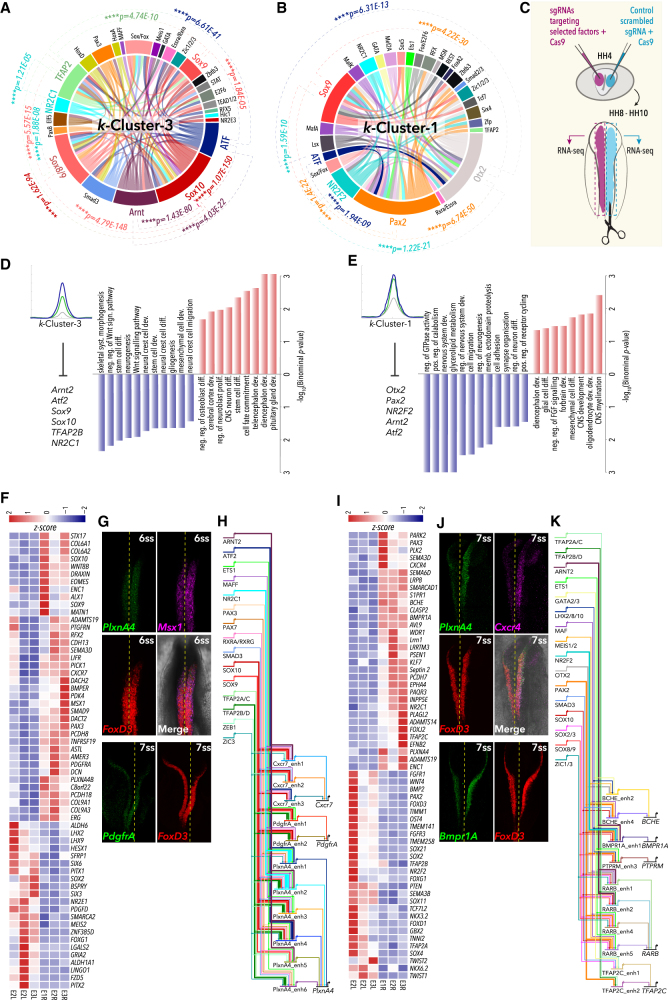
Precise control of developmental processes is encoded in the genome in the form of gene regulatory networks (GRNs). Such multi-factorial systems are difficult to decode in vertebrates owing to their complex gene hierarchies and dynamic molecular interactions. Here we present a genome-wide in vivo reconstruction of the GRN underlying development of the multipotent neural crest (NC) embryonic cell population. By coupling NC-specific epigenomic and transcriptional profiling at population and single-cell levels with genome/epigenome engineering in vivo, we identify multiple regulatory layers governing NC ontogeny, including NC-specific enhancers and super-enhancers, novel trans-factors, and cis-signatures allowing reverse engineering of the NC-GRN at unprecedented resolution. Furthermore, identification and dissection of divergent upstream combinatorial regulatory codes has afforded new insights into opposing gene circuits that define canonical and neural NC fates early during NC ontogeny. Our integrated approach, allowing dissection of cell-type-specific regulatory circuits in vivo, has broad implications for GRN discovery and investigation.

Keywords: ATAC; Capture-C; chick; enhancers; gene regulatory network; neural crest; scATAC-seq; super-enhancers; transcription factors, scRNA-seq.


Conflict of interest statement

The authors declare no competing interests.

Figures

None
Graphical abstract
Figure 1
Figure 1
Transcriptional Profiling of Early NC (A) Schematic representation of Citrine+ NC cells (green) and Citrine non-NC cells (gray) in early chicken embryos. Red dashed line indicates dissected cranial regions. (B) In vivo NC-specific activity of FoxD3 enhancer, NC1, at 5-6ss and 8-10ss. (C) Number of differentially expressed (enriched and depleted) genes in 5-6ss and 8-10ss NC compared to their respective non-NC controls and between stages. (D and E) Volcano plots showing enriched genes (LogFoldChange >1, base mean >50) in 5-6ss (D) and 8-10ss (E) compared to corresponding non-NC cells; magenta, transcription factors; green, cell-surface molecules; yellow, signaling molecules; blue, differentiation genes. Differential expression was determined using DESeq2 with a negative binomial model, p-values calculated using Wald test, corrected for multiple testing using the Benjamin-Hochberg method (padj). (F) GO terms associated with NC-enriched genes. Fold enrichments were obtained using statistical overrepresentation test, p-values calculated with binomial distributions and Bonferroni correction for multiple hypothesis testing. (G) Co-expression clusters of highly correlated genes identified by WGCNA; representative genes are shown. Two replicates per stage for NC and non-NC cells are shown on the x axis. (H) Cellular co-localization of cluster-iii genes Zfhx4, TFAP2B, Pax7, and Sox10 at 6ss (top panel) and 8ss (bottom panel), detected by HCR. (I) Co-localization of cluster-iv genes Otogl, Arnt2, and Col9a3 at 8ss. (J) Co-localization of cluster-vii genes Lmo4, Mef2C, and Col2a1 at 10ss.
Figure 2
Figure 2
Profiling Chromatin Accessibility Dynamics during Early NC Development (A and B) Genome browser views of (A) 5-6ss NC RNA-seq data and (B) ATAC-seq profiles in NC and non-NC cells at the Snai2 locus. 5-6ss NC ATAC is shown in green and 8-10ss in blue; corresponding non-NC samples are shown in gray. ATAC data from HH4 and somite tissue are shown in light blue and pink, respectively (data shown is normalized to read count and shown relative to promoter peaks across all samples). Boxes indicate putative enhancers, tested in vivo. (C) Capture-C tracks showing the TAD at the Snai2 locus in NC (blue track) and control red blood cells (RBC, gray track). Differential interactions were determined using DESeq2, hypothesis tested with Wald test and corrected for multiple testing using the Benjamin-Hochberg method. Wald statistics track (stat, in red) represents ratio of LogFoldChange values and their standard errors. (D–H) Enhancer driven in vivo reporter (Citrine) expression of tested enhancers. (D′–H′) Transverse sections of (D)–(H), immunostained for Citrine; red line indicates approximate location of section; blue, DAPI.
Figure 3
Figure 3
K-Means Clustering and Differential Analysis of Chromatin Accessibility during Early NC Development (A) Read-count-normalized ATAC-seq samples obtained from NC and non-NC control cells at HH4, 5-6ss, and 8-10ss were reiteratively assigned into cohesive groups of elements showing similar patterns of chromatin accessibility dynamics genome-wide using k-means algorithm. (B) Log-scaled scatter plots of normalised ATAC-seq counts of selected k-means clusters, quantifying differential accessibility by calculating slopes and Spearman correlation coefficients in NC and control (non-NC) cells. (C) MA plot depicting differentially accessible elements as determined by DiffBind using a negative binomial distribution model (FDR < 0.1, Fold enrichment > 1). A selection of putative enhancers to key NC genes are color coded; numbered enhancers have been tested in vivo (Figures 2D–2H, 3F, 3F′, 4E–4J, and S3). (D and D′) Venn diagrams showing overlap of k-Cluster and DiffBind elements. (E and E′) Plots representing genes assigned to k-Cl3 (E) and k-Cl1 (E′) elements, ranked by the number of associated elements. Inserts show mean merged accessibility profiles per cluster. (F and F′) Genome browser snapshots of Lmo4 (F) and Zfhx4 (F′) loci showing Capture-C (blue, NC cells; gray, RBC; purple, differential mean between experimental and control samples; red, Wald statistics track (stat) indicating ratio of LogFoldChange values and their standard errors, determined using DESeq2, with p-values calculated with Wald test and Benjamin-Hochberg correction) and ATAC (green, 5-6ss; blue, 8-10ss; gray, negative non-NC) tracks; k-means element assignment is shown. In vivo activity of selected enhancers, boxed in gray, is shown at the bottom. Zfhx4 and Lmo4 featured NC-specific upstream regulatory apparatus. Zfhx4 expression is solely controlled by k-Cl1 enhancers, with NC-specific activity (enh-5 and enh-316) as well as non-NC regulation (enh-11 and enh-12). Lmo4 NC-specific expression is governed by k-Cl3 enh-17 and non-NC activity k-Cl1 enh-15.
Figure 4
Figure 4
Super-enhancer-like Clusters Regulate Key NC Genes (A) Super-enhancers ranked by H3K27ac signal in 8-10ss NC, using the ROSE algorithm; top-ranked NC genes are annotated. (B) Mean merged profile of DiffBind elements at 8-10ss and control non-NC elements occupied by Brd4. (C) Capture-C genome browser tracks at Sox10 locus (blue, NC cells; gray, RBC; red, stat, representing ratio of LogFoldChange values and their standard errors, determined using DESeq2, p-values calculated with Wald test and Benjamin-Hochberg correction) and ATAC data (green, 5-6ss; blue, 8-10ss; gray, non-NC). DiffBind elements at 5-6ss (green) and 8-10ss (blue), Brd4-bound peaks (orange), and k-means elements are indicated. Selected putative enhancers are boxed. (D) Endogenous Sox10 expression pattern detected by HCR. (E–J) In vivo activity of novel Sox10 enhancers, (E) distal k-Cl1 enh-99 at 7ss, (F) enh-87 at 7ss, (G) enh-99 at 8ss, (H) enh-85 at 7ss, (I) k-Cl6 enh-89 at 8ss, (J) enh-84 at 9ss. (K) Schematic of bilateral electroporation assay for epigenome engineering experiments. (L) Schematic representation of decommissioned enhancers. (M) HCR for Sox10, TFAP2B, and FoxD3 following decommissioning of targeted enhancers 84, 85, and 99. (N) Table describing effect on endogenous Sox10 expression following epigenome modulation of Sox10 enhancers (single arrow, weak [< 20% decrease in Sox10 expression]; double arrow, moderate [20%–40% decrease]; triple arrow, strong [> 40% decrease]; n/a, not analyzed; −, no effect).
Figure 5
Figure 5
Functional Dissection of k-Cluster Elements, Assignment to Single-Cell Transcriptomes, and Correlation with scATAC Clusters (A) GO terms associated to k-means and DiffBind clusters. Fold enrichments were obtained using statistical overrepresentation test, p-values calculated with binomial distributions and Bonferroni correction for multiple hypothesis testing. K-Cl3 and DiffBind elements exclusively reflect canonical NC and mesenchymal cell development, and specific NC differentiation programs (sympathetic nervous system), while sharing roles in homophilic cell adhesion, gliogenesis, and axonogenesis with k-Cl6 and k-Cl1 (∗∗p < 0.01, Binomial test with Bonferroni correction, fold change >4). Only late-acting elements (k-Cl3, k-Cl1, and DiffBind 8-10ss) correlate to heterophilic cell-cell adhesion, while k-Cl6 elements play a role in early regulation of neuronal NC lineages, ectodermal placode formation, and cell-cell adhesion. (B) Mean merged density profiles of k-Clusters. (C) De novo TF binding motifs enriched in k-means and DiffBind clusters were identified using Homer. Binominal p-testing was used to determine motifs with p < 1 × 10−11. (D) scRNA-seq heatmap visualizing hierarchical clustering of single NC cells at 6-7ss (total 124 cells, 74 6ss, and 63 7ss), sc-Cluster-1 (early NC, in red), sc-Cluster-3 (late NC, in blue), sc-Cluster-2 (neuronal-NC, in green). Top 50 differentially expressed genes are shown. (E) PCA of top 100 genes from scRNA-seq. p values reflecting statistical significance of the single cell RNA-seq and k-means cluster associations were calculated using two-tailed hypergeometric test. (F) tSNE plot depicting clustering of1509 NC cells at 7ss obtained by 10X Chromium scRNA-seq. (G) Genes enriched in distinct clusters are labeled. (H) Clusters of cells with differential chromatin accessibility as determined by scATAC. (I) Chromatin accessibility patterns at differentially regulated loci. Colors correspond to (H). (J) Enriched TF motifs across scATAC clusters.
Figure 6
Figure 6
Combinatorial Motif Analysis and Perturbation of the NC-GRN (A and B) TF co-binding relationships predicted for k-Cl3 (A) and k-Cl1 (B) elements. p values were calculated using two-tailed Chi-squared test, with Bonferroni correction for multiple hypothesis. (C) Schematic of bilateral electroporation assay for CRISPR-mediated GRN perturbation experiment. (D and E) GO terms associated with mis-regulated genes following knockout of indicated TFs associated with k-Cl3 (D) and k-Cl1 (E). Enriched GO terms were obtained using statistical overrepresentation test, p-values calculated with binomial distributions and Bonferroni correction for multiple hypothesis testing. (F and I) Heatmap comparing gene expression in left (experimental) and right (control) dissected dorsal neural tubes from three representative embryos where k-Cl3 (F) or k-Cl1 (I) core TFs were targeted. Differential expression was determined using DESeq2 with a negative binomial model, p-values calculated using Wald test, corrected for multiple testing using the Benjamin-Hochberg method (padj<0.1, Log2Foldchange >1). (G and J) Expression patterns of perturbed genes following knockout of k-Cl3 (G) or k-Cl1(J) core TFs obtained by HCR. (H) Sub-circuitry of gene regulatory interactions governing Cxcr7, PlxnA4, and PdgfrA, all downregulated in perturbation of k-Cl3 core. (K) Sub-circuitry of gene regulatory interactions governing Bche, Bmpr1, Ptprm, RarB, and TFAP2C, all downregulated in perturbation of k-Cl1 core.
Figure 7
Figure 7
Shiny App Tool for Exploration of NC Gene Expression and Regulation (A) Searchable interface for gene of interest (GOI). (B) Gene expression tab allows to explore levels (shown in FPKMs) as well as dynamics and differential gene expression stats across samples analyzed. (C) WGCNA cluster tab shows assignment to co-expression clusters. (D) Gene co-expression at the single-cell level is visualized in a searchable heatmap; features adjustable cell percentage overlap and multiple gene-name searches. (E) Regulatory tab enables exploration of assigned CREs (genome co-ordinates in galgal4) and inherent TF motifs (exact location within element provided). (F) Network tab enables visualization of individual regulatory circuits assembled based on either k-Cl3 and k-Cl1 enhancers and their respective TF inputs. TF occurrence frequency and activating/repressing interactions are shown.

References

    1. Acampora D., Mazan S., Lallemand Y., Avantaggiato V., Maury M., Simeone A., Brûlet P. Forebrain and midbrain regions are deleted in Otx2-/- mutants due to a defective anterior neuroectoderm specification during gastrulation. Development. 1995;121:3279–3290. - PubMed
    1. Adli M., Bernstein B.E. Whole-genome chromatin profiling from limited numbers of cells using nano-ChIP-seq. Nat. Protoc. 2011;6:1656–1668. - PMC - PubMed
    1. Aguiar D.P., Sghari S., Creuzet S. The facial neural crest controls fore- and midbrain patterning by regulating Foxg1 expression through Smad1 activity. Development. 2014;141:2494–2505. - PubMed
    1. Aibar S., González-Blas C.B., Moerman T., Huynh-Thu V.A., Imrichova H., Hulselmans G., Rambow F., Marine J.C., Geurts P., Aerts J. SCENIC: single-cell regulatory network inference and clustering. Nat. Methods. 2017;14:1083–1086. - PMC - PubMed
    1. Andoniadou C.L., Signore M., Sajedi E., Gaston-Massuet C., Kelberman D., Burns A.J., Itasaki N., Dattani M., Martinez-Barbera J.P. Lack of the murine homeobox gene Hesx1 leads to a posterior transformation of the anterior forebrain. Development. 2007;134:1499–1508. - PMC - PubMed

Publication types

MeSH terms