. 2019;72(3):867-884.
doi: 10.3233/JAD-190817.

Transplantation of Mesenchymal Stem Cells Improves Amyloid-β Pathology by Modifying Microglial Function and Suppressing Oxidative Stress

Affiliations

Transplantation of Mesenchymal Stem Cells Improves Amyloid-β Pathology by Modifying Microglial Function and Suppressing Oxidative Stress

Kazuki Yokokawa et al. J Alzheimers Dis. 2019.

Abstract

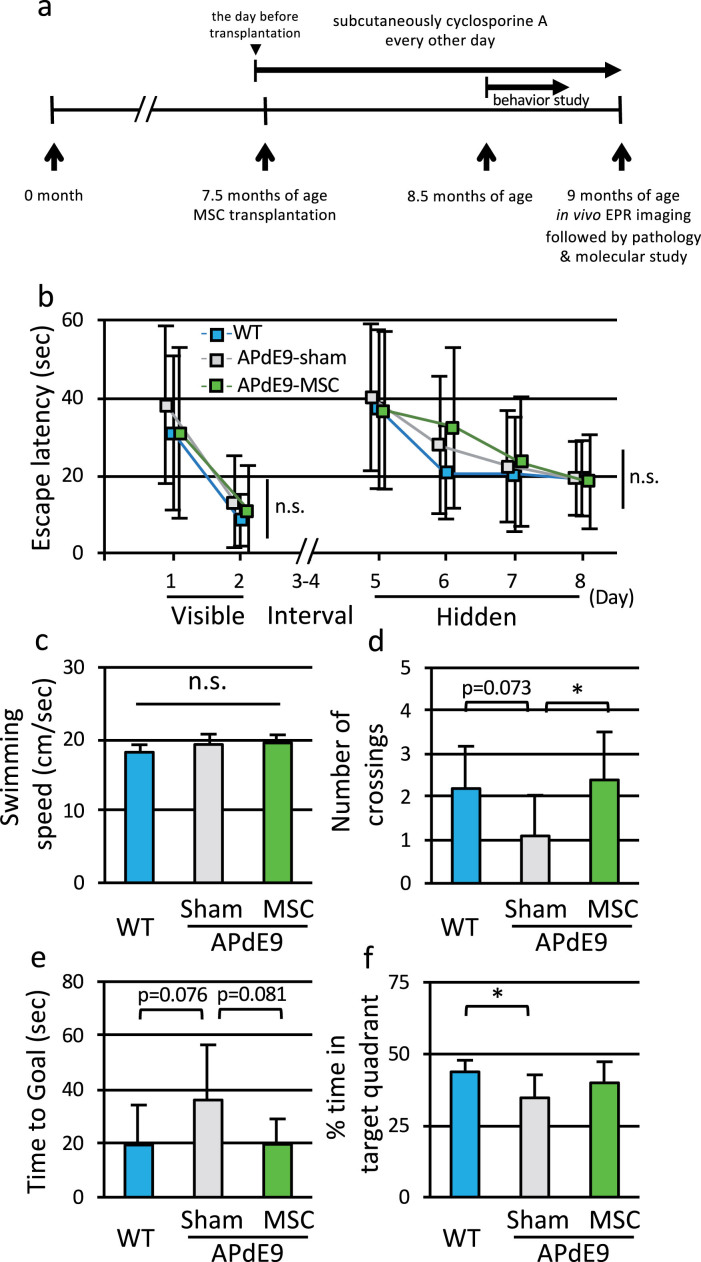
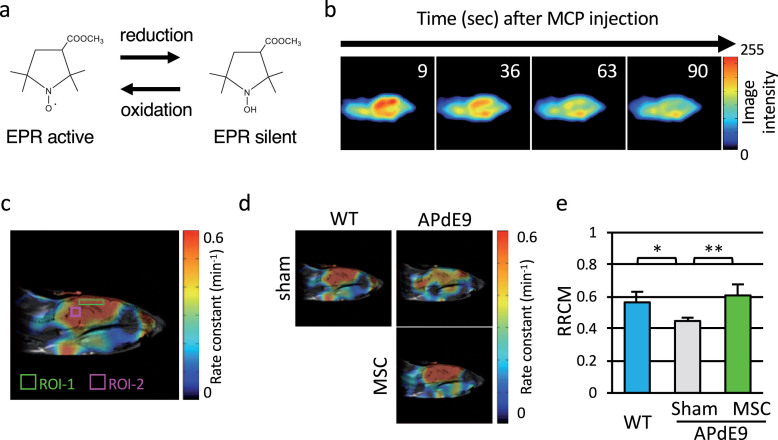
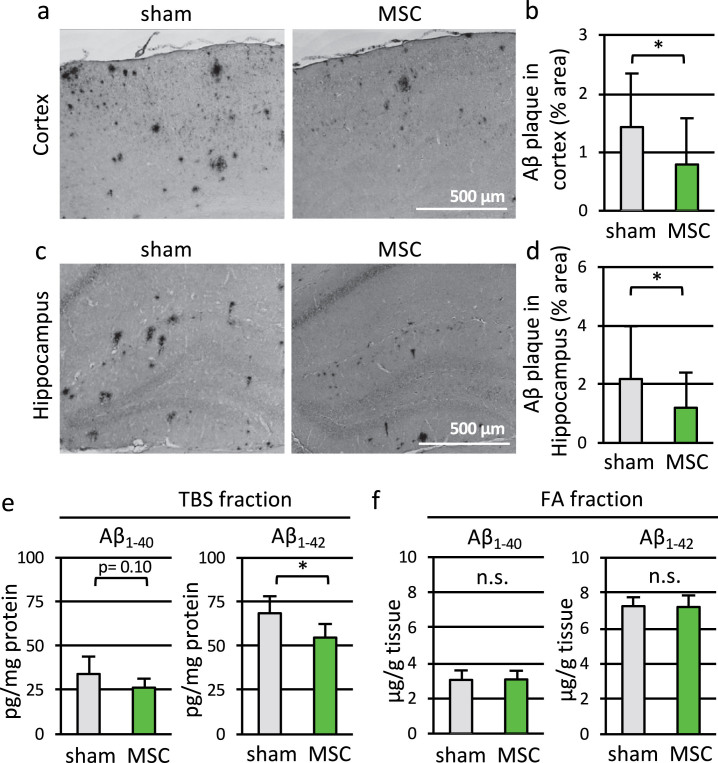
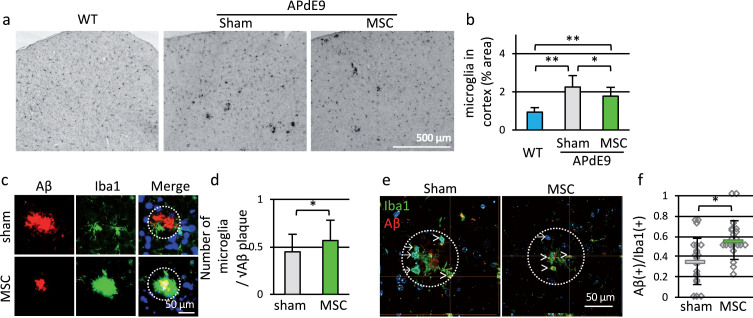
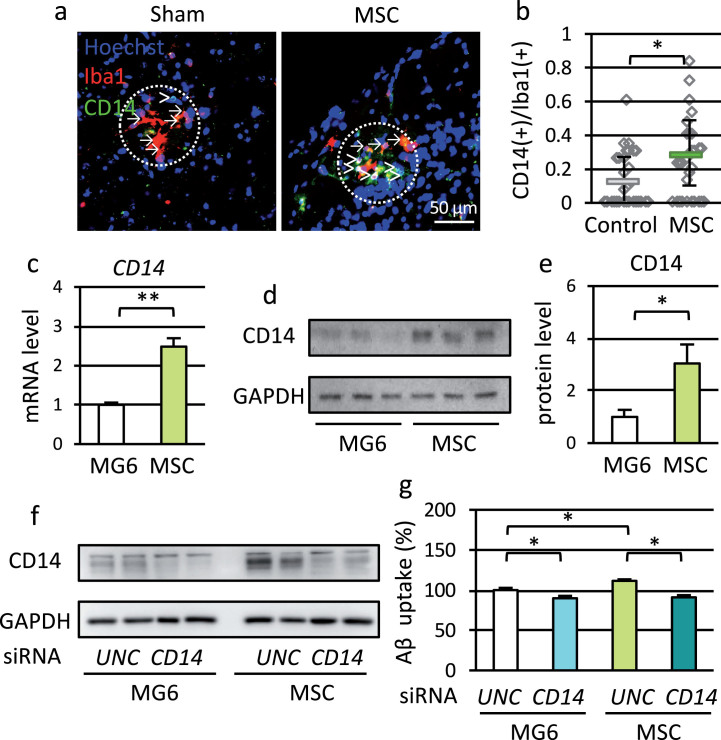
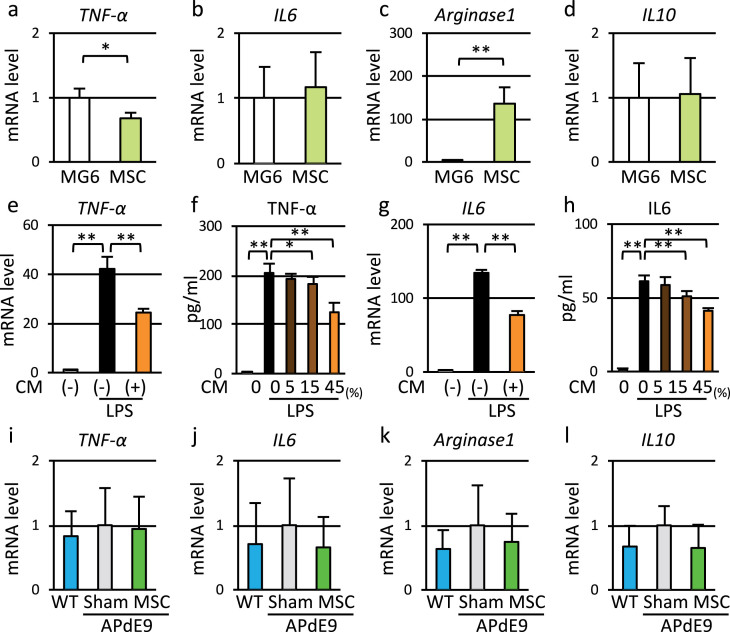
Mesenchymal stem cells (MSC) are increasingly being studied as a source of cell therapy for neurodegenerative diseases, and several groups have reported their beneficial effects on Alzheimer's disease (AD). In this study using AD model mice (APdE9), we found that transplantation of MSC via the tail vein improved spatial memory in the Morris water maze test. Using electron paramagnetic resonance imaging to evaluate the in vivo redox state of the brain, we found that MSC transplantation suppressed oxidative stress in AD model mice. To elucidate how MSC treatment ameliorates oxidative stress, we focused on amyloid-β (Aβ) pathology and microglial function. MSC transplantation reduced Aβ deposition in the cortex and hippocampus. Transplantation of MSC also decreased Iba1-positive area in the cortex and reduced activated ameboid shaped microglia. On the other hand, MSC transplantation accelerated accumulation of microglia around Aβ deposits and prompted microglial Aβ uptake and clearance as shown by higher frequency of Aβ-containing microglia. MSC transplantation also increased CD14-positive microglia in vivo, which play a critical role in Aβ uptake. To confirm the effects of MSC on microglia, we co-cultured the mouse microglial cell line MG6 with MSC. Co-culture with MSC enhanced Aβ uptake by MG6 cells accompanied by upregulation of CD14 expression. Additionally, co-culture of MG6 cells with MSC induced microglial phenotype switching from M1 to M2 and suppressed production of proinflammatory cytokines. These data indicate that MSC treatment has the potential to ameliorate oxidative stress through modification of microglial functions, thereby improving Aβ pathology in AD model mice.

Keywords: Alzheimer’s disease; CD14; electron paramagnetic resonance imaging; mesenchymal stem cells; microglia; oxidative stress.


Conflict of interest statement

Authors’ disclosures available online (https://www.j-alz.com/manuscript-disclosures/19-0817r1).

Figures

Fig.1
Fig.1
Transplantation of MSC improved spatial memory function of APdE9 mice. a) Schematic diagram of the protocol. To assess spatial learning and memory function, Morris water maze test was performed in WT, APdE9-sham, and APdE9-MSC mice at 8.5 months of age. EPR imaging was performed at 9 months of age. b) Escape latency in the training trials of Morris water maze test for WT mice, APdE9-sham mice, and APdE9-MSC mice. c) Swimming speed in the probe trial of Morris water maze test for three groups of mice. d) Number of crossing through the area where the platform was located, e) latency to reach where the platform was located, and f) percentage of time spent in target quadrant in the probe trial of Morris water maze test (n = 10 for each group).
Fig.2
Fig.2
Transplantation of MSC ameliorated redox status in APdE9 mice brain. a) Chemical structure of MCP, a BBB permeable nitroxide compound. b) Serial changes in EPR images (median sagittal plane) over time in a representative MCP-injected WT mouse head. c) Redox map of a representative WT mouse brain. The ROIs in the cerebral cortex (ROI-1) and the midbrain (ROI-2) are indicated. d) Representative redox maps of WT, APdE9-sham, and APdE9-MSC mouse heads. e) RRCM (ratio of the MCP reduction rate constant in the cerebral cortex to that in the midbrain) in WT, APdE9-Sham, and APdE9-MSC groups (n = 9 for WT, n = 5 for APdE9-sham, and n = 8 for APdE9-MSC).
Fig.3
Fig.3
Transplantation of MSC reduced Aβ deposition and soluble Aβ1–42 level in APdE9 mice. a, c) Representative parietal association cortex (a) and hippocampus (c) sections of 9-month-old APdE9-sham (left) and APdE9-MSC mice (right) immunostained for Aβ. Scale bars: 500 μm. b, d) Aβ-positive stained area in cortex (b) and hippocampus (d) in APdE9-sham and APdE9-MSC groups (n = 7 for APdE9-sham, n = 6 for APdE9-MSC). e, f) Quantification of human Aβ1–40 and Aβ1–42 level in TBS-extracted fractions and FA-extracted fractions prepared from the brains of 9-month-old APdE9-sham and APdE9-MSC mice (Aβ1–40 in TBS fraction: n = 8 for APdE9-sham and n = 7 for APdE9-MSC; in FA fraction: n = 8 for both groups. Aβ1–42 in TBS fraction: n = 7 for both groups; in FA fraction: n = 7 for APdE9-sham and n = 8 for APdE9-MSC).
Fig.4
Fig.4
Transplantation of MSC accelerated microglial accumulation around Aβ deposits and Aβ clearance. a) Representative parietal association cortex sections from 9-month-old WT, APdE9-sham and APdE9-MSC mice immunostained for Iba1. Scale bar is 500 μm. b) Iba1-positive area in WT, APdE9-sham and APdE9-MSC groups (n = 3 for WT, n = 4 for APdE9-sham and APdE9-MSC). c) Immunofluorescent staining of Aβ (red) and Iba1 (green). Nuclei were counterstained with Hoechst 33342 (blue). Radius of dotted circle is 50 μm. Scale bar is 50 μm. d) Microglial accumulation around Aβ plaque is expressed as the ratio of number of microglia around plaque (within 50 μm radius from center of Aβ deposit) to square root of the size of Aβ deposit (n = 50 for both groups). e) Number of microglia with Aβ uptake counted using confocal microscopy. Arrows indicate Aβ-negative microglia, and arrowheads indicate Aβ-positive microglia. Radius of dotted circle is 50 μm. f) Ratio of Aβ-positive microglia to all microglia around Aβ plaque (within 50 μm radius from center of Aβ deposit, n = 21 for both groups). Scale bar; 50 μm.
Fig.5
Fig.5
MSC accelerated microglial clearance of Aβ in vitro. a) MG6 cells were co-cultured with MG6 cells or MSC for 24 h. Amount of Aβ1–42 in MG6 cells was measured before exposure to Aβ [Aβ (–)], after exposure to Aβ for 3 h [Aβ(+)], and 3 h after washout of Aβ (Degradation), using ELISA. MG6 cells were exposed to fluorescent labeled Aβ and MG132 for 15 min. b) Representative images of labeled Aβ taken up by MG6 cells. Scale bar; 20 μm. c–g) Fluorescent intensity of labeled Aβ was analyzed by flowcytometry as Aβ uptake. d) Uptake of monomeric Aβ (HFIP/DMSO), oligomeric Aβ (4°C 24 h) and fibrillar Aβ (37°C 24 h). e) Uptake of Aβ when secretion from MSC was blocked by Golgistop. f) Effect of conditioned medium of MG6 cells (Con) or conditioned medium of MSC (CM) on Aβ uptake by MG6 cells. Conditioned medium was filtered through 100 kDa ultrafiltration filter (100 kDa), 10 kDa ultrafiltration filter (10 kDa), or non-filtered [Filter (–)]. g) Effect of heated conditioned medium (Heat). N.D., not detected; n.s., not significant.
Fig.6
Fig.6
MSC treatment upregulated microglial CD14 expression. a) Immunostaining for Iba1 (red) and CD14 (green) in cortex sections from 9-month-old APdE9-sham and APdE9-MSC mice. Nuclei were counterstained with Hoechst 33342 (blue). Arrows indicate CD14-negative microglia, and arrowheads indicate CD14-positive microglia. Radius of dotted circle is 50 μm. Scale bar; 50 μm. b) Ratio of CD14-positive microglia to all microglia around Aβ plaques (n = 33 for both groups). c) Messenger RNA level of CD14 in MG6 cells co-cultured with MG6 cells or MSC. d) Immunoblot of CD14 (top) and GAPDH (bottom). e) Protein level of CD14 in MG6 cells co-cultured with MG6 cells or MSC. f) Knockdown of CD14 by Universal negative control-siRNA (UNC) or CD14-siRNA (CD14). g) Uptake of Aβ by MG6 cells treated with UNC or CD14 siRNA. Twenty-four hours after siRNA treatment, MG6 were co-cultured with MG6 cells or MSC for 24 h and exposed to fluorescent labeled Aβ and MG132 for 15 min.
Fig.7
Fig.7
MSC induced M1 to M2 switch of microglia and suppressed production of pro-inflammatory cytokines in vitro. a–d) Expression levels of M1 marker genes (TNF-α and IL6) and M2 marker genes (Arginase1, and IL10) in MG6 cells co-cultured with MG6 cells or MSC. e, g) Expression levels of TNF-α and IL6 genes in MG6 cells stimulated by LPS with or without conditioned medium of MSC (CM). f, h) Secretion of TNF-α and IL6 from MG6 cells stimulated by LPS with or without conditioned medium of MSC. i–l) Expression levels of M1 marker genes and M2 marker genes in vivo.

References

    1. Perl DP (2010) Neuropathology of Alzheimer’s disease. Mt Sinai J Med 77, 32–42. - PMC - PubMed
    1. Querfurth HW, Laferla FM (2010) Alzheimer’s disease. N Engl J Med 362, 329–344. - PubMed
    1. Hardy J, Selkoe DJ (2002) The amyloid hypothesis of Alzheimer’s disease: progress and problems on the road to therapeutics. Science 297, 353–356. - PubMed
    1. Canevari L, Abramov AY, Duchen MR (2004) Toxicity of amyloid beta peptide: tales of calcium, mitochondria, and oxidative stress. Neurochem Res 29, 637–650. - PubMed
    1. Reddy PH, Beal MF (2008) Amyloid beta, mitochondrial dysfunction and synaptic damage: implications for cognitive decline in aging and Alzheimer’s disease. Trends Mol Med 14, 45–53. - PMC - PubMed

Publication types

Substances