. 2020 Jan;32(1):139-151.
doi: 10.1105/tpc.19.00332. Epub 2019 Oct 22.

Transcriptome-Based Prediction of Complex Traits in Maize

Affiliations

Transcriptome-Based Prediction of Complex Traits in Maize

Christina B Azodi et al. Plant Cell. 2020 Jan.

Abstract

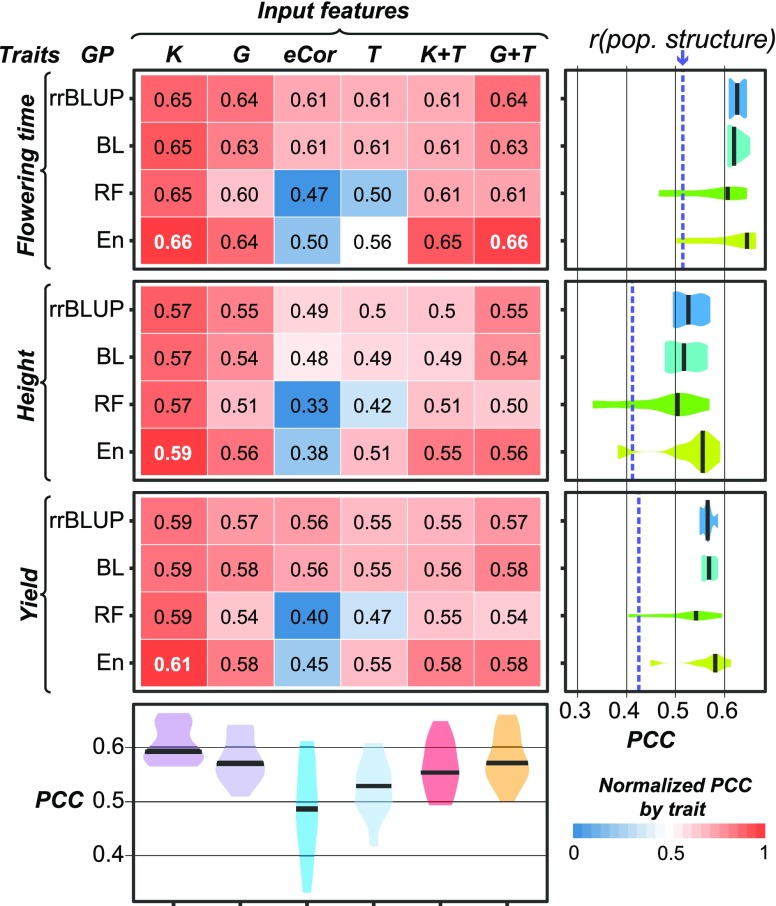
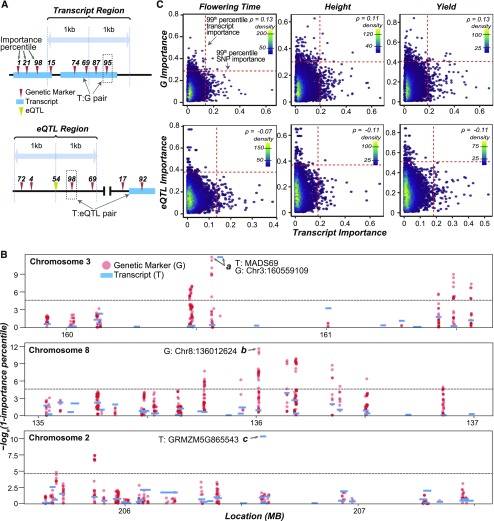
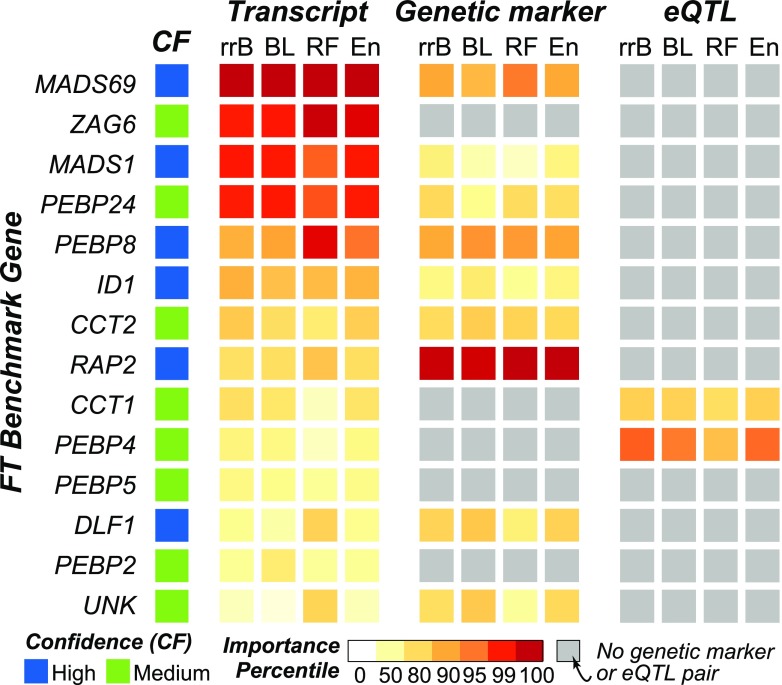
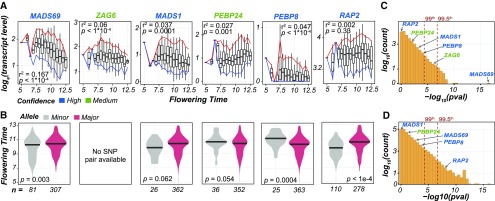
The ability to predict traits from genome-wide sequence information (i.e., genomic prediction) has improved our understanding of the genetic basis of complex traits and transformed breeding practices. Transcriptome data may also be useful for genomic prediction. However, it remains unclear how well transcript levels can predict traits, particularly when traits are scored at different development stages. Using maize (Zea mays) genetic markers and transcript levels from seedlings to predict mature plant traits, we found that transcript and genetic marker models have similar performance. When the transcripts and genetic markers with the greatest weights (i.e., the most important) in those models were used in one joint model, performance increased. Furthermore, genetic markers important for predictions were not close to or identified as regulatory variants for important transcripts. These findings demonstrate that transcript levels are useful for predicting traits and that their predictive power is not simply due to genetic variation in the transcribed genomic regions. Finally, genetic marker models identified only 1 of 14 benchmark flowering-time genes, while transcript models identified 5. These data highlight that, in addition to being useful for genomic prediction, transcriptome data can provide a link between traits and variation that cannot be readily captured at the sequence level.


Figures

Figure 1.
Figure 1.
Relationships between Lines from Transcript and Genetic Marker Data. (A) Relationship between kinship based on genetic marker data (x axis) and eCor (in PCC) based on transcript data (y axis). Boxplots show the median y axis value for each x axis bin (bin size = 0.15), with the 5th (blue) and 95th (red) percentile ranges shown. The correlation between kinship and eCor was calculated using Spearman’s rank coefficient (ρ). (B) and (C) The relationships between lines based on eCor (B) or kinship (C) for all pairs of maize lines. Lines are sorted based on hierarchical clustering results using the eCor values. The blue, white, and red color scales indicate negative, no, and positive correlations, respectively. Dotted rectangles indicate clusters of lines discussed in the text. (D) and (E) The relationships between the Euclidean distance calculated with phenotype values (phenotype distance; y axis) and kinship (D) and eCor (E). Colored lines follow those in (A). (F) The relationships between lines based on phenotype distance, where the lines were sorted as in (B). Red indicates smaller distance (more similar) and blue indicates greater distances (less similar).
Figure 2.
Figure 2.
Genomic Prediction Model Performance. PCCs between predicted and true values for three traits and four algorithms using six different input features are shown. The text in each box represents the absolute PCC, with the best performing model for each trait in white. The box color represents the PCC normalized by trait, where the brightest red (1) corresponds to the algorithm/input feature combination that performed the best for the trait and the brightest blue (0) corresponds to the combination that performed the worst. Violin plots at right show the PCC distributions among different input features for each algorithm. The median PCCs are indicated with black bars. The model performance PCCs based on only population structure (first 75 principal components) are indicated with blue dashed lines. Violin plots at bottom show the PCC distributions among different algorithms for each input feature.
Figure 3.
Figure 3.
Correlation between Genetic Marker and Transcript Importance for Flowering Time. (A) Illustration of how T:G (top graph) and T:eQTL (bottom graph) pairs were determined. Genetic marker importance percentiles are shown above the genetic markers (red triangles) and eQTL (yellow triangle). A T:G pair was defined as the transcript and the most important genetic marker within the transcript region (top graph). A T:eQTL pair was defined as the transcript and the most important genetic marker within the eQTL region (bottom graph). (B) Manhattan plots of the transcript (blue bar) and genetic marker (red dot) importance scores [−loge(1−importance percentile)] in a 2-Mb window surrounding top two genetic markers (top and middle plots) and transcripts (top and bottom plots) based on the T-based and G-based En models for predicting flowering time, respectively. All genetic markers (i.e., not just the T:G pair) are shown. The threshold (gray dotted lines) is set at the 99th percentile importance. (C) Density scatterplot of the importance scores (see Methods) of the genetic marker (y axis) and transcript (x axis) for T:G pairs (top graphs) and of the eQTL genetic marker (y axis) and transcript (x axis) for the T:eQTL pairs (bottom graphs) for three traits derived from the G-based and T-based En models, respectively. The threshold (red dotted line) was set at the 99th percentile importance score for each trait and input feature type. The correlation between importance scores between transcript and genetic marker/eQTL pairs was calculated using Spearman’s rank (ρ). SNP, single nucleotide polymorphism.
Figure 4.
Figure 4.
Comparison of Transcript and Genetic Marker Importance Scores for Benchmark Flowering-Time Genes. Importance percentile of each transcript and genetic marker pair as determined by each of the four algorithms (x axis) is shown. Genes are sorted based on hierarchical clustering of their importance percentiles. Gray boxes designate benchmark genes that did not have genetic markers within a 40-kb window. Confidence levels (high or medium) were assigned based on the type of evidence available for the benchmark gene (see Methods). rrB, rrBLUP.
Figure 5.
Figure 5.
Relationship between Transcript Level/Allele Type and Flowering Time for Benchmark Genes. (A) Boxplots show the transcript levels [loge(fold change)] over the flowering-time bin with the 5th (blue) and 95th (red) percentile ranges shown. Flowering time was defined as the growing degree days/100. Linear models were fit, and adjusted R2 and P values are shown. Confidence levels of benchmark genes are designated as in Figure 4. (B) Distributions of flowering time for lines with the major (red) or minor (gray) alleles for the genetic marker paired with each benchmark gene as indicated in (A). Differences in flowering time by allele were tested using t tests. (C) Number of transcripts (y axis) for which transcript levels were associated with flowering time in linear models within P value bins [−log10(P value); x axis]. Benchmark genes are labeled as in (A). (D) Number of genetic markers (y axis) for which differences in flowering time by allele from t tests were within P value bins [−log10(P value); x axis]. Benchmark genes are labeled as in (A).

Comment in

References

    1. Albert F.W., Kruglyak L. (2015). The role of regulatory variation in complex traits and disease. Nat. Rev. Genet. 16: 197–212. - PubMed
    1. Alter P., Bircheneder S., Zhou L.-Z., Schlüter U., Gahrtz M., Sonnewald U., Dresselhaus T. (2016). Flowering time-regulated genes in maize include the transcription factor ZmMADS1. Plant Physiol. 172: 389–404. - PMC - PubMed
    1. Becker J., Wendland J.R., Haenisch B., Nöthen M.M., Schumacher J. (2012). A systematic eQTL study of cis-trans epistasis in 210 HapMap individuals. Eur. J. Hum. Genet. 20: 97–101. - PMC - PubMed
    1. Bermingham M.L., Pong-Wong R., Spiliopoulou A., Hayward C., Rudan I., Campbell H., Wright A.F., Wilson J.F., Agakov F., Navarro P., Haley C.S. (2015). Application of high-dimensional feature selection: Evaluation for genomic prediction in man. Sci. Rep. 5: 10312. - PMC - PubMed
    1. Bradbury P.J., Zhang Z., Kroon D.E., Casstevens T.M., Ramdoss Y., Buckler E.S. (2007). TASSEL: Software for association mapping of complex traits in diverse samples. Bioinformatics 23: 2633–2635. - PubMed

Publication types

Substances

LinkOut - more resources