. 2019 Dec 4;39(49):9797-9805.
doi: 10.1523/JNEUROSCI.1954-19.2019. Epub 2019 Oct 22.

Alpha Oscillations in the Human Brain Implement Distractor Suppression Independent of Target Selection

Affiliations

Alpha Oscillations in the Human Brain Implement Distractor Suppression Independent of Target Selection

Malte Wöstmann et al. J Neurosci. .

Abstract

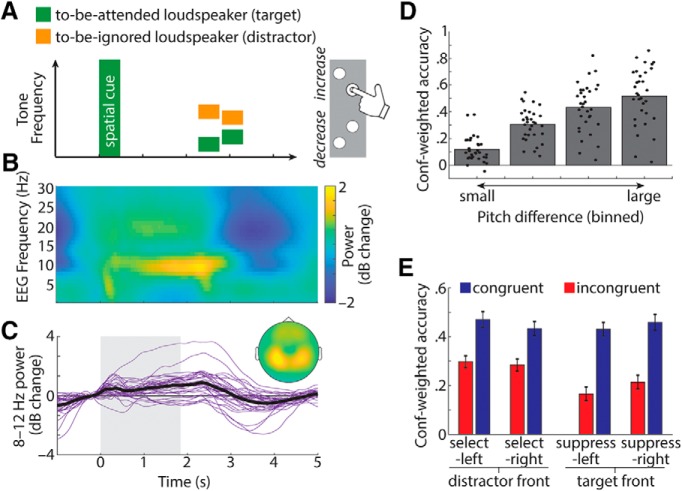
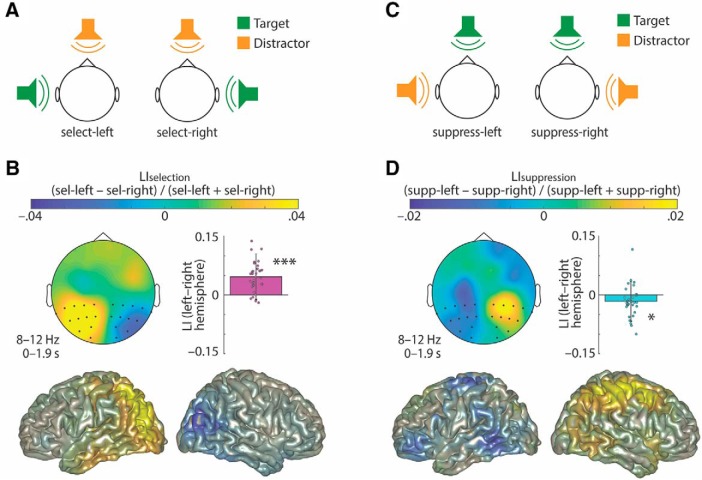
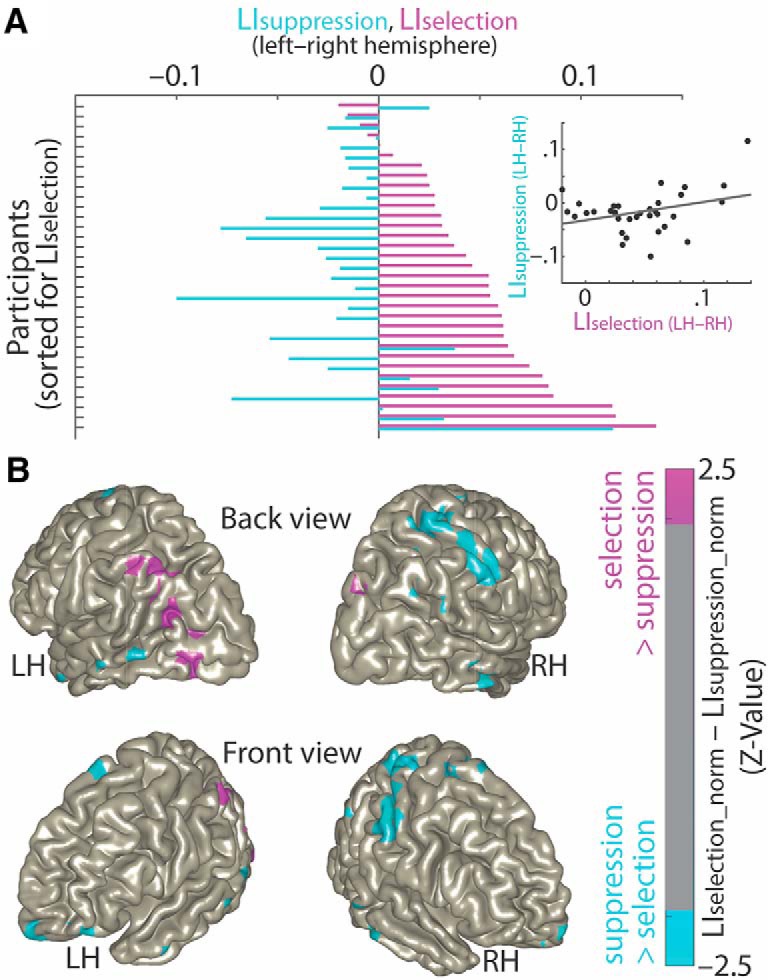
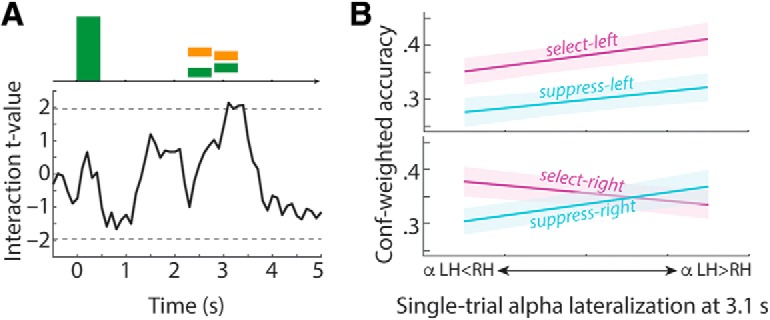
In principle, selective attention is the net result of target selection and distractor suppression. The way in which both mechanisms are implemented neurally has remained contested. Neural oscillatory power in the alpha frequency band (∼10 Hz) has been implicated in the selection of to-be-attended targets, but there is lack of empirical evidence for its involvement in the suppression of to-be-ignored distractors. Here, we use electroencephalography recordings of N = 33 human participants (males and females) to test the preregistered hypothesis that alpha power directly relates to distractor suppression and thus operates independently from target selection. In an auditory spatial pitch discrimination task, we modulated the location (left vs right) of either a target or a distractor tone sequence, while fixing the other in the front. When the distractor was fixed in the front, alpha power relatively decreased contralaterally to the target and increased ipsilaterally. Most importantly, when the target was fixed in the front, alpha lateralization reversed in direction for the suppression of distractors on the left versus right. These data show that target-selection-independent alpha power modulation is involved in distractor suppression. Although both lateralized alpha responses for selection and for suppression proved reliable, they were uncorrelated and distractor-related alpha power emerged from more anterior, frontal cortical regions. Lending functional significance to suppression-related alpha oscillations, alpha lateralization at the individual, single-trial level was predictive of behavioral accuracy. These results fuel a renewed look at neurobiological accounts of selection-independent suppressive filtering in attention.SIGNIFICANCE STATEMENT Although well established models of attention rest on the assumption that irrelevant sensory information is filtered out, the neural implementation of such a filter mechanism is unclear. Using an auditory attention task that decouples target selection from distractor suppression, we demonstrate that two sign-reversed lateralized alpha responses reflect target selection versus distractor suppression. Critically, these alpha responses are reliable, independent of each other, and generated in more anterior, frontal regions for suppression versus selection. Prediction of single-trial task performance from alpha modulation after stimulus onset agrees with the view that alpha modulation bears direct functional relevance as a neural implementation of attention. Results demonstrate that the neurobiological foundation of attention implies a selection-independent alpha oscillatory mechanism to suppress distraction.

Keywords: alpha oscillations; attention; auditory; selection; suppression.


Figures

Figure 1.
Figure 1.
A, During a pre-experiment eye movement task participants followed a dot, which jumped eight times from the left to the right side on the screen, with their gaze. The grand-average ERP (at electrode F7) was computed on the EEG data projected through one horizontal saccade component per participant (N = 33). At 8 s, participants performed an additional saccade back to the center of the screen to read task instructions. The topographic map shows ERP amplitude (1–1.2 s) following the onset of one saccade to the right side (electrode F7, highlighted). B, EEG data during the spatial attention task were projected through the same horizontal saccade component for each participant as in A. Grand-average ERPs time locked to the onset of the auditory spatial cue show no obvious saccade-related activity in trials with targets or distractors on the left versus right side.
Figure 2.
Figure 2.
A, Trial design. Presentation of a broadband auditory cue (0–10.9 kHz; 0.46 s) was followed by a jittered silent interval (1.47–2.48 s). Next, two tone sequences, each consisting of two brief (0.46 s) complex tones, were presented at different locations (front, left, or right). Fundamental frequencies of low-frequency tones within each sequence were fixed at 193 and 300 Hz. Frequencies of high-frequency tones were titrated throughout the experiment. Participants had to judge whether the target tone sequence at the cued location had increased or decreased in pitch. Participants also indicated confidence in their judgment (high, outer buttons; low, inner buttons). B, Time-frequency representation of oscillatory power (relative to a pre-trial baseline; −0.5 to 0 s; in decibel change), averaged across N = 33 participants and all (64) scalp electrodes. C, Thin purple lines show single-subject alpha power (8–12 Hz) time courses; thick black line shows average; topographic map shows average 8–12 Hz power from 0 to 1.9 s (gray box). D, Bars show average confidence (Conf)-weighted accuracy as a function of the pitch difference between the two tones within each tone sequence (divided into 4 bins for each participant for visualization), which was titrated over the course of the experiment. Dots show single-subject data. E, Bars and error bars show average ±1 between-subject SEM of confidence-weighted accuracy, separately for congruent trials (both tone sequences increasing/decreasing in pitch; blue) and incongruent trials (one tone sequence increasing and other decreasing in pitch; red).
Figure 3.
Figure 3.
A, Schematic illustration of task setup in select-left and select-right trials. B, Topographic map and cortical surfaces show the lateralization index to contrast select-left and select-right trials under fixed distraction from the front (LIselection). The LI was calculated for 8–12 Hz alpha power during anticipation of tone sequences (0–1.9 s). Bar graph, error bar, and dots show average, ±1 between-subject SEM, and single-subject differences of LI for highlighted parieto-occipital electrodes on the left versus right hemisphere, respectively. C, D, Same as A and B, but for the LI for suppression of lateralized distractor stimuli (LIsuppression). *p < 0.05, ***p < 0.001.
Figure 4.
Figure 4.
A, Bars show single-subject alpha lateralization indices at left minus right parieto-occipital electrodes (pink, LIselection; blue, LIsuppression), sorted for LIselection. Inset shows scatterplot for LIselection and LIsuppression, with least-squares regression line (Spearman rho = 0.153; p = 0.393). B, Normalization of lateralization indices on the source-level was accomplished by z-transformation of single-subject lateralization indices, followed by taking the magnitude. Brain surfaces show z statistics derived from dependent-samples t tests for the contrast of normalized lateralization indices: LIselection_norm versus LIsupression_norm. Z statistics on brain surfaces are masked in case |Z| < 1.96, corresponding to p > 0.05 for two-sided testing (uncorrected). Top, back view; bottom, front view. LH, left hemisphere; RH, right hemisphere.
Figure 5.
Figure 5.
A, Black solid line shows trace of t values for the location × role of lateralized loudspeaker × single-trial alpha lateralization interaction obtained from multiple linear mixed models. Dashed lines indicate significance thresholds (alpha = 0.05; uncorrected). B, Visualization of significant location × role of lateralized loudspeaker × alpha lateralization interaction at a latency of 3.1 s. For each participant and experimental condition, single-trial alpha lateralization values (LIsingle-trial; quantifying left-vs-right hemispheric alpha power) were separated into four bins, followed by fitting a linear slope to average confidence (Conf)-weighted accuracy as a function of increasing bin number. Lines show average across single-subject linear fits, shaded areas show ±1 between-subject SEM. LH, left hemisphere; RH, right hemisphere.

References

    1. Adrian ED. (1944) Brain rhythms. Nature 153:360–362. 10.1038/153360a0 - DOI
    1. Ahveninen J, Huang S, Belliveau JW, Chang WT, Hämäläinen M (2013) Dynamic oscillatory processes governing cued orienting and allocation of auditory attention. J Cogn Neurosci 25:1926–1943. 10.1162/jocn_a_00452 - DOI - PMC - PubMed
    1. Aron AR. (2007) The neural basis of inhibition in cognitive control. Neuroscientist 13:214–228. 10.1177/1073858407299288 - DOI - PubMed
    1. Banerjee S, Snyder AC, Molholm S, Foxe JJ (2011) Oscillatory alpha-band mechanisms and the deployment of spatial attention to anticipated auditory and visual target locations: supramodal or sensory-specific control mechanisms? J Neurosci 31:9923–9932. 10.1523/JNEUROSCI.4660-10.2011 - DOI - PMC - PubMed
    1. Bauer M, Kennett S, Driver J (2012) Attentional selection of location and modality in vision and touch modulates low-frequency activity in associated sensory cortices. J Neurophysiol 107:2342–2351. 10.1152/jn.00973.2011 - DOI - PMC - PubMed

Publication types

LinkOut - more resources