. 2019 Oct 22;12(604):eaaw5573.
doi: 10.1126/scisignal.aaw5573.

Induction of metabolic quiescence defines the transitional to follicular B cell switch

Affiliations

Induction of metabolic quiescence defines the transitional to follicular B cell switch

Jocelyn R Farmer et al. Sci Signal. .

Abstract

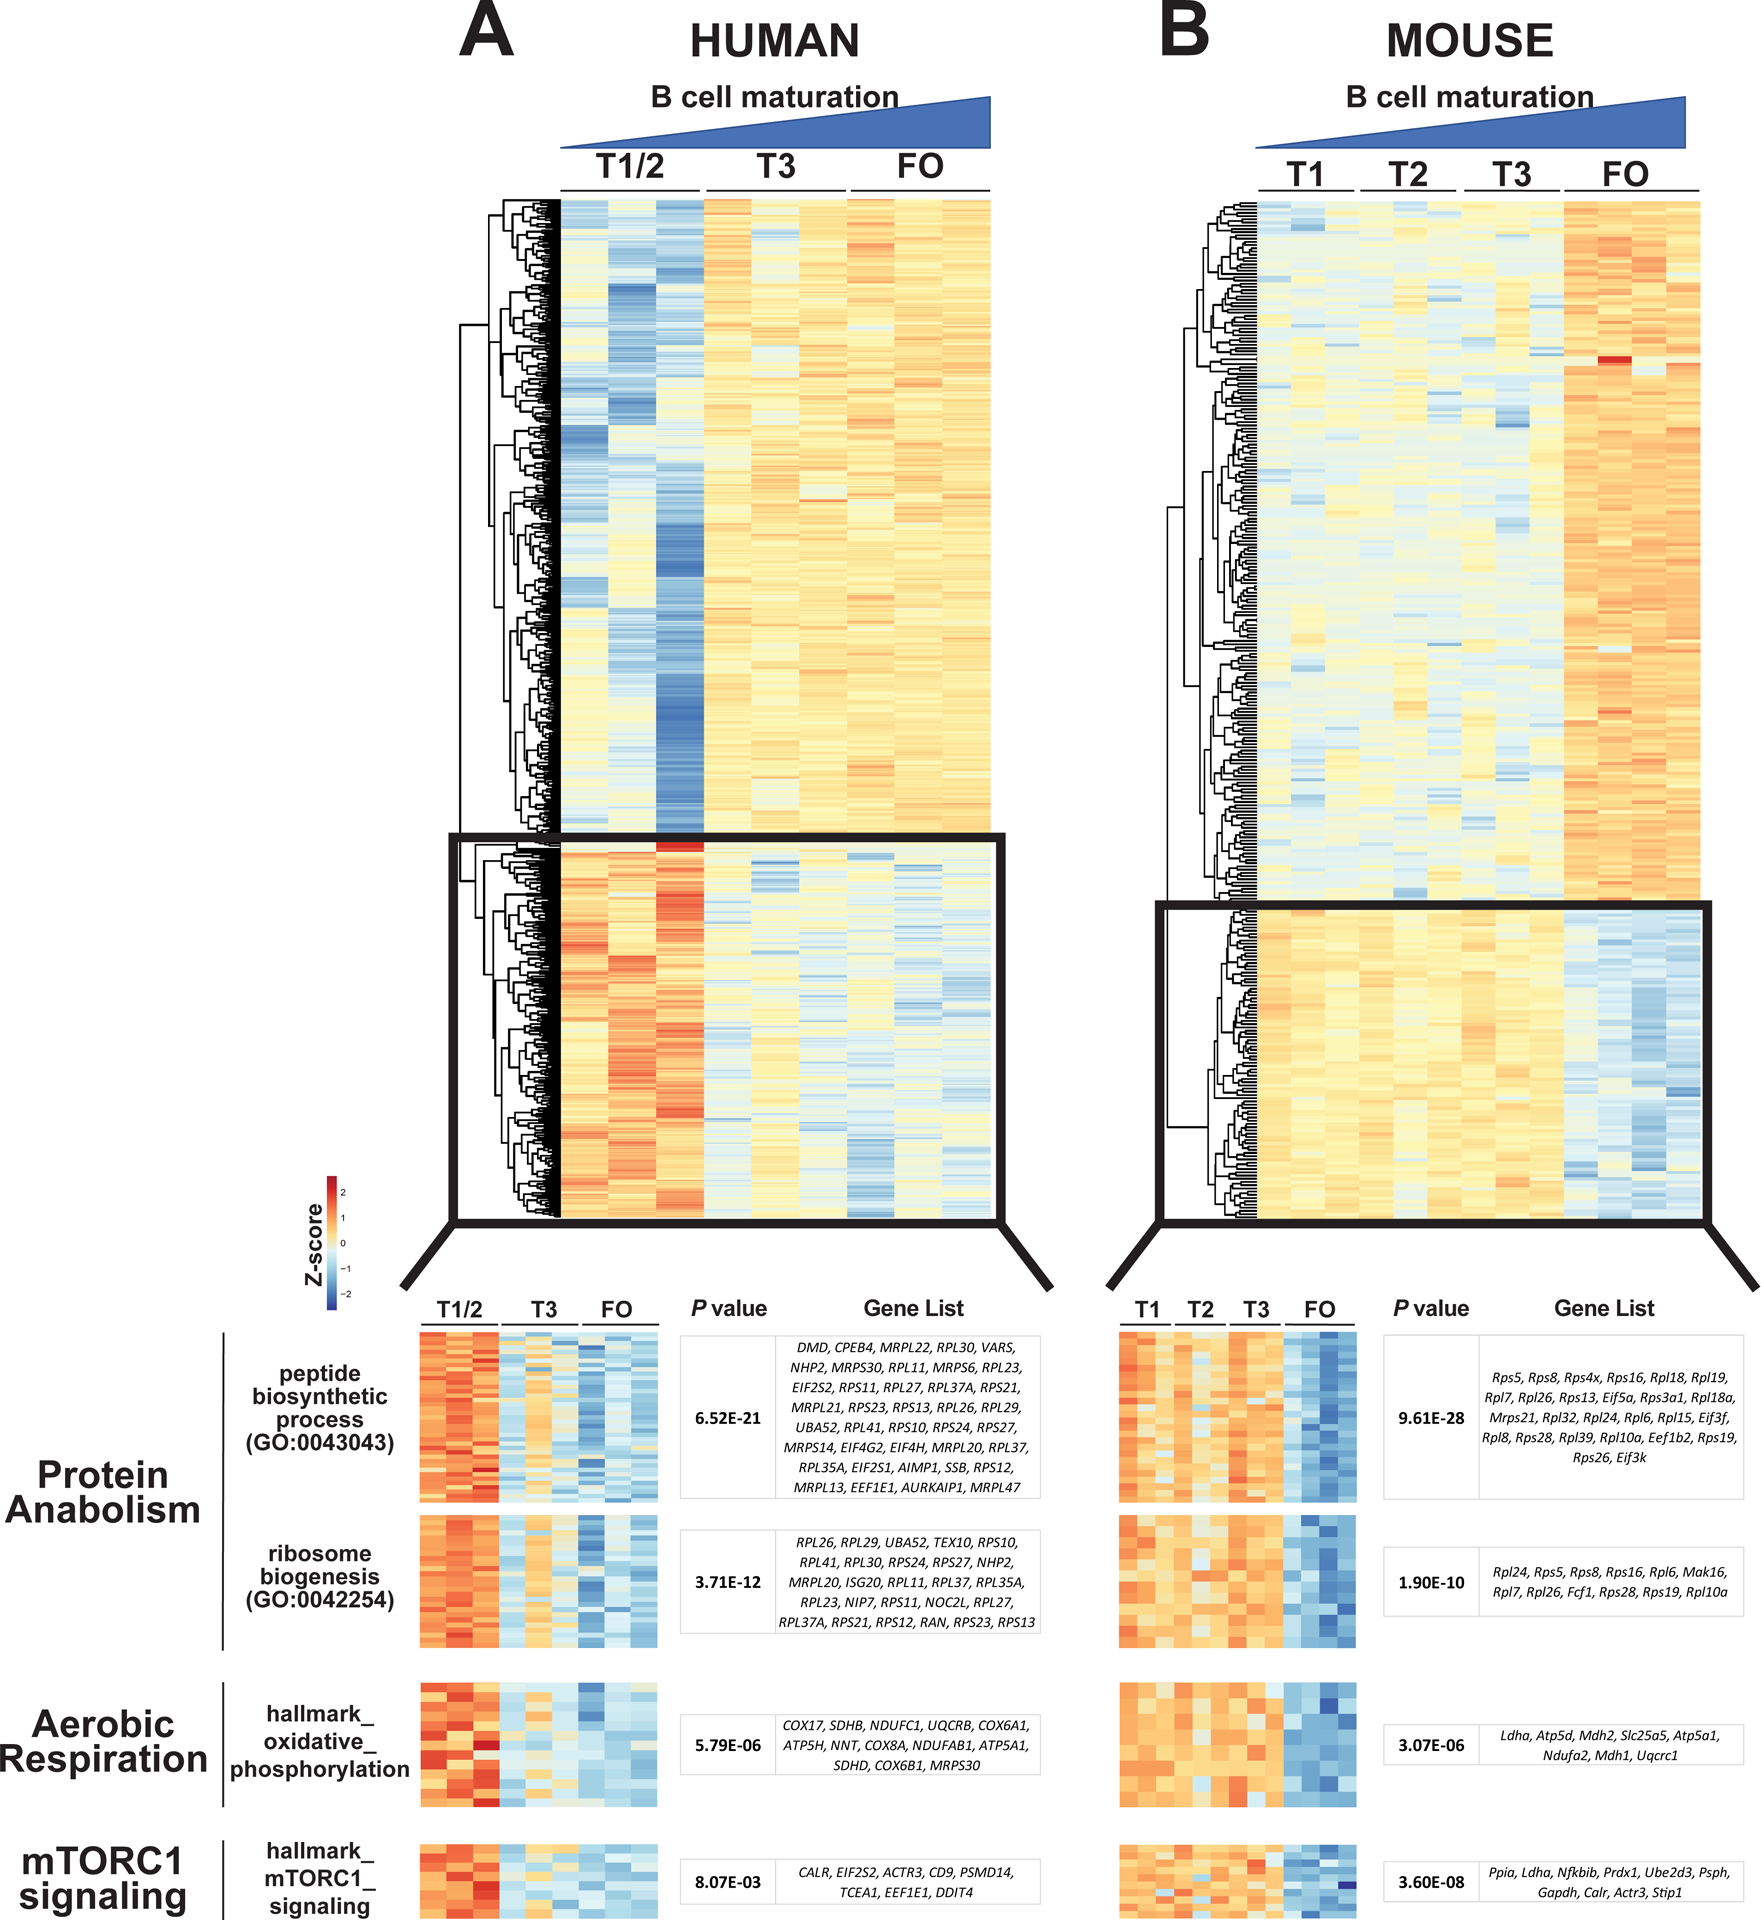
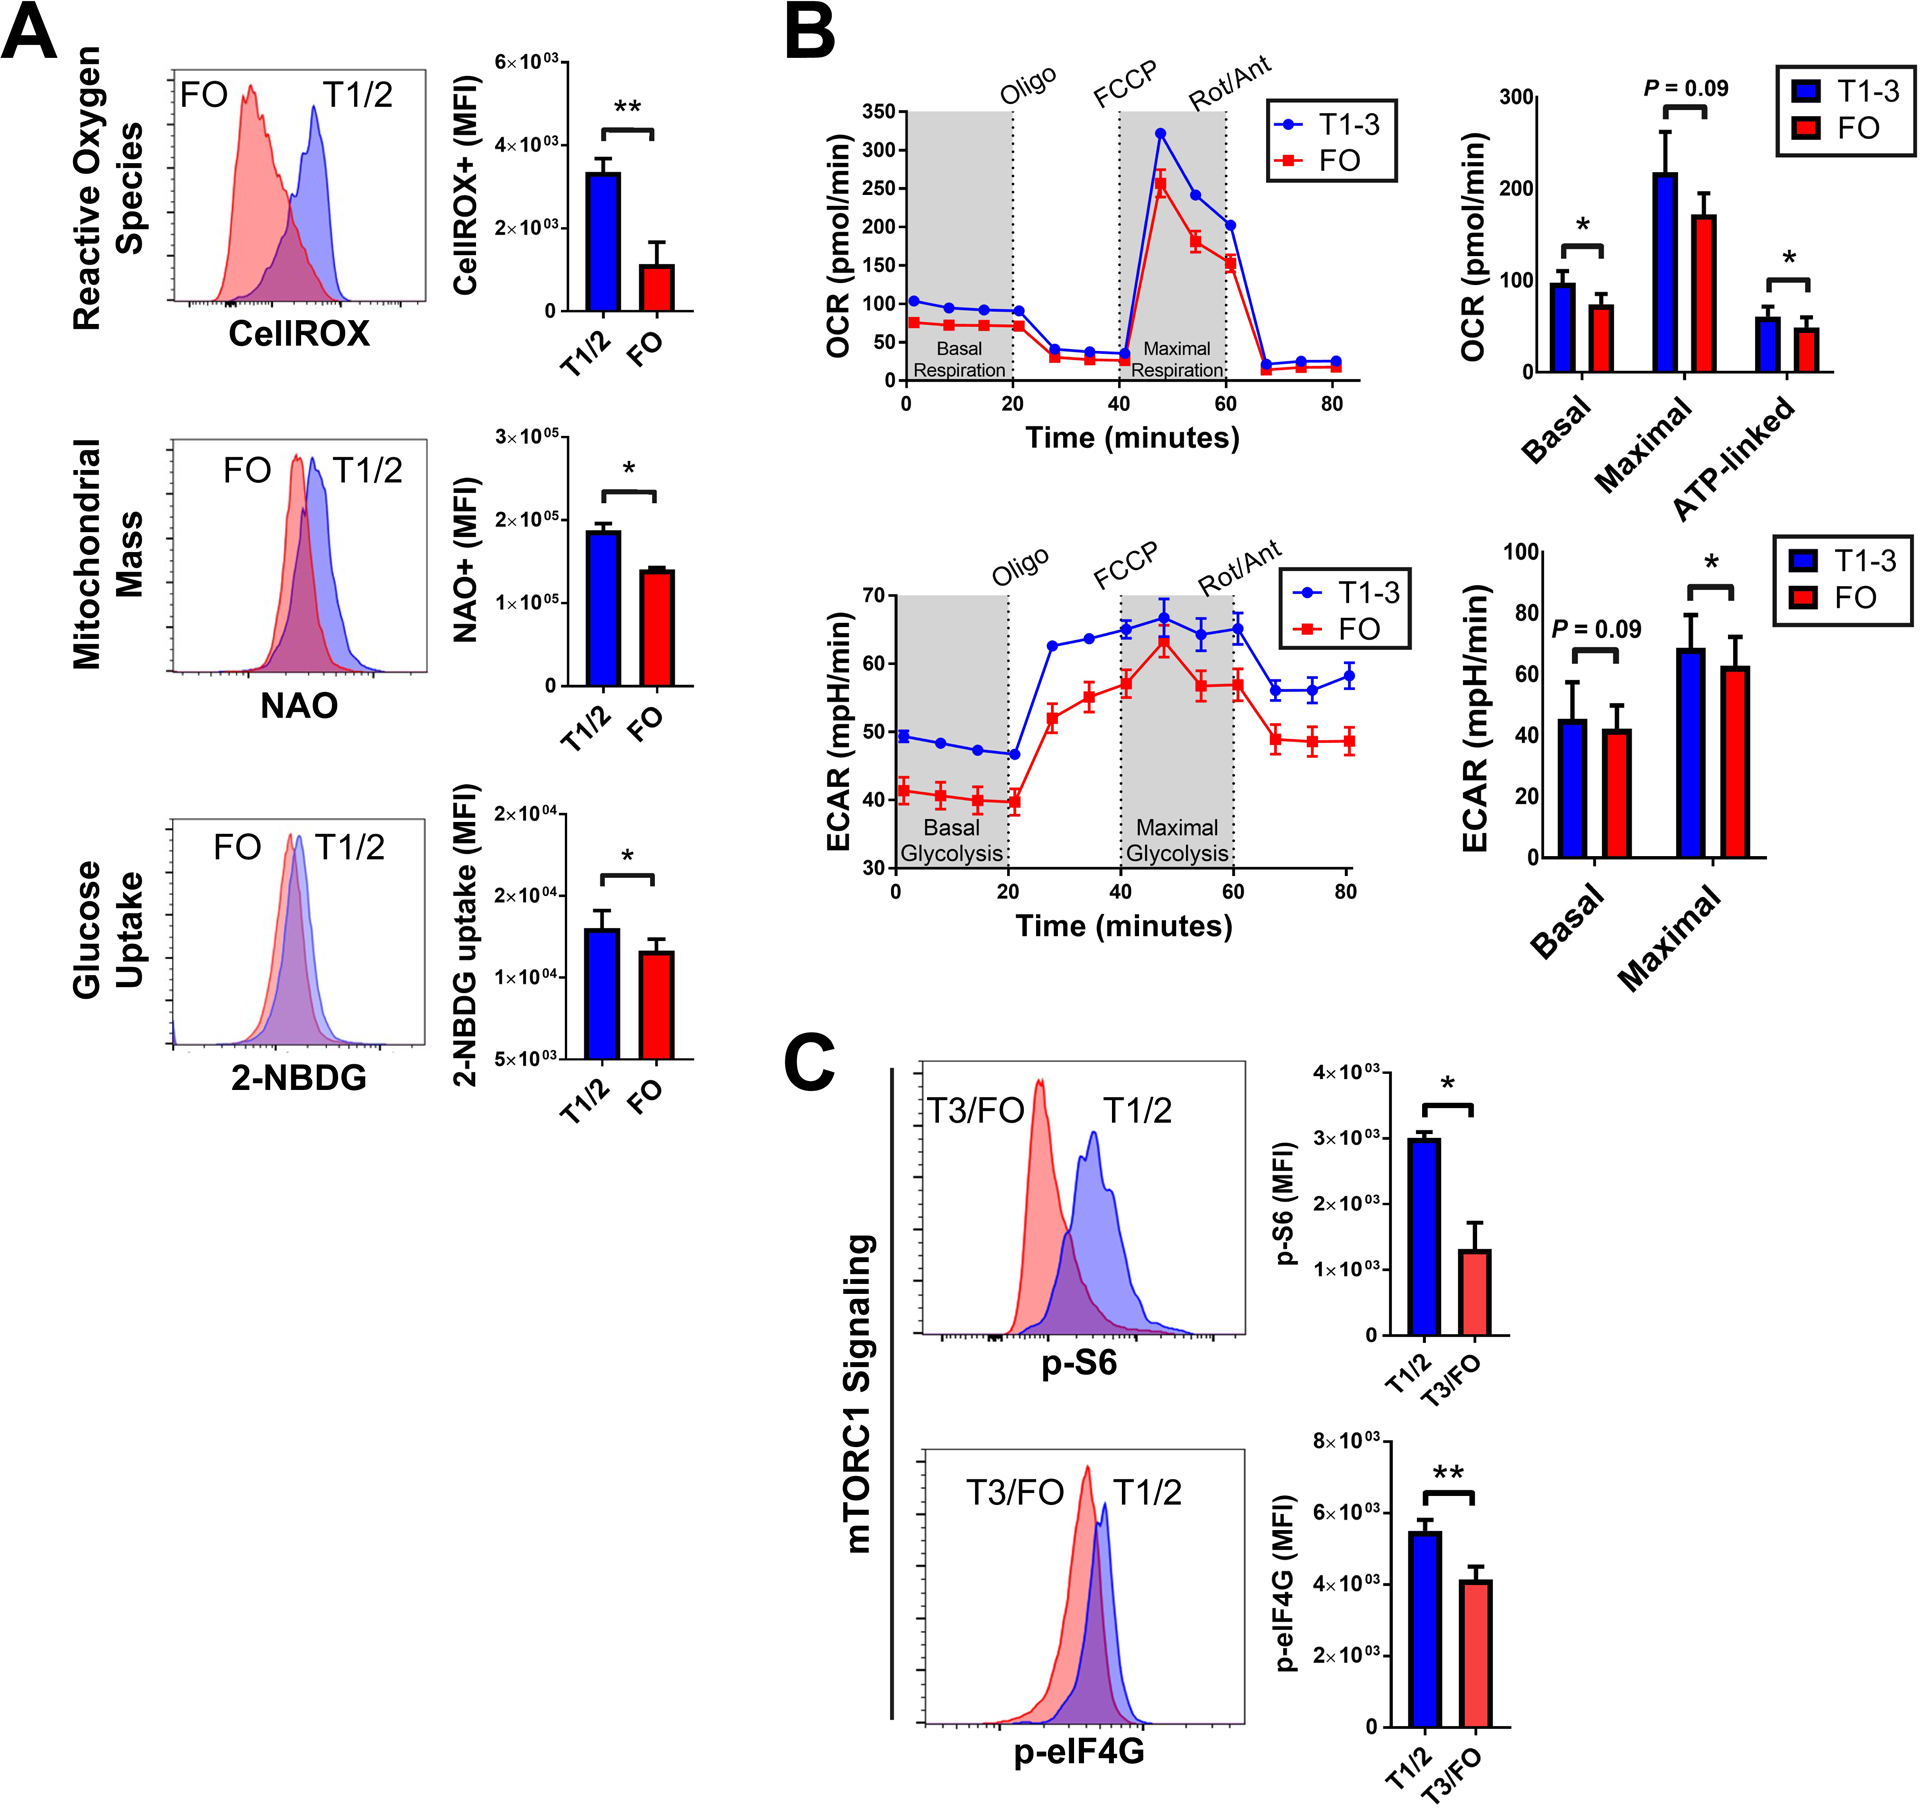
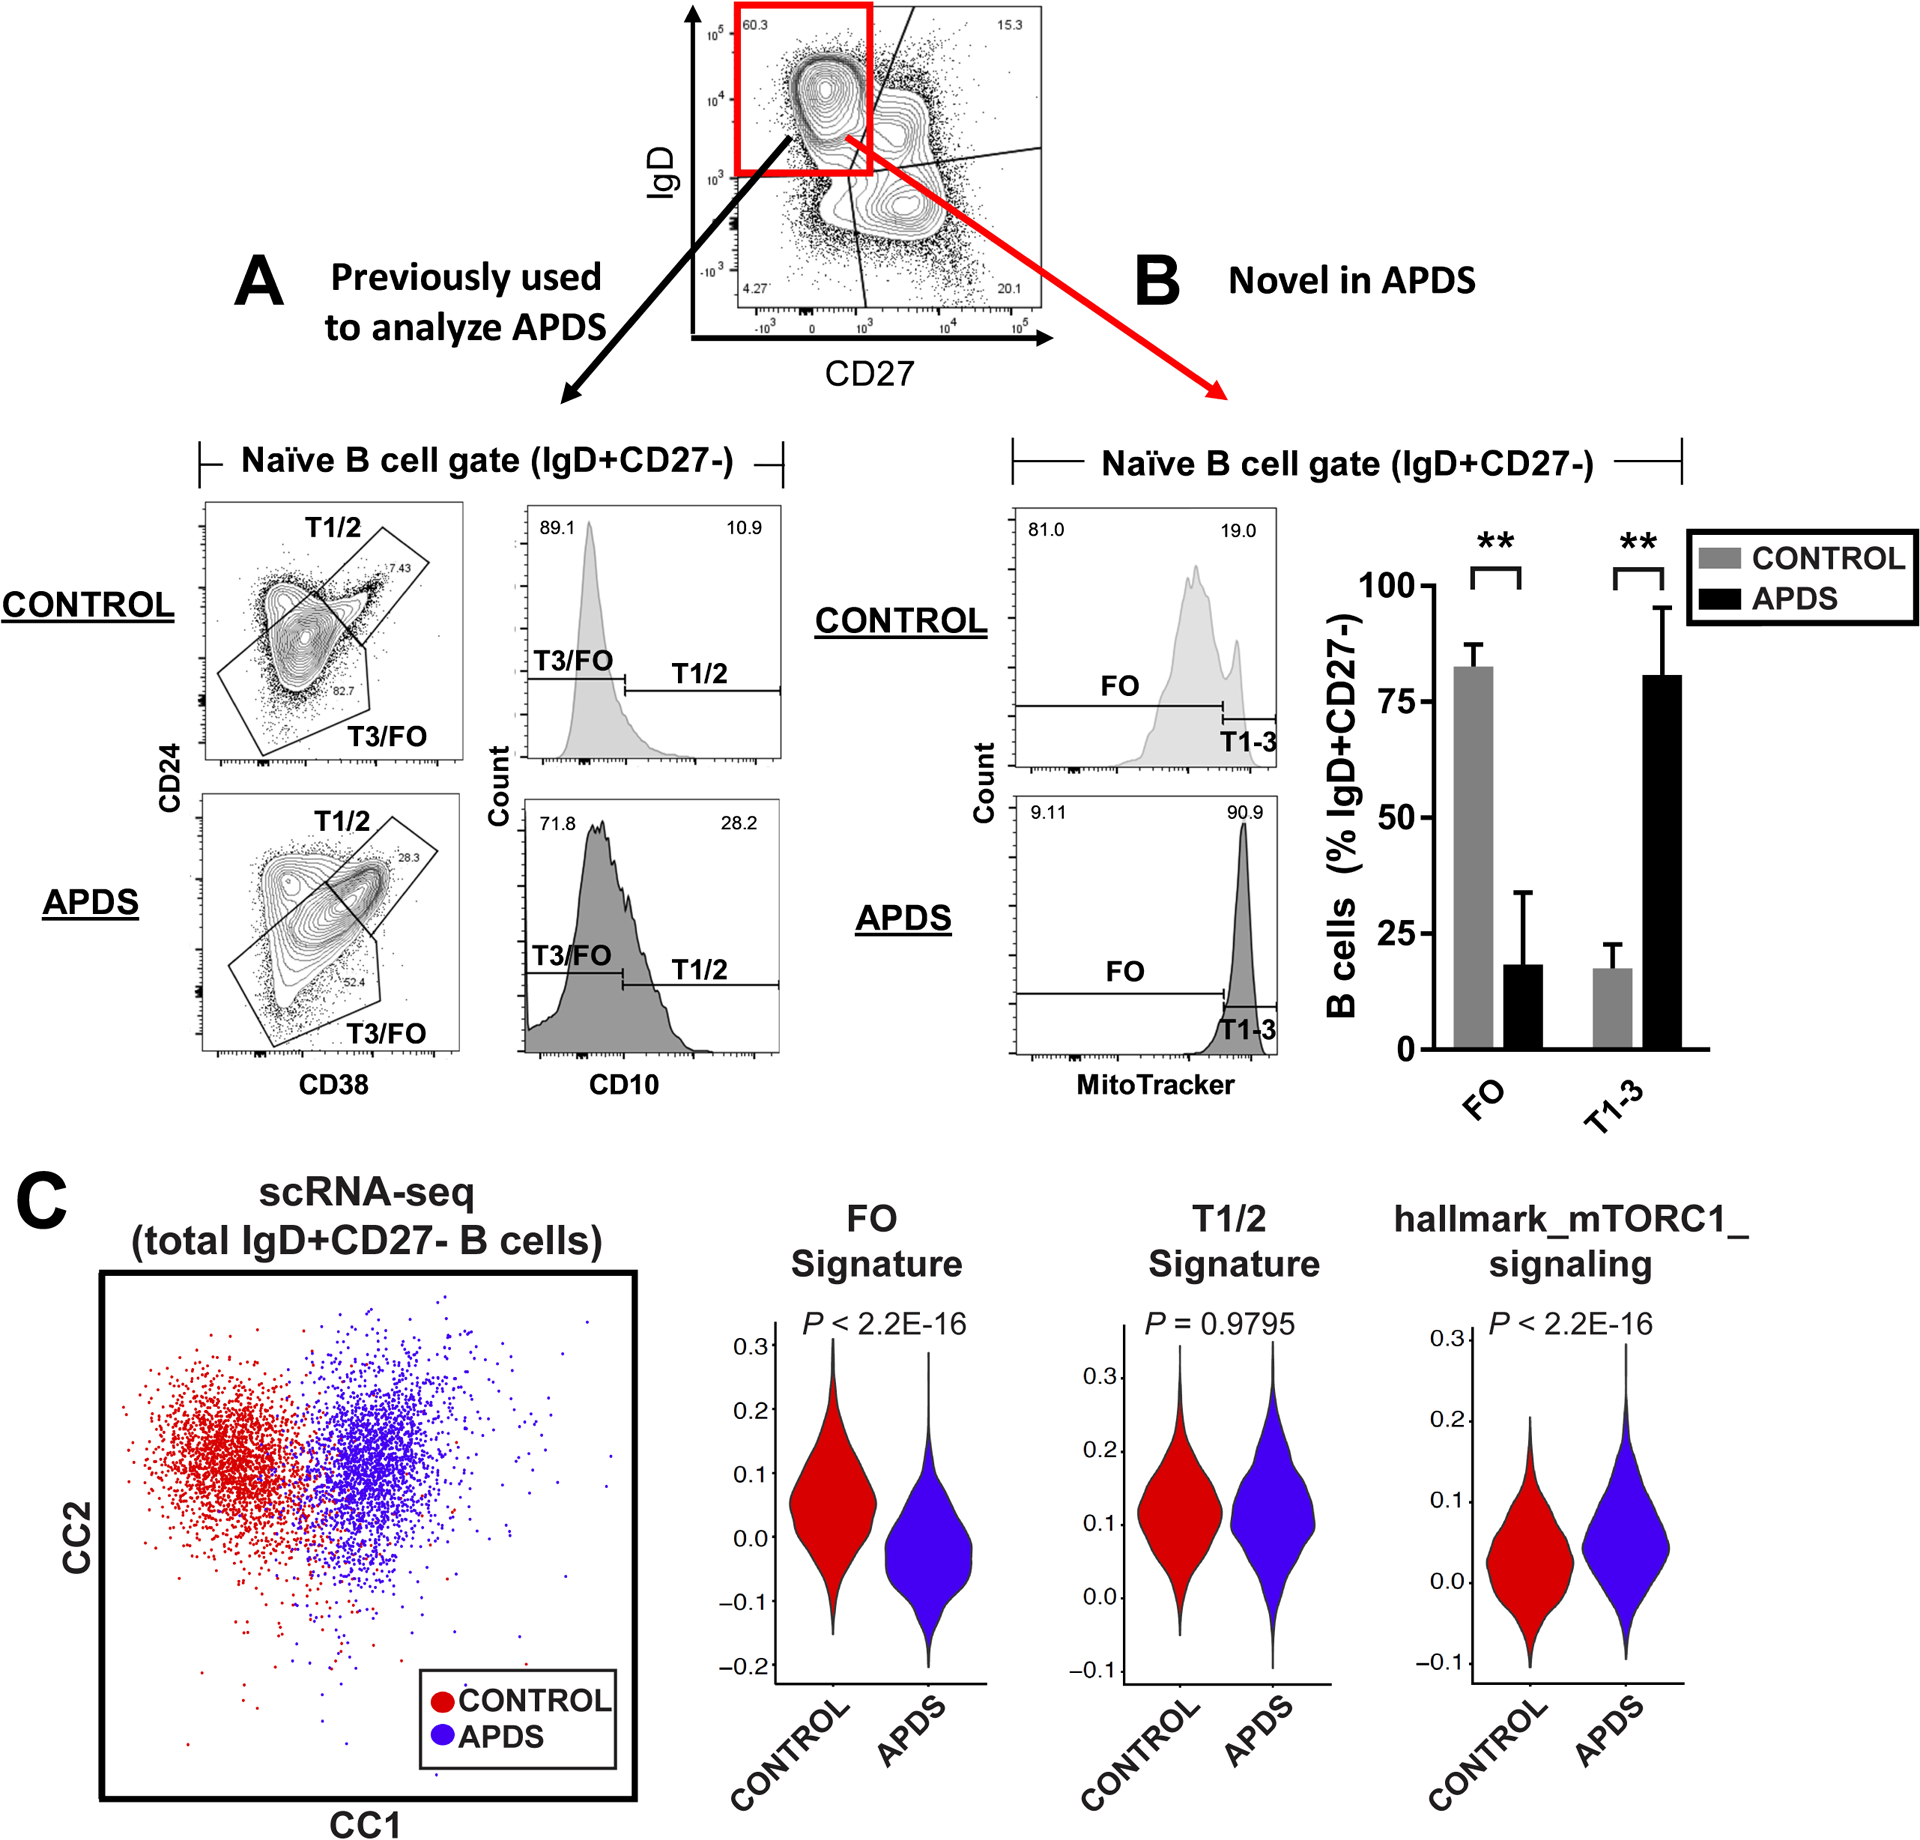
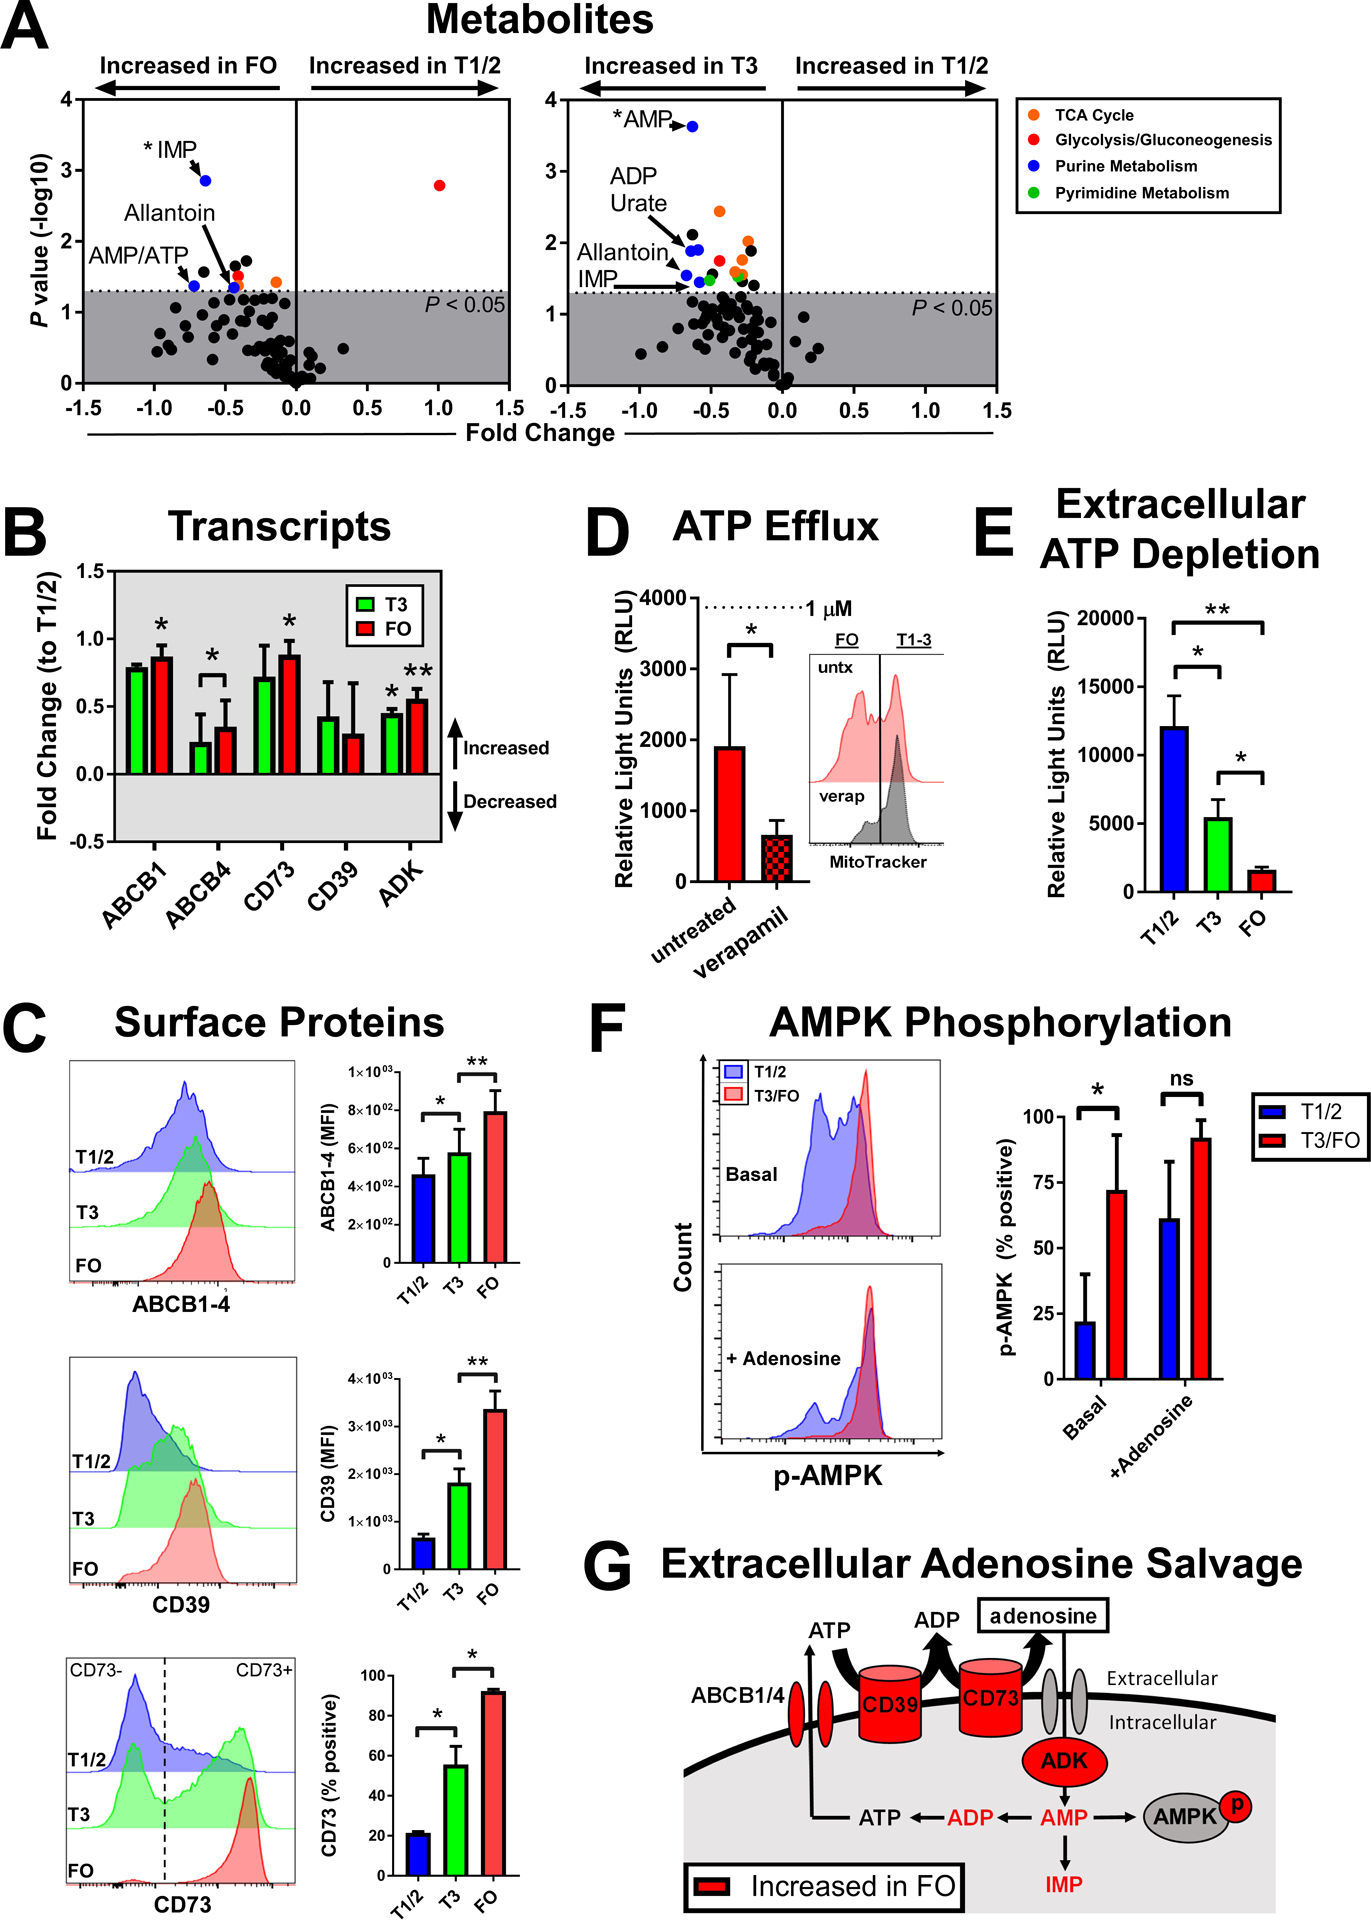
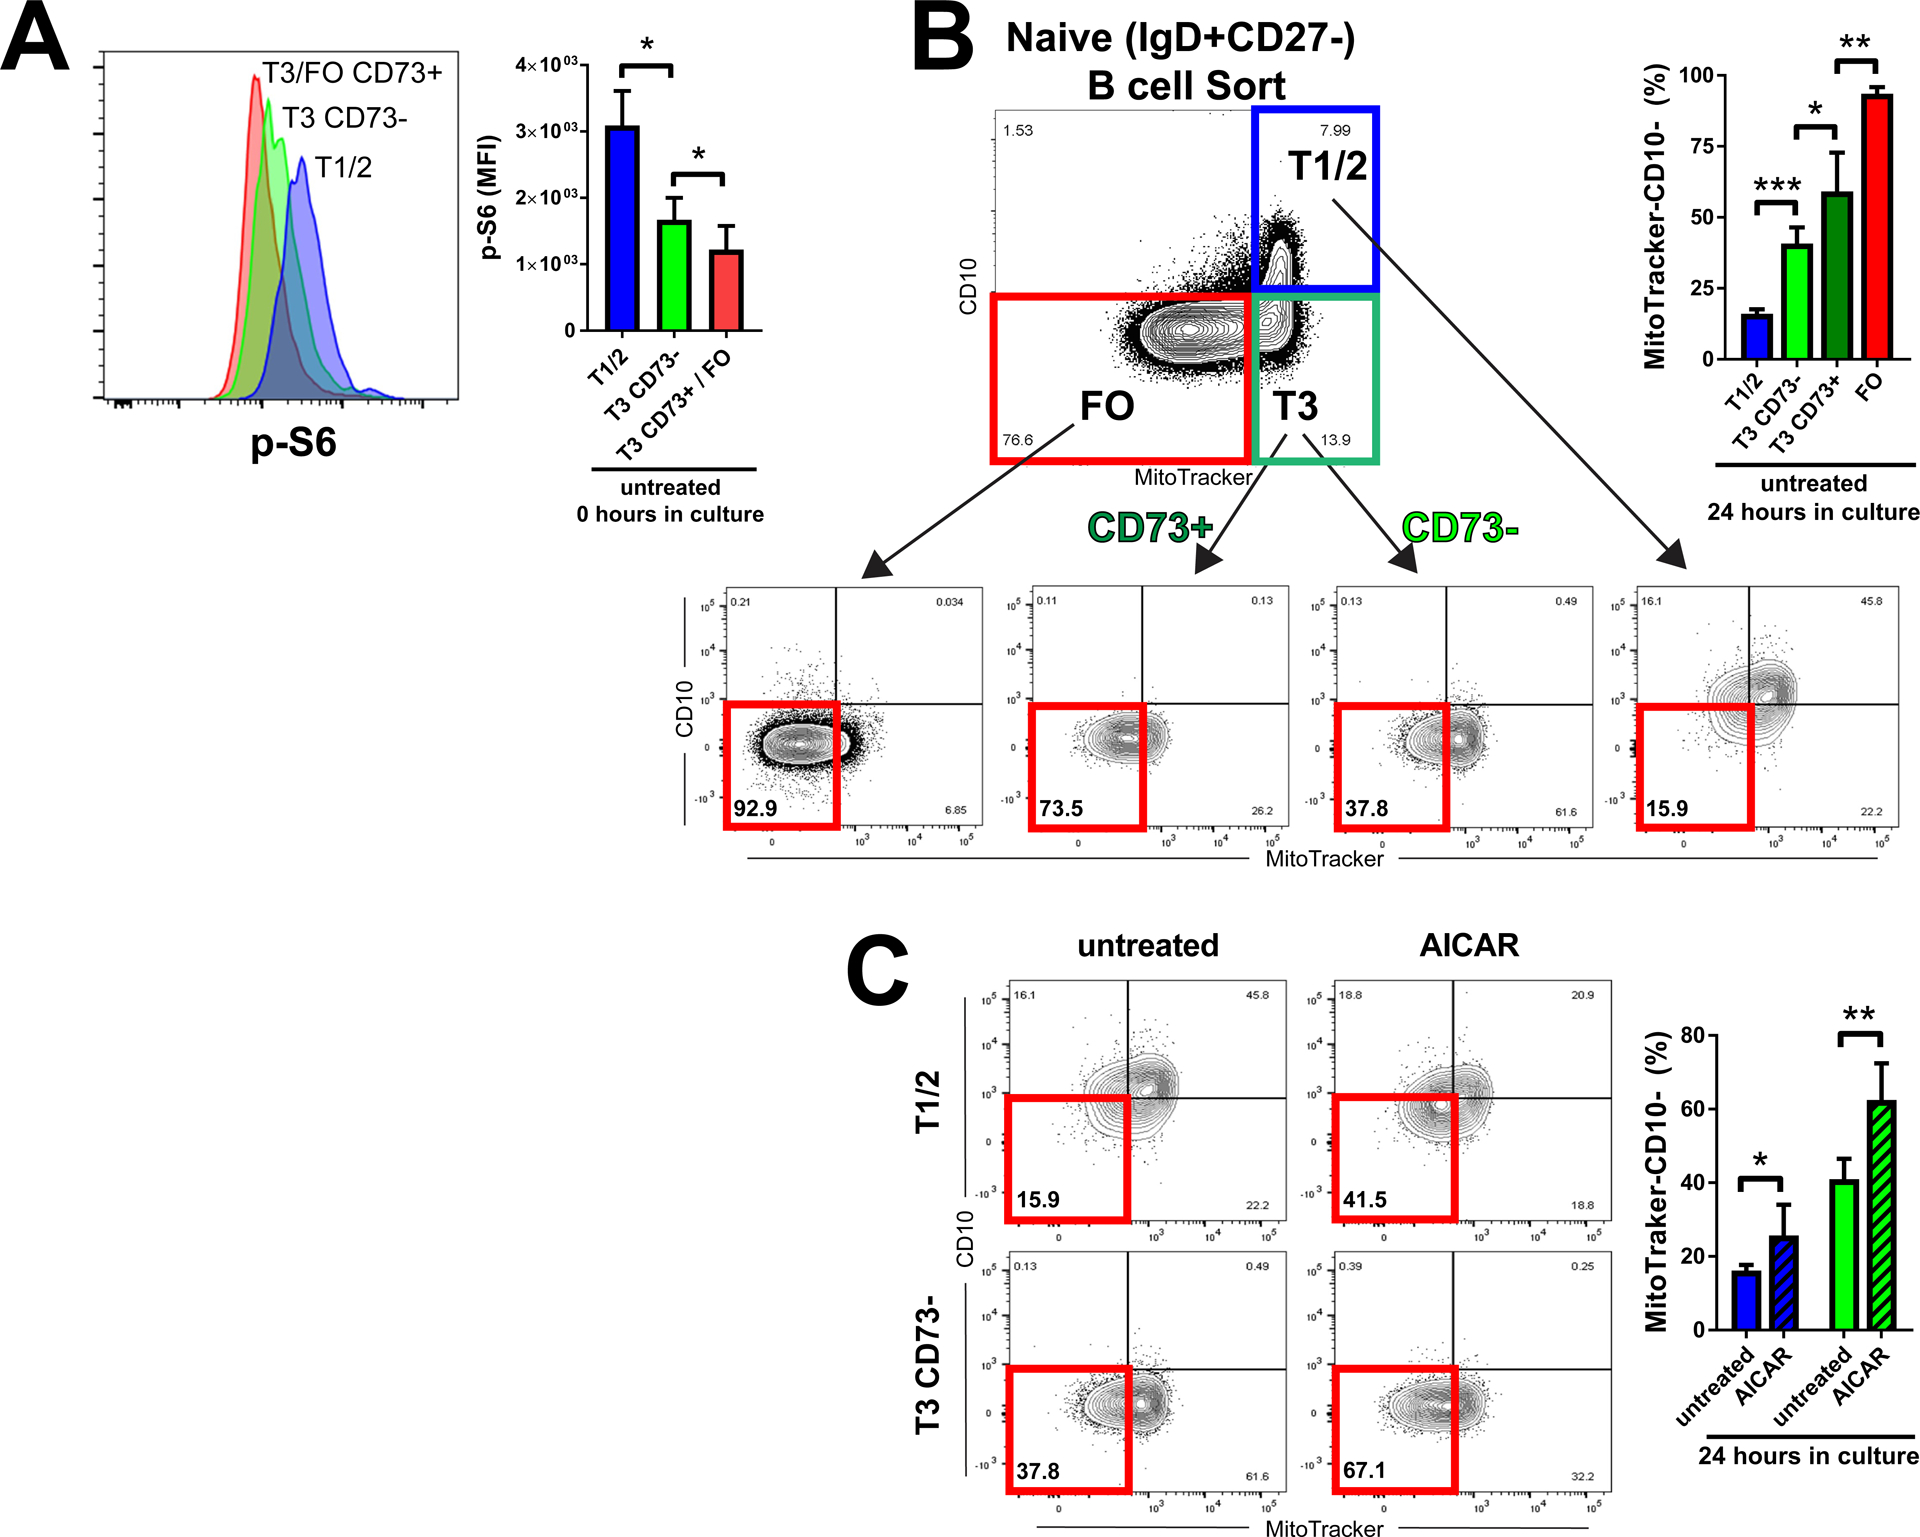
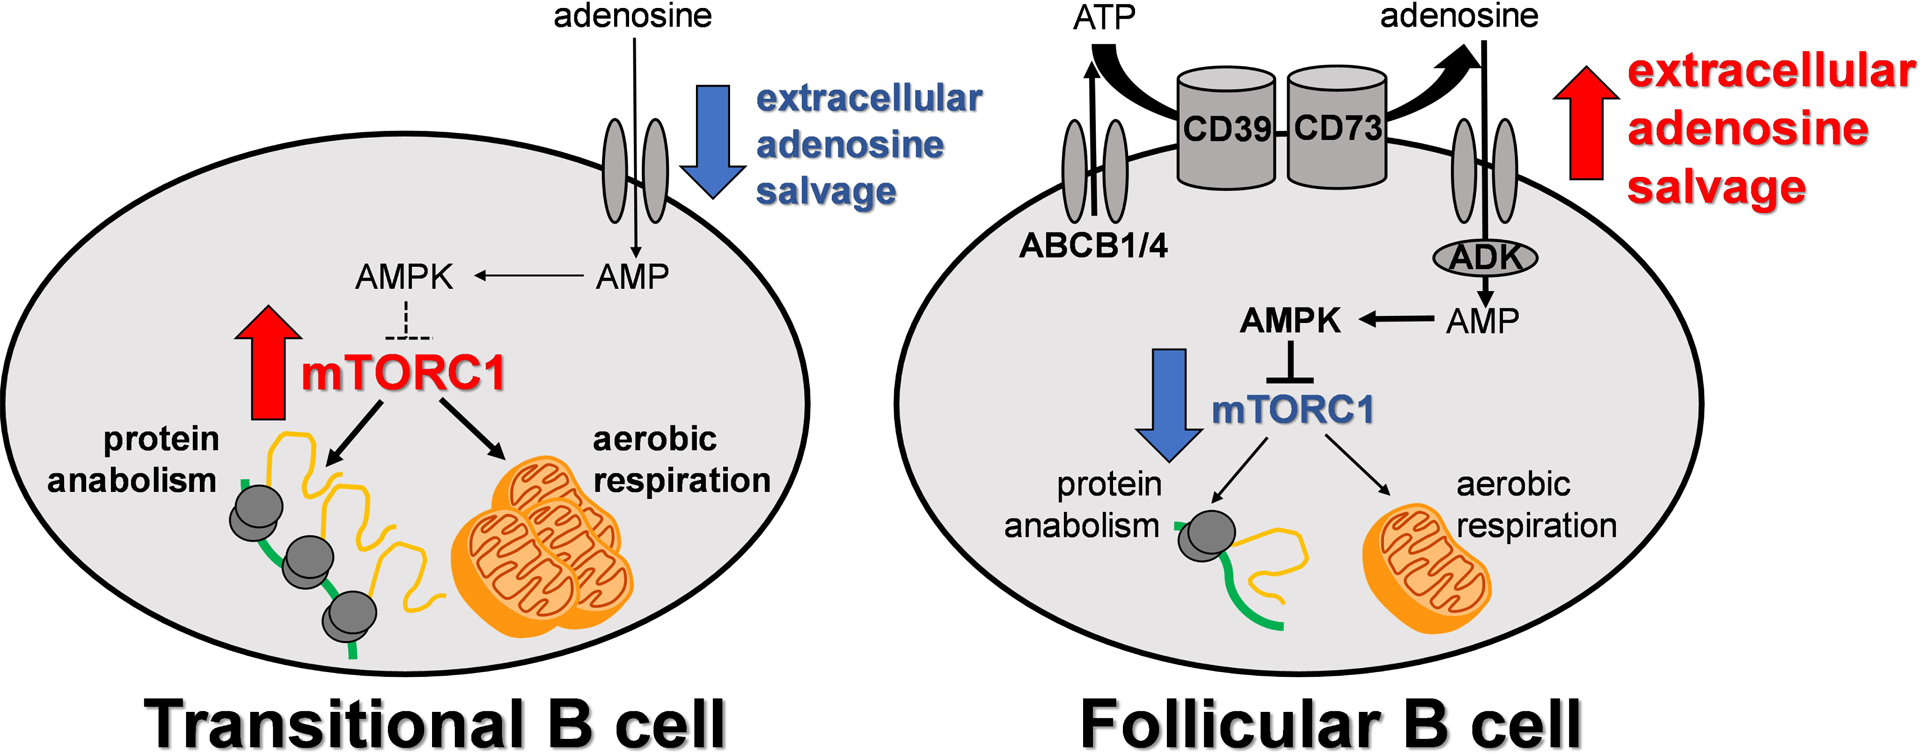
Transitional B cells must actively undergo selection for self-tolerance before maturing into their resting follicular B cell successors. We found that metabolic quiescence was acquired at the follicular B cell stage in both humans and mice. In follicular B cells, the expression of genes involved in ribosome biogenesis, aerobic respiration, and mammalian target of rapamycin complex 1 (mTORC1) signaling was reduced when compared to that in transitional B cells. Functional metabolism studies, profiling of whole-cell metabolites, and analysis of cell surface proteins in human B cells suggested that this transition was also associated with increased extracellular adenosine salvage. Follicular B cells increased the abundance of the cell surface ectonucleotidase CD73, which coincided with adenosine 5'-monophosphate-activated protein kinase (AMPK) activation. Differentiation to the follicular B cell stage in vitro correlated with surface acquisition of CD73 on human transitional B cells and was augmented with the AMPK agonist, AICAR. Last, individuals with gain-of-function PIK3CD (PI3Kδ) mutations and increased pS6 activation exhibited a near absence of circulating follicular B cells. Together, our data suggest that mTORC1 attenuation may be necessary for human follicular B cell development. These data identify a distinct metabolic switch during human B cell development at the transitional to follicular stages, which is characterized by an induction of extracellular adenosine salvage, AMPK activation, and the acquisition of metabolic quiescence.


Conflict of interest statement

Competing interests:

A.K.S. is a founder and on the scientific advisory board of Honeycomb Biotechnologies, which is developing Seq-Well arrays for commercial use. All other authors declare that they have no competing interests.

Figures

Fig. 1.
Fig. 1.. Expression of genes involved in protein anabolism, aerobic respiration, and mTORC1 signaling decreases with transitional to FO B cell maturation in humans and mouse.
Differentially expressed genes (DEGs) in sorted transitional (T1/2 and T3) and follicular (FO) B cells from human (A) and sorted transitional (T1, T2, and T3) and FO B cells from mouse (B). DEGs between B cell stages defined using empirical Bayes hierarchical modeling (53) (top) and shown in the predominant B cell maturation pattern as heatmap of gene expression by Z scores from three biological replicates for human (794 DEGs) and mouse (316 DEGs). Gene set enrichment (bottom) performed on all DEGs (901 in human and 528 in mouse) using an FDR-adjusted P value <0.01 to define significance. All top pathways of enrichment were in a pattern of decreased expression with B cell maturation (indicated by the black box) and are listed by term, P value, and enriched genes per pathway. All top GO and hallmark gene set enrichment pathways are listed in table S1.
Fig. 2.
Fig. 2.. Human FO B cells decrease aerobic respiration and mTORC1 signaling.
(A) Flow cytometry analysis of reactive oxygen species (top), mitochondrial mass (middle), and glucose uptake (bottom) in T1/2 (blue) and FO (red) B cells. Histograms (left) are representative of three biological replicates. Quantified data (right) are means +/− SD of three biological replicates. (B) Seahorse analysis of oxygen consumption rate (OCR, top) and extracellular acidification rate (ECAR, bottom) in sorted T1 to T3 (blue) and FO (red) B cells. Traces (left) are representative of three biological replicates. Quantified data (right) are means +/− SD of all data. (C) Flow cytometry analysis of pS6 and peIF4G in T1/2 (blue) and T3/FO (red) B cells. Histograms (left) are representative of three biological replicates. Quantified data (right) are means +/− SD of three biological replicates. *P < 0.05 and **P < 0.005 by paired Student’s t test. MFI, median fluorescence intensity.
Fig. 3.
Fig. 3.. Gain-of-function PIK3CD (PI3Kδ) mutations block FO B cell development and correlate with mTORC1 hyperactivation.
(A and B) Flow cytometry gating strategies for IgD+CD27− T1 to T3 and FO B cell subsets based on CD24, CD38, and CD10 abundance (A) or MitoTracker staining (B) in healthy controls or patients with activating PI3Kδ syndrome (APDS). Plots are representative of at least four biological replicates per group. Quantified data are means +/− SD of all samples. (C) Single-cell RNA sequencing (scRNA-seq) of total IgD+CD27− B cells in healthy controls (red) versus patients with APDS (blue). Cell clustering is shown by canonical correlation analysis (CCA) for two patients with APDS compared to controls (left) and, additionally, by t-SNE for a third patient with APDS compared to controls in fig. S7. Quantified data (right) are FO, T1/2, and mTORC1 signaling module scores shown by violin plot in control (n = 2314 IgD+CD27− B cells) versus APDS (n = 2385 IgD+CD27− B cells). ***P < 0.0001 by unpaired Student’s t test (B) or Wilcoxon rank sum test, as indicated (C).
Fig. 4.
Fig. 4.. Human FO B cells increase extracellular adenosine salvage and AMPK activation.
(A) Mass spectrometry analysis of metabolites from sorted T1/2, T3, and FO B cells. Volcano plots of substrates enriched in the indicated pathways (colored) are from four biological replicates. (B) RNA-seq analysis of transcripts involved in extracellular salvage from sorted T1/2, T3, and FO B cells shown as fold change means +/− SD to T1/2 from three biological replicates. (C) Flow cytometry analysis of cell surface proteins involved in extracellular adenosine salvage in T1/2, T3, and FO B cells. Histograms are representative of three biological replicates. Quantified data are means +/− SD of three biological replicates. (D) Luciferase reporter assay of ATP efflux in sorted FO B cells at 1 hour after treatment with the pan-ABC transport inhibitor verapamil as indicated. Histogram of MitoTracker efflux (right) is representative of three biological replicates. Quantified data (left) are means +/− SD from ≥3 biological replicates per group. (E) Luciferase reporter assay of extracellular ATP depletion in sorted T1/2, T3, and FO B cells at 5 hours after ATP treatment. (F) AMPK activation by phospho–flow cytometry amounts in T1/2 versus T3/FO B cells. Histograms (left) are representative of three biological replicates per group. Quantified data (right) are means +/− SD from three biological replicates per group. (G) Schematic of changes in the extracellular adenosine salvage pathway that correlate with B cell maturation to FO (red). *P < 0.05 and **P < 0.005 by FDR-adjusted (A) or paired Student’s t test (B to F). ns, not significant.
Fig. 5.
Fig. 5.. Human transitional to FO B cell differentiation in vitro correlates with acquisition of cell surface CD73 and can be augmented by AMPK agonism.
(A) Basal phospho–flow cytometry amounts of pS6 in transitional (T1/2 and T3) and FO B cell subsets, further delineated by cell surface amounts of CD73, as indicated. Histograms (left) are representative of three biological replicates. Quantified data (right) are means +/− SD of three biological replicates. (B and C) In vitro differentiation of sorted transitional (T1/2 and T3) and FO B cell subsets, further delineated by cell surface amounts of CD73, as indicated, and either left untreated (B) or treated with the AMPK agonist, AICAR (C). Differentiation to FO (Mitotracker-CD10−) assessed at 24 hours in culture. Plots (left) are representative of six biological replicates per group. Quantified data (right) are means +/− SD of all data. *P < 0.05, **P < 0.005, and ***P < 0.0001 by unpaired Student’s t test.
Fig. 6.
Fig. 6.. Increased extracellular adenosine salvage and decreased mTORC1 signaling mark the transitional to FO B cell switch in humans.
Schematic of maturation-dependent changes in human B cell metabolism.

References

    1. Nutt SL, Kee BL, The transcriptional regulation of B cell lineage commitment. Immunity 26, 715–725 (2007). - PubMed
    1. Recaldin T, Fear DJ, Transcription factors regulating B cell fate in the germinal centre. Clin. Exp. Immunol 183, 65–75 (2016). - PMC - PubMed
    1. Cho SH, Raybuck AL, Stengel K, Wei M, Beck TC, Volanakis E, Thomas JW, Hiebert S, Haase VH, Boothby MR, Germinal centre hypoxia and regulation of antibody qualities by a hypoxia response system. Nature 537, 234–238 (2016). - PMC - PubMed
    1. Abbott RK, Thayer M, Labuda J, Silva M, Philbrook P, Cain DW, Kojima H, Hatfield S, Sethumadhavan S, Ohta A, Reinherz EL, Kelsoe G, Sitkovsky M, Germinal center hypoxia potentiates immunoglobulin class switch recombination. J. Immunol 197, 4014–4020 (2016). - PMC - PubMed
    1. Jellusova J, Cato MH, Apgar JR, Ramezani-Rad P, Leung CR, Chen C, Richardson AD, Conner EM, Benschop RJ, Woodgett JR, Rickert RC, Gsk3 is a metabolic checkpoint regulator in B cells. Nat. Immunol 18, 303–312 (2017). - PMC - PubMed

Publication types

MeSH terms