. 2019 Oct 22;10(11):802.
doi: 10.1038/s41419-019-2036-9.

Mitochondrial 3243A > G mutation confers pro-atherogenic and pro-inflammatory properties in MELAS iPS derived endothelial cells

Affiliations

Mitochondrial 3243A > G mutation confers pro-atherogenic and pro-inflammatory properties in MELAS iPS derived endothelial cells

Nicole Min Qian Pek et al. Cell Death Dis. .

Abstract

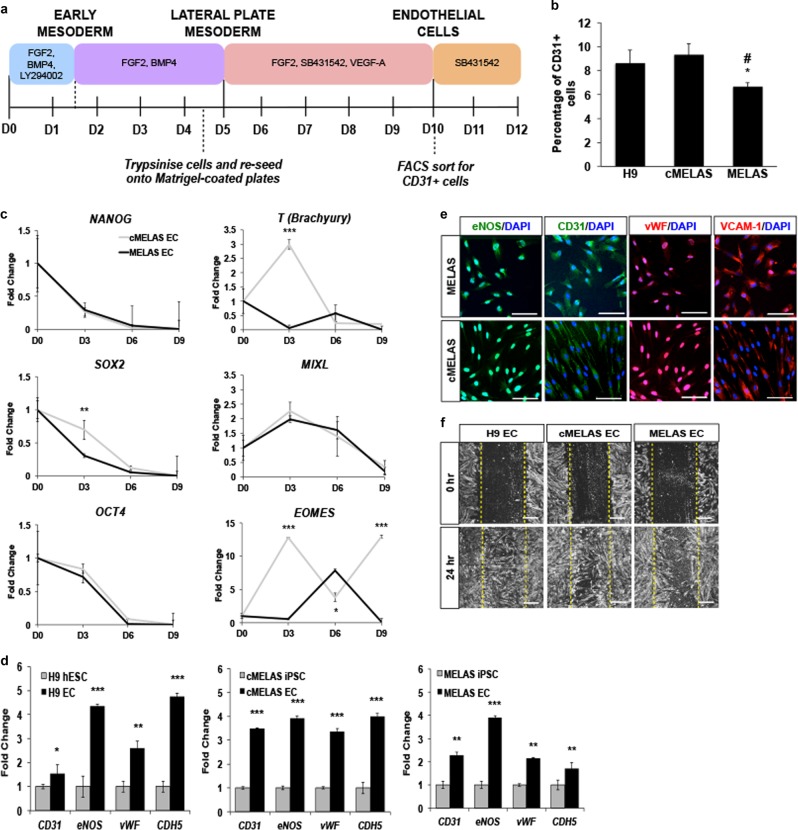
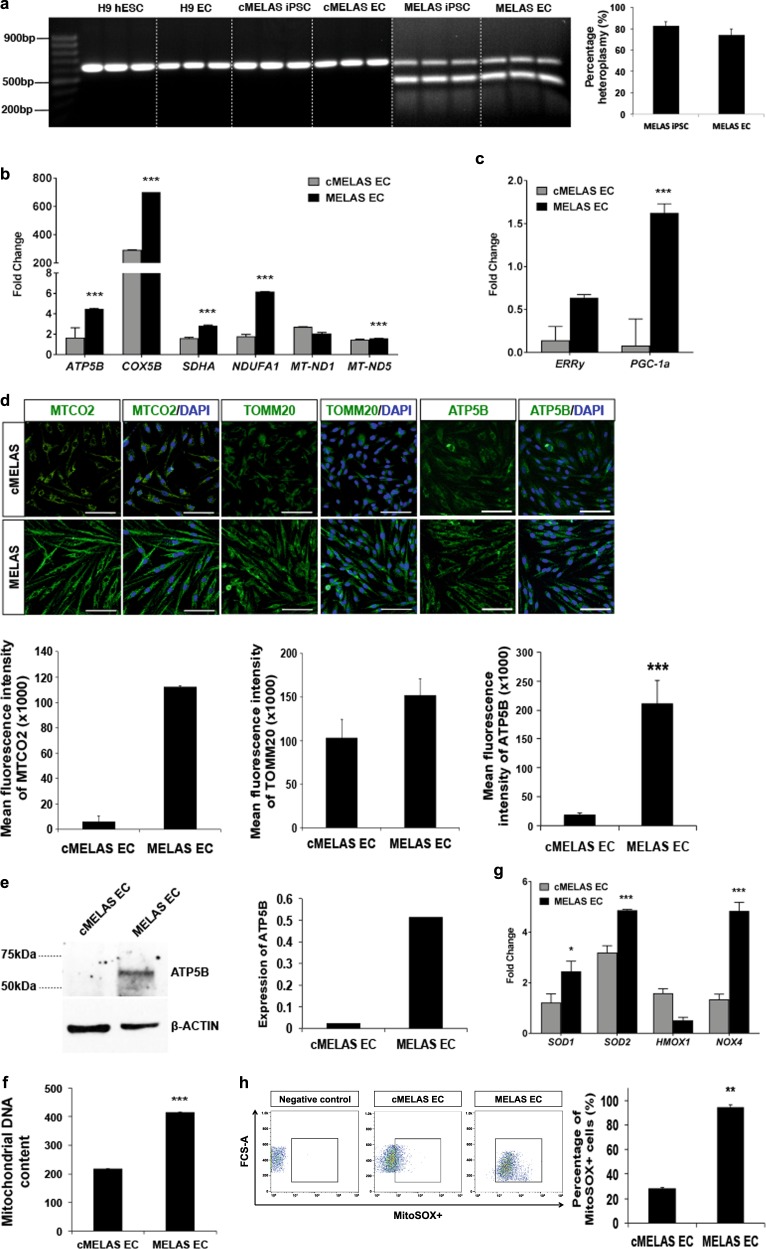
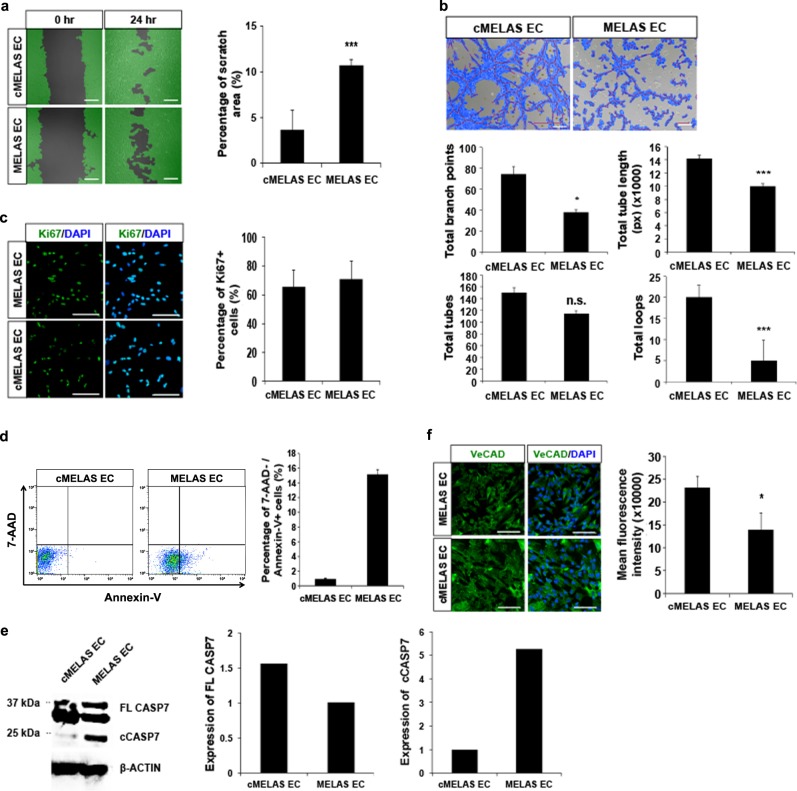
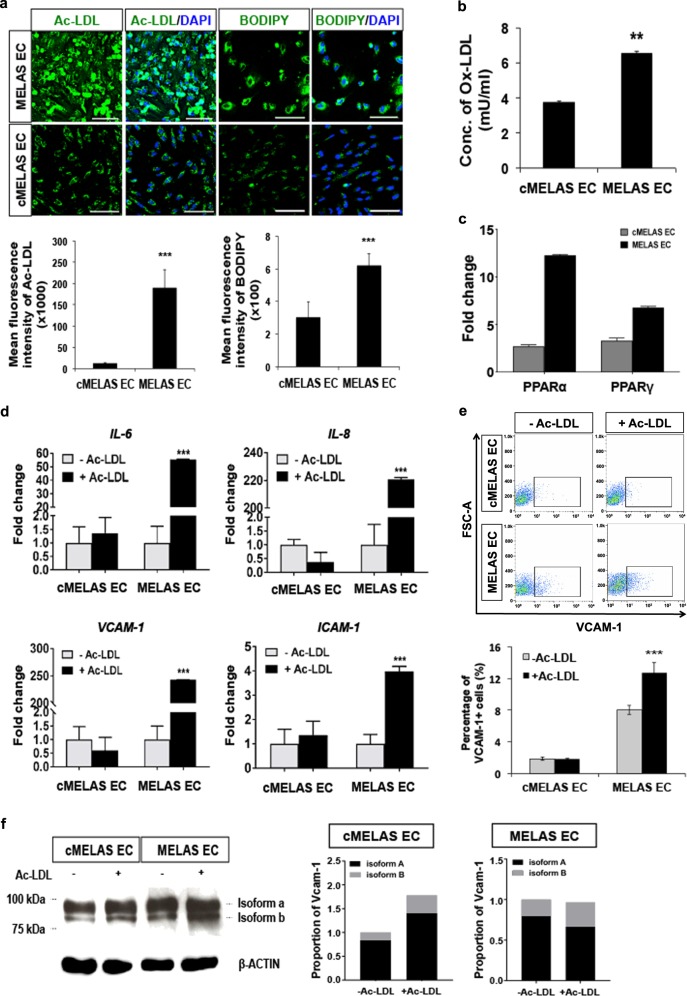
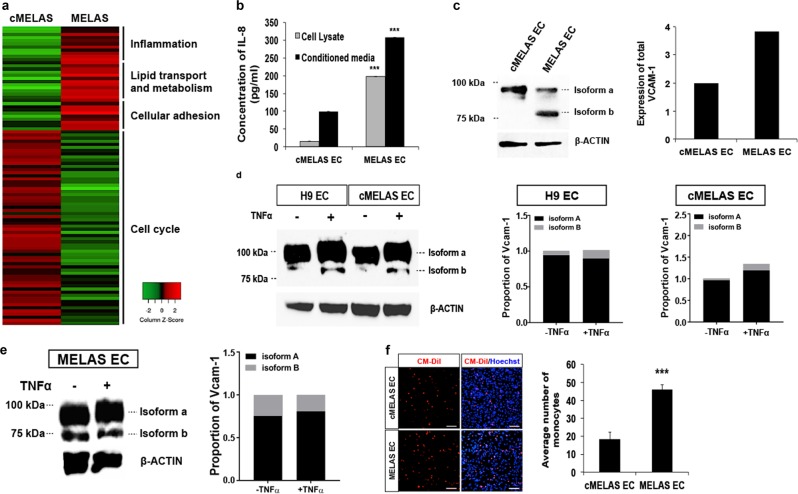
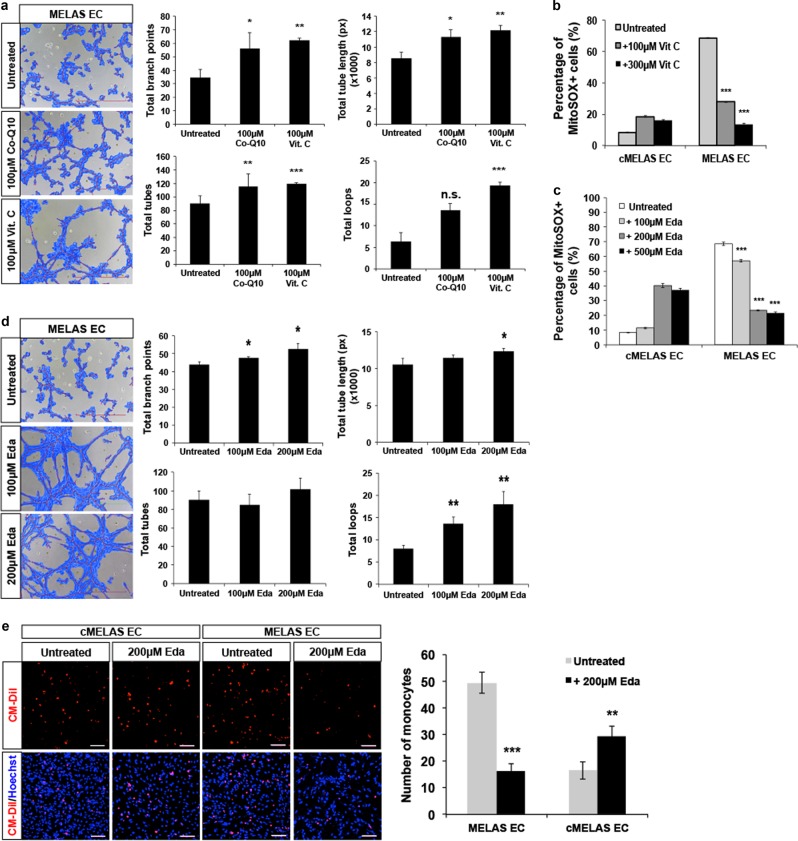
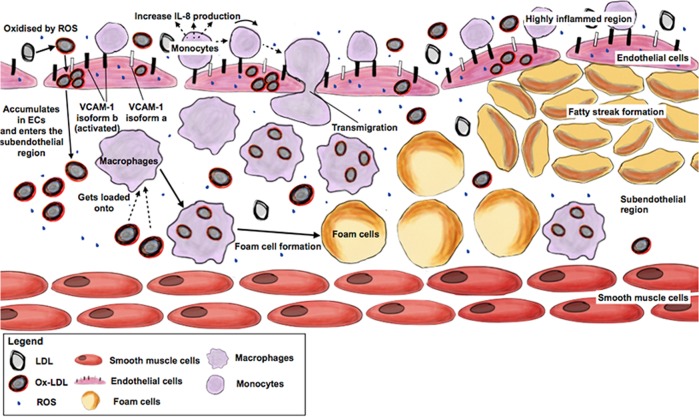
Mitochondrial encephalomyopathy, lactic acidosis, and stroke-like episodes (MELAS) syndrome is a mitochondrial disorder that is commonly caused by the m.3243A > G mutation in the MT-TL1 gene encoding for mitochondrial tRNA(Leu(UUR)). While clinical studies reported cerebral infarcts, atherosclerotic lesions, and altered vasculature and stroke-like episodes (SLE) in MELAS patients, it remains unclear how this mutation causes the onset and subsequent progression of the disease. Here, we report that in addition to endothelial dysfunction, diseased endothelial cells (ECs) were found to be pro-atherogenic and pro-inflammation due to high levels of ROS and Ox-LDLs, and high basal expressions of VCAM-1, in particular isoform b, respectively. Consistently, more monocytes were found to adhere to MELAS ECs as compared to the isogenic control, suggesting the presence of an atherosclerosis-like pathology in MELAS. Notably, these disease phenotypes in endothelial cells can be effectively reversed by anti-oxidant treatment suggesting that the lowering of ROS is critical for treating patients with MELAS syndrome.


Conflict of interest statement

The authors declare that they have no conflict of interest.

Figures

Fig. 1
Fig. 1. MELAS iPSCs have reduced efficiency to differentiate into ECs.
a Schematic diagram illustrating the differentiation protocol utilised to generate ECs from hPSCs. On day 10, cells expressing CD31 would be isolated for further expansion. b Flow cytometry analysis of CD31+ ECs. There were lower percentage of CD31+ ECs in cells differentiated from MELAS iPSCs as compared to WT and isogenic control. c Time-course expression analysis of pluripotent genes (NANOG, SOX2 and OCT4) and mesodermal genes (T, MIXL and EOMES) showed lower expression of T and EOMES at day 3 of MELAS EC differentiation. d Expression of specific EC gene markers CD31, eNOS, vWF and CDH5 in CD31+ cells were significantly higher than the respective hPSCs. Data are represented as fold-change normalised to β-ACTIN. e Representative images of eNOS, CD31, vWF and VCAM-1 staining in cMELAS and MELAS ECs. Nuclei were stained in blue with DAPI. Scale bar = 100 μm. f Scratch assay performed using ECs derived from H9, cMELAS and MELAS iPSCs. The ability to migrate to the scratch area after 24 h showed the functionality in these ECs. Error bars show SD of the mean. *p < 0.05, **p < 0.01, ***p < 0.001
Fig. 2
Fig. 2. MELAS ECs recapitulate mitochondrial aberrations associated with m.3243 A > G mutation.
a RFLP analysis of the m.3243 locus of the MT-TL1 genes in MELAS iPSC and MELAS ECs showed high levels of m.3243A> G heteroplasmy while m.3243A > G mutant mtDNAs were absent in the WT and isogenic controls. Percentage of heteroplasmy between MELAS iPSC and MELAS ECs was non-significant. b Quantitative-PCR analysis demonstrates up-regulation of mitochondria OX-PHOS genes in MELAS ECs. Data are represented as fold-change normalised to β-ACTIN. c Quantitative-PCR analysis demonstrates up-regulation of mitochondria biogenesis genes in MELAS ECs. Data are represented as fold-change normalised to β-ACTIN. d Representative images of MTCO2, ATP5B and TOMM20 immunostaining in cMELAS and MELAS ECs. Nuclei were stained in blue with DAPI. Scale bar = 100 μm. The graph shows increased mean fluorescence intensity of MTCO2, ATP5B and TOMM20 in MELAS EC. e Western blot and densitometric analysis shows higher ATP5B protein expression in MELAS ECs as compared to cMELAS ECs. f Mitochondrial DNA content which is determined by normalising mtDNA to nuclear DNA copy number was found to be significantly higher in MELAS ECs as compared to the control. g Quantitative-PCR analysis demonstrates up-regulation of oxidative stress-related genes in MELAS ECs. Data are represented as fold-change normalised to β-ACTIN. h Mitochondrial superoxide production was detected with MitoSOX with FACS sorting. Flow analysis demonstrates higher percentage of MELAS ECs cells producing mitochondrial superoxide as compared to cMELAS ECs. Error bars show SD of the mean. **p < 0.01, ***p < 0.001. n.s., not significant
Fig. 3
Fig. 3. MELAS ECs exhibit functional defects.
a Scratch wound healing assays was performed on cMELAS and MELAS ECs. After 24 h, scratch area of MELAS ECs was observed to remained larger than the control, suggesting inefficient migration in MELAS ECs. Graphical representation illustrates the percentage of scratch area left after 24 h. b Tube formation assay was performed on cMELAS and MELAS ECs. Representative images demonstrate reduced tube formation in MELAS ECs. Quantitative analysis of several tube formation parameters showed overall poorer tube formation capacity of MELAS ECs. c Representative images of Ki67 immunostaining in cMELAS and MELAS ECs. Nuclei were stained in blue with DAPI. Scale bar = 100 μm. No distinct changes in percentage of Ki67 + cells between control and MELAS ECs (n > 100). d Flow analysis of Annexin-V showed higher percentage of MELAS ECs that were undergoing apoptosis. e Western blot and densitometric analysis shows higher levels of cleaved CASP7 protein expression in MELAS ECs as compared to cMELAS ECs. Expression of cleaved CASP7 was quantified and normalised to loading control β-ACTIN. f Representative images of cMELAS and MELAS ECs stained with VeCAD. Nuclei were stained in blue with DAPI. Scale bar = 100 μm. Quantification of mean fluorescence intensity illustrates MELAS ECs expressed lower levels of VeCAD protein. Error bars show SD of the mean. *p < 0.05, ***p < 0.001
Fig. 4
Fig. 4. Evidence of dyslipidemia and LDL-induced inflammatory responses in MELAS ECs.
a Representative images of Ac-LDL and BODIPY staining in cMELAS and MELAS ECs. Nuclei were stained in blue with DAPI. Scale bar = 100 μm. Quantification of mean fluorescence from n > 100 cells illustrated an increase in Ac-LDL and neutral lipids in MELAS ECs as compared to cMELAS ECs. b ELISA analysis showed higher level of ox-LDL detected in cell lysate of MELAS ECs. c Quantitative-PCR analysis illustrated increased mRNA transcripts expression of both PPARα and PPARγ in MELAS ECs as compared to the isogenic control. Data are represented as fold-change normalised to β-ACTIN. d Quantitative-PCR analysis demonstrated up-regulation of inflammatory markers ICAM-1, VCAM-1, IL-8 and IL-6 in MELAS ECs upon Ac-LDL treatment. Data are represented as fold-change normalised to β-ACTIN. e Flow cytometric analysis of VCAM-1 showed that Ac-LDL treatment resulted in more VCAM-1 + cells in MELAS ECs than the control. f Western blot and densitometric analysis showed higher levels of VCAM-1 isoform b protein expression in MELAS ECs as compared to cMELAS ECs after Ac-LDL treatment. Expression of VCAM-1 isoforms was quantified and normalised to loading control β-ACTIN. Error bars show SD of the mean. **p < 0.01, ***p < 0.001
Fig. 5
Fig. 5. Dysregulated inflammatory responses were observed in MELAS ECs.
a Gene ontology enrichment analysis revealed gene clusters that are differentially expressed between MELAS ECs and cMELAS ECs. b ELISA analysis demonstrated higher levels of IL-8 detected in the conditioned media and cell lysate of MELAS ECs. c Western blot and densitometric analysis showed presence of VCAM-1 isoform b protein expression in MELAS ECs as compared to cMELAS ECs. Expression of total VCAM-1 were quantified and normalised to loading control β-ACTIN. d Western blot and densitometric analysis showed elevated levels of VCAM-1 isoform b expressions in control ECs upon TNFα treatment. Expression of VCAM-1 isoforms were quantified and normalised to loading control β-ACTIN. e Western blot and densitometric analysis showed no further increase in VCAM-1 isoform b expression level when MELAS ECs were treated with TNFα. f Monocyte adhesion assay was performed and demonstrated significantly more monocytes attached to MELAS ECs as compared to the isogenic control. Nuclei were stained in blue with DAPI. Scale bar = 100 μm. Error bars show SD of the mean. ***p < 0.001
Fig. 6
Fig. 6. Anti-oxidant treatments were successful in improving endothelial functions.
a Representative images of tubes formed by MELAS ECs pre-treated with 100 μM Vit. C and 100 μM Co-Q10. Quantitative analysis of several tube formation parameters showed improvements in tube formation capacity after MELAS ECs were treated with the compounds. b 100 μM Vit. C treatment was effective in reducing the number of MitoSOX+ cells in MELAS ECs. c Increasing doses of edaravone was effective in reducing MitoSOX+ cells in MELAS ECs in a dose-dependent manner. d Representative images of tubes formed by MELAS ECs treated with 100 μM and 200 μM of edaravone. Quantitative analysis of several tube formation parameters showed improvements in tube formation capacity after MELAS ECs were treated with both doses of edaravone. e MELAS ECs treated with 200 μM of edaravone effectively lowered number of monocytes adhering to MELAS ECs when monocytes adhesion assay was performed. Nuclei were stained in blue with DAPI. Scale bar = 100 μm. Error bars show SD of the mean. *p < 0.05, **p < 0.01, ***p < 0.001
Fig. 7
Fig. 7. Schematic diagram summarising atherogenesis in the vasculature of MELAS patients. LDL gets oxidised to form ox-LDL by high levels of ROS in the environment.
High levels of ox-LDL will be produced overtime and will accumulate in the ECs and subsequently, enters the sub-endothelial space. In tandem, monocytes in circulation attaches to activated ECs and become macrophages. High expression of ‘pro-adhesive’ VCAM-1 in these activated ECs promotes more monocytes to adhere to the endothelium. Large numbers of monocytes and macrophages creates a pro-inflammatory niche characterised by higher expression of chemokine IL-8. These macrophages then transmigrate into the sub-endothelial space where they are loaded with pathological levels of ox-LDL. Because of high lipid load, these macrophages transform into foam cells. Accumulation of foam cells in the vasculature overtime causes formation of the fatty streak and subsequently, an atherosclerosis plaque

Similar articles

Cited by

References

    1. Finsterer J, et al. EFNS guidelines on the molecular diagnosis of mitochondrial disorders. Eur. J. Neurol. 2009;16:1255–1264. doi: 10.1111/j.1468-1331.2009.02811.x. - DOI - PubMed
    1. Mancuso M, et al. The m.3243A>G mitochondrial DNA mutation and related phenotypes. A matter of gender? J. Neurol. 2014;261:504–510. doi: 10.1007/s00415-013-7225-3. - DOI - PubMed
    1. Pavlakis SG, Phillips PC, DiMauro S, De Vivo DC, Rowland LP. Mitochondrial myopathy, encephalopathy, lactic acidosis, and strokelike episodes: a distinctive clinical syndrome. Ann. Neurol. 1984;16:481–488. doi: 10.1002/ana.410160409. - DOI - PubMed
    1. Majamaa K, Rusanen H, Remes AM, Pyhtinen J, Hassinen IE. Increase of blood NAD+ and attenuation of lactacidemia during nicotinamide treatment of a patient with the MELAS syndrome. Life Sci. 1996;58:691–699. doi: 10.1016/S0024-3205(96)80008-7. - DOI - PubMed
    1. Hayashi G, Cortopassi G. Oxidative stress in inherited mitochondrial diseases. Free Radic. Biol. Med. 2015;88:10–17. doi: 10.1016/j.freeradbiomed.2015.05.039. - DOI - PMC - PubMed

Publication types