. 2019 Oct 22;9(1):15093.
doi: 10.1038/s41598-019-50039-w.

Dynamics of beneficial epidemics

Affiliations

Dynamics of beneficial epidemics

Andrew Berdahl et al. Sci Rep. .

Abstract

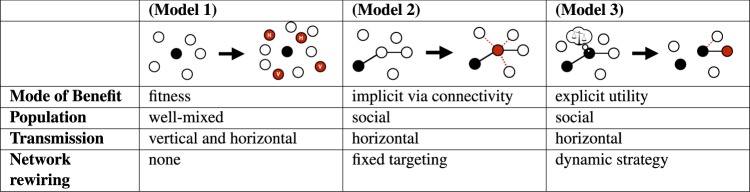
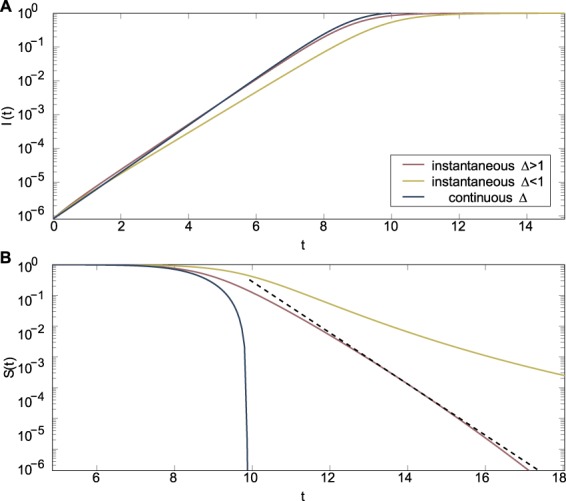
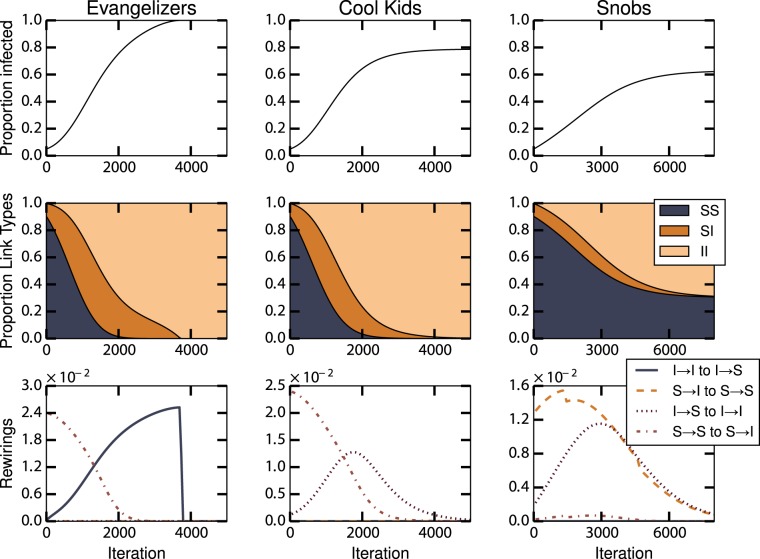
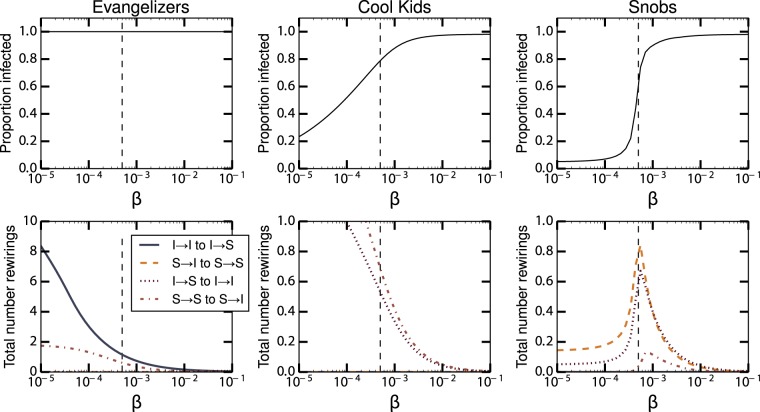
Pathogens can spread epidemically through populations. Beneficial contagions, such as viruses that enhance host survival or technological innovations that improve quality of life, also have the potential to spread epidemically. How do the dynamics of beneficial biological and social epidemics differ from those of detrimental epidemics? We investigate this question using a breadth-first modeling approach involving three distinct theoretical models. First, in the context of population genetics, we show that a horizontally-transmissible element that increases fitness, such as viral DNA, spreads superexponentially through a population, more quickly than a beneficial mutation. Second, in the context of behavioral epidemiology, we show that infections that cause increased connectivity lead to superexponential fixation in the population. Third, in the context of dynamic social networks, we find that preferences for increased global infection accelerate spread and produce superexponential fixation, but preferences for local assortativity halt epidemics by disconnecting the infected from the susceptible. We conclude that the dynamics of beneficial biological and social epidemics are characterized by the rapid spread of beneficial elements, which is facilitated in biological systems by horizontal transmission and in social systems by active spreading behavior of infected individuals.


Conflict of interest statement

The authors declare no competing interests.

Figures

Figure 1
Figure 1
Comparison of bene models. In the three schematics the black arrow represents one increment of time, the black circles are infected individuals, the red circles are newly infected individuals, and the open circles are susceptible individuals. In Model 1 H represents infection from horizontal transmission and V from vertical transmission. In Model 2 dashed red lines indicated new social connections and solid black lines indicated existing connections. The same holds for Model 3, with the addition of strategic rewiring, which includes both adding new links and severing certain existing ones.
Figure 2
Figure 2
Perfect targeting (α=0) initial and final dynamic regime. (A) The fixation dynamics are shown for both the instantaneous and continuous link generation models. In the continuous model the convergence to complete fixation is in finite time. For the instantaneous model, complete fixation is approached faster than exponentially (when Δ>1, dotted straight line for comparison) or is not approached even for very long times (when Δ<1). (B) The initial dynamics is given for the same cases. In all these plots the recovery rate is r=0 and the transmission rate β=1/2, the initial degree k0=3.
Figure 3
Figure 3
Dynamical regimes for three different models of epidemics with utility benefits. The first row shows the number of infected individuals over time. The second row shows proportion of [II], [SI] and [SS] over time. The third row shows the rate of different rewirings, where for example, ‘I → I to I → S’ indicates the rewiring by an infected individual from an infected to a susceptible. Here N=1000, E=2000, Iinit=0.05, and β=5×10⁴.
Figure 4
Figure 4
Results of strategic rewiring epidemics with varying transmission rates β. The top row shows the proportion of infected for the three cases discussed in the text. The bottom row shows the cumulative rewiring performed (per edge). The value of β used for Fig. 3 is shown as a vertical dashed line.

References

    1. Salathé M, et al. A high-resolution human contact network for infectious disease transmission. Proc. Natl. Acad. Sci. USA. 2010;107:22020–22025. doi: 10.1073/pnas.1009094108. - DOI - PMC - PubMed
    1. Yang W, Cowling BJ, Lau EH, Shaman J. Forecasting influenza epidemics in Hong Kong. PLoS Comput. Biol. 2015;11:1–17. - PMC - PubMed
    1. Barmak DH, Dorso C, Otero M. Modelling dengue epidemic spreading with human mobility. Physica A. 2016;447:129–140. doi: 10.1016/j.physa.2015.12.015. - DOI
    1. Pounds JA, et al. Widespread amphibian extinctions from epidemic disease driven by global warming. Nature. 2006;439:161–167. doi: 10.1038/nature04246. - DOI - PubMed
    1. Osdaghi E, et al. First report of curtobacterium flaccumfaciens pv. flaccumfaciens causing cowpea bacterial wilt in Iran. J. Phytopathology. 2015;163:653–656. doi: 10.1111/jph.12300. - DOI

Publication types

MeSH terms