. 2019 Oct 22;9(1):15141.
doi: 10.1038/s41598-019-51609-8.

Patterns of human social contact and contact with animals in Shanghai, China

Affiliations

Patterns of human social contact and contact with animals in Shanghai, China

Juanjuan Zhang et al. Sci Rep. .

Abstract

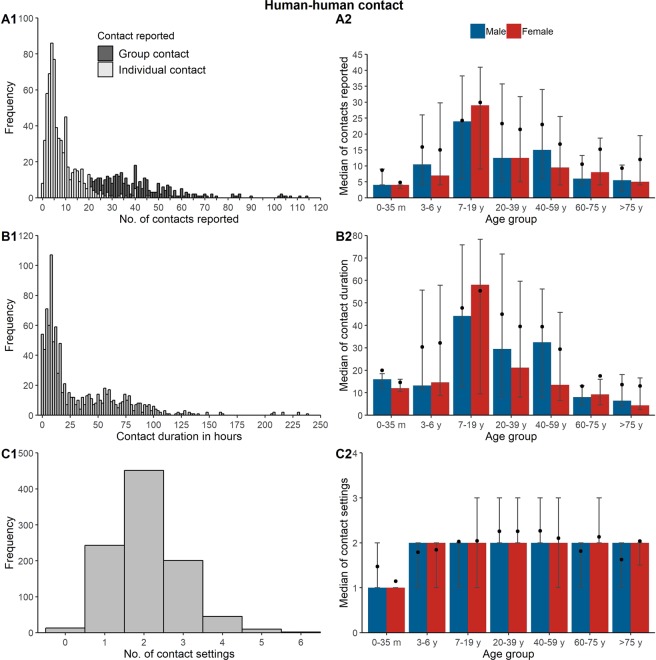
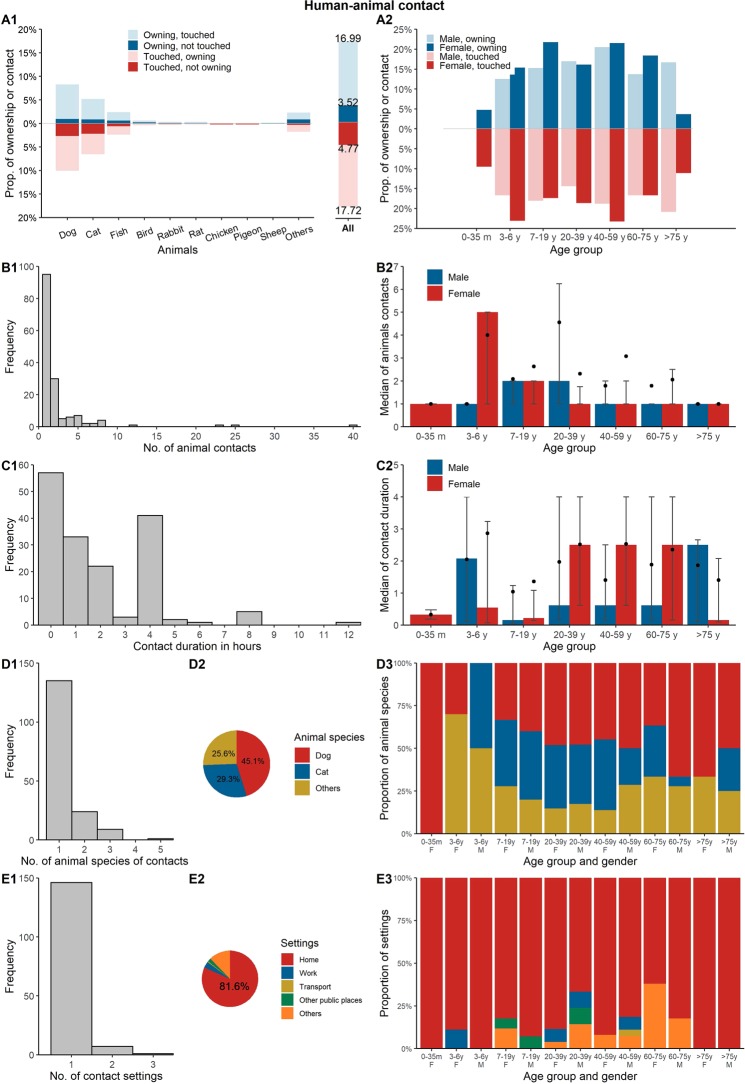
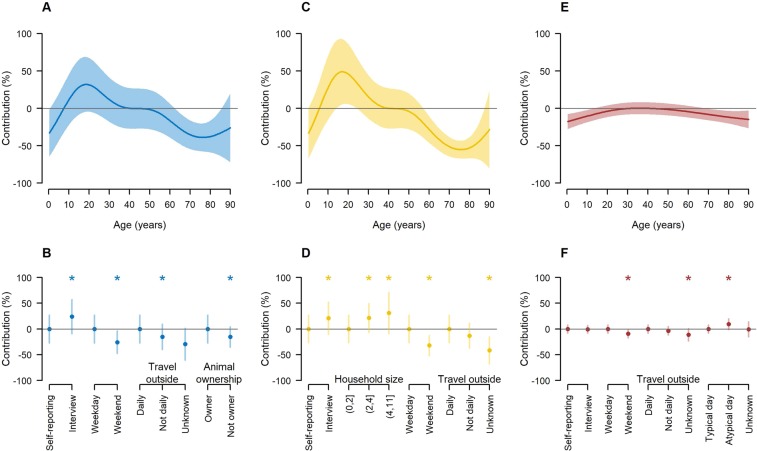
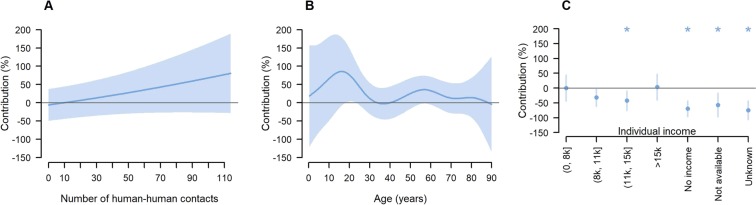
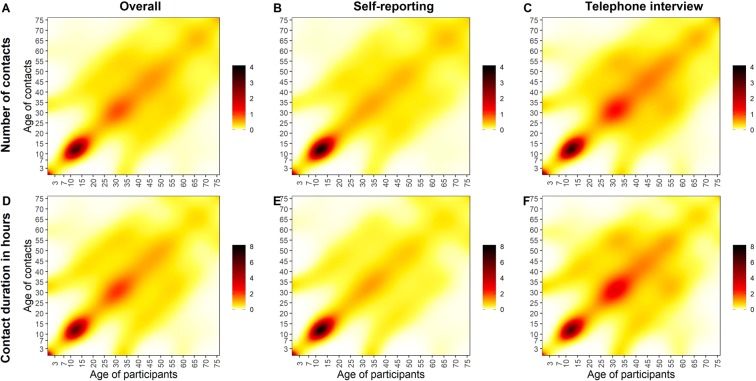
East Asia is as a principal hotspot for emerging zoonotic infections. Understanding the likely pathways for their emergence and spread requires knowledge on human-human and human-animal contacts, but such studies are rare. We used self-completed and interviewer-completed contact diaries to quantify patterns of these contacts for 965 individuals in 2017/2018 in a high-income densely-populated area of China, Shanghai City. Interviewer-completed diaries recorded more social contacts (19.3 vs. 18.0) and longer social contact duration (35.0 vs. 29.1 hours) than self-reporting. Strong age-assortativity was observed in all age groups especially among young participants (aged 7-20) and middle aged participants (25-55 years). 17.7% of participants reported touching animals (15.3% (pets), 0.0% (poultry) and 0.1% (livestock)). Human-human contact was very frequent but contact with animals (especially poultry) was rare although associated with frequent human-human contact. Hence, this densely populated area is more likely to act as an accelerator for human-human spread but less likely to be at the source of a zoonosis outbreak. We also propose that telephone interview at the end of reporting day is a potential improvement of the design of future contact surveys.


Conflict of interest statement

H.Y. has received investigator-initiated research funding from Sanofi Pasteur, GlaxoSmithKline, and Yichang HEC Changjiang Pharmaceutical Company. Other authors have declared that no competing interests exist.

Figures

Figure 1
Figure 1
Distribution of human-human contact patterns (including the number of contacts, contact duration, and number of settings). The error bars in the right panels correspond to 25% and 75% quantiles, and the solid points correspond to the means.
Figure 2
Figure 2
Distribution of human-animal contact patterns (including the probability of reporting animal ownership or animal contact, number of animal contacts, contact duration, number of species, and number of settings). (A1) Show the proportion of owners touching their own animals, the proportion of owned animals not touched, the proportion of touched animals that are their own and the proportion of touched animals not owned, respectively. All of the age groups and gender in the right panels refer to the humans. The error bars correspond to 25% and 75% quantiles, and the solid points correspond to the means.
Figure 3
Figure 3
Estimates of percentage contribution of variables in human-human regression models. (A,B) Correspond to the predicted number of contacts; (C,D) correspond to the contact duration; (E,F) correspond to the number of contact settings. The predicted values are relative to a 40 years old person with other characteristics referring to the first level of each factor. 95% Confidence intervals are denoted by a shaded region as (A,C,E), or error bars as (B,D,F). Significant covariates of the regression models (at the 5% level) are denoted by stars.
Figure 4
Figure 4
Estimates of percentage contribution of variables in the human-animal contact regression model. The predicted values are relative to a 40 years old person reporting the annual income of (0, 8000], and making contacts with 10 people. 95% confidence intervals are denoted by a shaded region as (A,B), or error bars as (C). Significant covariates of the regression models (at the 5% level) are denoted by stars.
Figure 5
Figure 5
Smoothed human-human contact matrix. (AC) Show the predicted average number of total contacts per day per participant and that stratified by different modes of data collection; (DF) show the predicted average contact duration per day per participant and that stratified by different modes of data collection.

Similar articles

Cited by

References

    1. Allen T, et al. Global hotspots and correlates of emerging zoonotic diseases. Nature communications. 2017;8:1124. doi: 10.1038/s41467-017-00923-8. - DOI - PMC - PubMed
    1. Lloyd-Smith JO, et al. Epidemic Dynamics at the Human-Animal. Interface. Science. 2009;326:1362. doi: 10.1126/science.1177345. - DOI - PMC - PubMed
    1. Pourbohloul, B. Modeling infectious diseases in humans and animals. (Princeton University Press, 2008).
    1. Basta NE, Chao DL, Halloran ME, Matrajt L, Jr IML. Strategies for Pandemic and Seasonal Influenza Vaccination of Schoolchildren in the United States. American Journal of Epidemiology. 2009;170:679–686. doi: 10.1093/aje/kwp237. - DOI - PMC - PubMed
    1. Medlock J, Galvani AP. Optimizing influenza vaccine distribution. Science. 2009;325:1705. doi: 10.1126/science.1175570. - DOI - PubMed

Publication types